Full Length Research Paper
Why is understanding customer attitude toward 4Ps
marketing mix important? The case of the livestock
input industry in Indonesia
Sutrisno Hadi Purnomo
1,2*, Yi-Hsuan Lee
3and Soekartawi
41
Department of Business Administration, National Central University, Taiwan. 2
Faculty of Agriculture, Sebelas Maret University, Indonesia. 3
Department of Business Administration National Central University, Taiwan.
4
Department of Agricultural Economics, Brawijaya University, Indonesia.
Accepted 25 February, 2010
One of the main issues of agricultural development in Indonesia was marketing of agricultural products. It was not only due to the weakness of agricultural marketing policy, but also lack of research, particularly research related to the costumer’s attitude of marketing mix. Understanding of costumer’s attitude of marketing mix was really important. Many literatures indicated that one of the advantages of this was to design the marketing mix strategy. The main purposes of this study were, first, to evaluate the customer’s attitude toward marketing mix among distinct market segments of livestock input industry, and second, to examine the influence of demographic variables on customer attitude toward marketing mix. The methodology used in this study was survey method through distribute of questionnaire to respondents. Respondent of this study was poultry livestock farmer who have used company feed product and kept livestock in Java Island, Indonesia. The findings of this study revealed that, first, the three market segments were perceived differently and second, there was no significance difference among various demographic variables. This finding showed the importance of market segmentation to determine the appropriate strategy. Eventually, this research provided guidance for agribusiness managers to investigate deeply the customers understanding, preferences and perception.
Key words: Customer’s attitude, marketing mix, livestock input industry.
INTRODUCTION
Many authors argue that understanding the customer attitude toward 4Ps (product, price, place and promotion) marketing mix is important. In case of Indonesia as a big developing country in Asia, the issues of customer attitude toward 4Ps of agribusiness particularly in livestock input industry is crucial. The question is why un-derstanding the customer attitude toward 4Ps marketing mix is important in livestock input industry?
Constantinides (2006) emphasizes that marketing mix is a framework of the dominant marketing management
*Corresponding author. E-mail: [email protected]. Tel: +886-3-422-7151 ext 66100. Fax: +886-3-422-2891.
paradigm to identify market development, environmental changes and trends. Several studies confirm that the 4Ps is indeed the trusted conceptual platform of practitioners dealing with operational marketing issues (Romano and Ratnatunga, 1995; Coviello et al., 2000). The wide acceptance of the 4Ps among field marketers is the result of their profound exposure to this concept during college years, since identifying the 4Ps as the controllable parameters is likely to influence the consumer buying process and decisions (Brassington and Pettitt, 2003; Soekartawi, 2005a).
agribusiness system which provides farmers and technology employed, and region of production (Rosenberg and Turvey, 2001). Segmentation is an important element of market planning. It is, in fact, at the very crucial of developing a thorough, well-reasoned, competitive advantage achieving strategic plan for a product and a business unit (Sudharsan and Winter, 1998; Soekartawi, 2005a). Successful serving targeted customers involves first, segmenting the market into smaller more homogeneous customer groups, profiling these groups, then deciding which customer’s segments to pursue, and then developing the 4Ps marketing mix to best serve the chosen target customers (Alexander et al., 2005).
This study is to evaluate different segments of customers’ attitude toward 4Ps. Using sales classes as a measurement of farm size, this study classifies customers into three segments: small, middle and large. In fact, the study related to customer attitude in the farmer producer has not been sufficiently conducted. Therefore, two research questions guide this study: (1) Do customer’s attitude toward marketing mix among market segments is perceived differently? and (2) Do demographic variables influence the customer attitude toward marketing mix?
It is expected that this research would provide recommendation for livestock input suppliers to develop greater understanding of how to serve existing and potential customer based on 4Ps concept for a basis to meet profitability of their business.
LITERATURE REVIEW
Several studies measuring customer attitude towards marketing mix have been carried out in industries and emerging nations (Gaski and Etzel, 1986; Wee and Chan, 1989; Chan et al., 1990; Bhuian and Kim, 1999; Lysonski et al., 2003; Chan and Cui, 2004). A significant study in measuring consumer sentiments towards marketing practices was carried out by Gaski and Etzel (1986, 2005). Other researchers Wee and Chan (1989) found that the pricing strategies and advertising appeals must also be adapted to suit the consumer’s needs and tastes. The influence of demographic variables on attitudes towards marketing was found that the less educated, the lower income group, and those with no jobs or less privileged jobs were most hostile towards marketing. Bhuian and Kim (1999) examined the influence of country origin toward marketing mix element
and found that consumers prefer most the marketing mix element related to the product of Japan and USA.
Marketing strategy for industrial market
Harbor et al. (2006) pointed out that the market interaction between agricultural input industry and farmer producers is similar to that observed in a B2B environment. In this interaction, farmer producer is the buyer and agricultural input industry in this case livestock input industry is the industrial market. Thus, understanding the drivers and determinants of this transformation process is critical to a successful marketing strategy to serve the farmer producers of the future (Boehlje, 1992). The ability of agricultural input suppliers to serve farmer producers depends on the effective exchange of information between firms and consumers. Insufficient information may leave farmer producers exposed to inappropriate products and can limit firms' ability to respond to farm producers' needs (Tripp and Pal, 2000).
Many marketing researchers have broadly argued marketing strategy to be a concept built on robust platform of segmentation, targeting and positioning (Ferrell et al., 2002; Walker et al., 2001). Marketing strategy requires decisions about the specific target of customers. Besides, marketing mix may be developed to target market by positioning it suitably in a superior way. In this context, the study of the effectiveness of the marketing tools is essential for an appropriate marketing strategy. Appropriateness of marketing strategies may be viewed as the congruence of market offerings of a set of products and its corresponding consumer perception among its target segment. More the target segment is able to understand and believe the cues (Richardson et al., 1994) communicated by the firms through marketing mix, more is the effectiveness of the marketing strategies. Recently, Constantinides (2006) reviewed the criticisms on the 4Ps marketing mix emanating from industrial market area. He mentioned most researchers agree that industrial market is indeed different from consumer marketing in a number of aspects like the formalized decision making procedures, the buying practices and rationality of choices and the special character of the industrial customer. Long term relationships, based on empathy, mutual benefits and co-operation (Flint et al., 1997), understanding of customer’s needs and service (Shaw, 1995) are other important success factors.
Market segmentation in the agricultural industry
(Sudharsan and Winter, 1998). Griffith and Pol (1994) reported a successful use of firm demographic data for segmenting industrial markets. Laughlin and Taylor (1991) proposed that industries can be classified based on their respective concentration ratios and product customization requirements. They suggest that the classification be used as the basis for segment selection decisions.
In the agribusiness market as an industrial market, customer segmentation is also a way for better understanding customer preferences for products, services, and information which are important to their industries. The customer segmentation is based on a two-dimensional characterization of the producer market. The characterization is defined in terms of: 1) size measured by gross sales, and 2) purchasing behavior (Boehlje, 1992). Furthermore, he argued that market segmentation frequently consists of grouping buyers into segments according to sales classes and then developing marketing strategies to serve the different segments. Each of the segments is different; for instance in terms of size, type of technology, farm management and so on (Gloy and Akridge, 1999).
The process of segmentation is different from targeting (choosing which segments to address) and positioning (designing an appropriate marketing mix for each segment). The overall intent is to identify groups of similar customers and potential customers; to prioritize the groups to address; to understand their behavior, and to respond with appropriate marketing strategies that satisfy the different preferences of each chosen segment (Sengupta and Chattopadhyay, 2006).
Characteristic of farmer producers
This study used customer segmentation based on sales classes range divided into three classes: small, medium and large. These three classes have different character-istics in terms of buying behavior, farm management, type of technology and so forth. Harbor et al. (2006) observed that in many instances, smaller farms behave like retail consumers. Relatively speaking, they wield little individual market power. On the other hand, larger farms have the ability to interact with input and output markets in a more business-like manner, taking advantage of powers of negotiation, economies of scale, and increased market access. As a result, the relationship between agribusinesses and their commercial farm customers is much different from that between agricultural firms and
those operations that fit the historical farm profile. Most investigations of small farm characteristics
combine two or more of these classifications to arrive at a more limited and conclusive definition. However, small farms have been generally described as farms with limited resources, farms with a small volume of farm product sales, family farms, retirement farms, and part-time farms (Lewis, 1978).
RESEARCH METHODOLOGY
The data of this study was collected from customer of PT Charoen Pokphand Indonesia (CPI). CPI is one of Multinational Companies (MNCs) in agribusiness whose core business is feed mill
manufacturing. The headquarter of CPI is in Thailand, and its subsidiaries are located in several countries, such as Indonesia, Malaysia, China, Korea, Singapore, Taiwan, Hong Kong, livestock in Java Island, Indonesia. Using random sampling method this research selected 600 customers. There were three sizes of distributed to respondents. The response rates were 50% for small size, 47% for medium size, and 53% for large size. Total usable questionnaires were 297, consisting of 95 small size customers, 85 medium size customers, and 120 large size customers. The samples were selected using the following formula (Djarwanto and Pangestu, 1996):
p = Percentage of sample proportion (in between 0 - 1)
P = Total population
E = Error (<10 %).
Measurement
The questionnaire was developed through two steps. In the first step, the questionnaire was adopted from two studies which included a measurement of consumer attitudes toward marketing mix. The first study was developed by Gaski and Etzel (1986), about the measurement of customer sentiment toward marketing mix variables. The second study was by Bhuian and Kim (1999) about measuring customer attitude toward marketing mix element pertaining to foreign products in an emerging international market. This study adopted 17 item questions from Gaski and Etzel (1986) and 5 items from Bhuian and Kim (1999). We made the other 10 questions to reflect the characteristics of agriculture product. Thus, totally 32 items were used in this questionnaire for the study. In the second step, several in depth interviews were conducted with General Managers and the Marketing Managers of CPI to explore the research area and clarify terminology. After the in depth review, several items were revised to reflect the thinking characteristic of product and local people.
Table 1. Respondent’s profiles.
Customer sizes Number of respondents by province Total
West Central East
Small (sales: less than 500 ton/year) 19 38 38 95
Medium (sales between 500 - 1000 ton/year) 15 32 35 82
Large (sales more than 1000 ton/year) 54 24 42 120
Total 88 94 115 297
Note: Exchange rate 1 ton = 400 USD.
Table 2. Reliability for component after purification.
Attribute Items after purification Chronbach α
Product 1,2,3,4,5,6,7,8,9,10 0.779
Price 1,2,3,4,5 0.726
Place 1,3,4,6,7 0.707
Promotion 1,2,5,6,7,9,10 0.651
Data analyses
Respondent’s demographic profile
To provide a better insight into the participants, respondent’s demographic profile including province, gender, age, and education were analyzed. The province area was found West Java 29.6%, Central Java 31.6% and East Java 38.7%. The gender composition was male respondents (75.8%) and female respondents (24.2%). The age composition of respondent was 20.5% for age range less than 35 years old; 63.6% for age range 35 - 50 years old and 15.8% for age range more than 50 year old. As for the level of education, the highest level was senior high school (64.3%), the second was bachelor degree (16.2%), then followed by junior high school (11.8%) and last was master’s degree (7.7%).
In addition, the respondent’s profile about customer size shows us the information dispersion of customer on each province and size. The data shows that West Java has highest number in the large farmer (54) more than small (19) and medium (15). Central Java has highest number in the small farmer (38). Meanwhile, East Java has a number customer with no striking differences among customer size (Table 1).
Data accuracy analysis
Reliability and validity were tested for data accuracy analysis purpose. Reliability test criteria included item-to-total correlation
value of 0.3, Cronbach α value of 0.6. As can be seen in Table 2, all
the values were above the required threshold values. Thus, the results provided evidence of reliability. The detailed results of the items retained for further analysis after purification using
Cronbach’s α value (items retained after purification are shown in
the Appendix). After purification of the items, acceptable reliability was demonstrated for each of the marketing mix variables: 0.779 for product, 0.726 for price, 0.707 for place/distribution, and 0.651 for promotion. For details, it is presented in Table 2.
Besides reliability, discriminant validity was also tested for the scales.. Discriminability refers to the ability empirically to differentiate one construct from other constructs that may be similar, and to point out what is unrelated to the construct. This study did not use different methods of measurement, only
discriminant validity could be tested. Discriminant validity can be indicated by predictably low correlations between the measure of interest and other measures that are supposedly not measuring the same variable or concept. To verify discriminant validity, correlations among the four scales were obtained for the combined sample.
According to Gaski and Etzel (1986), if α coefficient considerably
higher than its correlations with other scales, discriminant validity is upheld. Table 3 shows the correlation between the scale categories. The values, which range from 0.092 - 0.459, clearly
indicate that each scale has α coefficient adequately higher than its
correlations with other scales. This shows that discriminant validity of the scale is upheld.
RESULT AND DISCUSSION
One-way Analysis of Variance (ANOVA) was conducted to compare mean consumer attitude towards marketing mix variables across various demographic variables. The result revealed that there is not significant difference among various demographic variables such as provincial area, gender, age as well as educational level. These results indicated that demographic profile does not influence the customer attitude toward 4Ps.
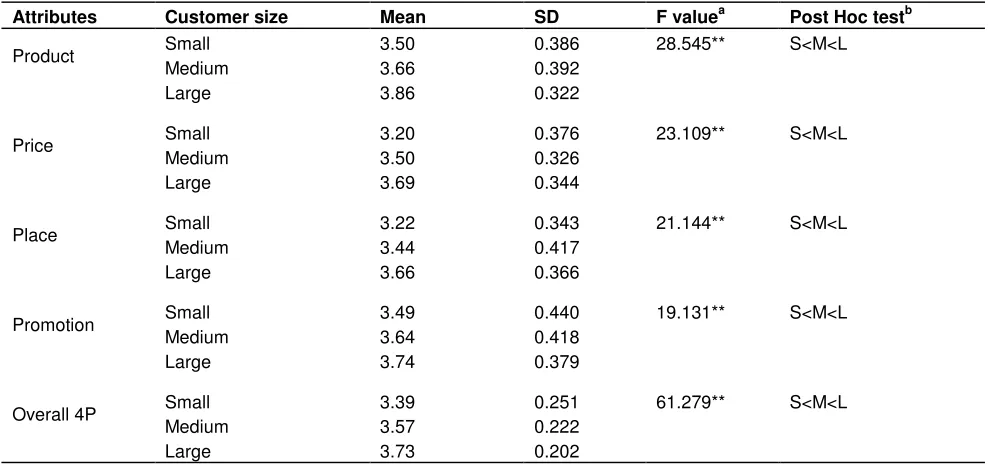
Meanwhile, One-way ANOVA was conducted to examine differences in attitude among groups customer size. Mean score of attitude was used to examine the differences. As shown in the Table 4, customer attitude toward overall attributes marketing mix was perceived differently among customer sizes (F = 61.279, p < 0.01). Furthermore, customer attitude toward each attribute marketing mix was varied among customer sizes, in the product attribute (F = 28.545, p < 0.01); Price (F = 23.109, p < 0.01); place (F = 21.144, p < 0.01) and promotion (F = 19.131, p < 0.01).
Table 3. Correlation between scale categories.
Scale categories Product Price Place Promotion
Product 1 0.171 0.269 0.459
Price 1 0.092 0.247
Place 1 0.355
Promotion 1
Table 4. One-way ANOVA of customer attitude.
Attributes Customer size Mean SD F valuea Post Hoc testb
Product
Small 3.50 0.386 28.545** S<M<L
Medium 3.66 0.392
Large 3.86 0.322
Price
Small 3.20 0.376 23.109** S<M<L
Medium 3.50 0.326
Large 3.69 0.344
Place
Small 3.22 0.343 21.144** S<M<L
Medium 3.44 0.417
Large 3.66 0.366
Promotion
Small 3.49 0.440 19.131** S<M<L
Medium 3.64 0.418
Large 3.74 0.379
Overall 4P
Small 3.39 0.251 61.279** S<M<L
Medium 3.57 0.222
Large 3.73 0.202
a
*P < .05 and **P < .01. bPost hoc test Scheffe’s multiple comparisons differences at p < .05.
post hoc test indicated that there were differences (p < 0.01) between each size, with small size as the lowest, followed by medium and larger size as the highest score. These differences probably were due to the character-istics of farm producers such as case buying behavior, farm management, type of technology and so forth among different sizes. Harbor et al. (2006) notes that smaller farms behave like retail consumer, they wield little individual market power. On the other hand, larger farms have ability to interact with input and output markets in a more business-like manner, taking advantage of powers of negotiation, economies of scale, and increased market access. Those characteristic influence the attitude of small customer much more negative than larger farm.
Another study with Indonesia as a research setting, Martana (2002) concludes that livestock farmers in Jogjakarta, Indonesia, have different attitudes among customers size segment. Another earlier study by Suwarsono (1997) investigates the attitude of fishpond farmers in East Java, Indonesia towards marketing mix of firm. It was found different attitudes among customer segments. Those findings indicated that the firm must pay more attention to clarify each distinct market
segment in order to determine strategy appropriate with the customer perception.
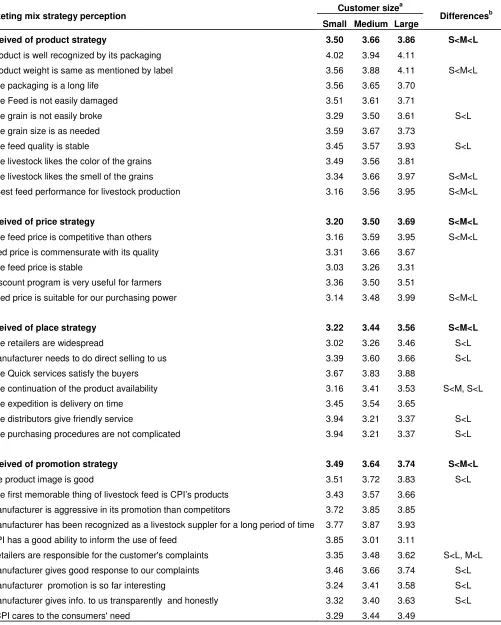
Table 5. A comparison of marketing mix items among customer sizes.
Marketing mix strategy perception Customer size
a
Differencesb Small Medium Large
Perceived of product strategy 3.50 3.66 3.86 S<M<L
1. Product is well recognized by its packaging 4.02 3.94 4.11
2. Product weight is same as mentioned by label 3.56 3.88 4.11 S<M<L
3. The packaging is a long life 3.56 3.65 3.70
4. The Feed is not easily damaged 3.51 3.61 3.71
5. The grain is not easily broke 3.29 3.50 3.61 S<L
6. The grain size is as needed 3.59 3.67 3.73
7. The feed quality is stable 3.45 3.57 3.93 S<L
8. The livestock likes the color of the grains 3.49 3.56 3.81
9. The livestock likes the smell of the grains 3.34 3.66 3.97 S<M<L
10. Best feed performance for livestock production 3.16 3.56 3.95 S<M<L
Perceived of price strategy 3.20 3.50 3.69 S<M<L
1. The feed price is competitive than others 3.16 3.59 3.95 S<M<L
2. feed price is commensurate with its quality 3.31 3.66 3.67
3. The feed price is stable 3.03 3.26 3.31
4. Discount program is very useful for farmers 3.36 3.50 3.51
5. Feed price is suitable for our purchasing power 3.14 3.48 3.99 S<M<L
Perceived of place strategy 3.22 3.44 3.56 S<M<L
1. The retailers are widespread 3.02 3.26 3.46 S<L
2. Manufacturer needs to do direct selling to us 3.39 3.60 3.66 S<L
3. The Quick services satisfy the buyers 3.67 3.83 3.88
4. The continuation of the product availability 3.16 3.41 3.53 S<M, S<L
5. The expedition is delivery on time 3.45 3.54 3.65
6. The distributors give friendly service 3.94 3.21 3.37 S<L
7. The purchasing procedures are not complicated 3.94 3.21 3.37 S<L
Perceived of promotion strategy 3.49 3.64 3.74 S<M<L
1.The product image is good 3.51 3.72 3.83 S<L
2. The first memorable thing of livestock feed is CPI’s products 3.43 3.57 3.66
3. Manufacturer is aggressive in its promotion than competitors 3.72 3.85 3.85
4. Manufacturer has been recognized as a livestock suppler for a long period of time 3.77 3.87 3.93
5. CPI has a good ability to inform the use of feed 3.85 3.01 3.11
6. Retailers are responsible for the customer's complaints 3.35 3.48 3.62 S<L, M<L
7. Manufacturer gives good response to our complaints 3.46 3.66 3.74 S<L
8. Manufacturer promotion is so far interesting 3.24 3.41 3.58 S<L
9. Manufacturer gives info. to us transparently and honestly 3.32 3.40 3.63 S<L
10. CPI cares to the consumers' need 3.29 3.44 3.49
Note: aMean values for marketing mix items, based on a 5 Likert-type scale with strongly disagree =1 to strongly agree = 5. bScheffe’s multiple
development. Therefore technology development has increased the output and accrued the benefit (Singh and Williamson, 1985).
On the price strategy, there are two items with significant different among three segments. They are “The feed price is competitive than others” and “feed price is suitable for our purchasing power”. Larger farm with a big volume of farm product may take advantage power of negotiation with suppliers or manufacturers (Harbor et al., 2006). Besides, small farmers may have a long distribution channel that influences the product price. Therefore, the larger farmer will get the lower price. On the place strategy, there are five items with significant differences among three segments. They are “The retailers are widespread”, “Manufacturer needs to do direct selling to us”, “The continuation of the product availability”, “The distributors give friendly service” and “The purchasing procedures are not complicated”. In reality, larger farmers have ability to interact with manufacturer or retailer in a more business like manner. This situation cause the manufacturer or retailer give serve better to the larger than small farmer.
On the promotion strategy, there are five items with significant differences among three segments. They are “The product image is good”, “Retailers are responsible for the customer's complaints”, “Manufacturer gives good response to our complaints”, “Manufacturer promotion is so far interesting” and “Manufacturer gives information to us transparently and honestly”. Small farmers find difficulties to access market information. They need to know advantages and disadvantages of each market outlet, but in reality they do not have opportunity to retrieve such information.
CONCLUSION, IMPLICATION AND FURTHER RESEARCH
Based on the above discussion it is concluded that, first, the three market segments are perceived differently. This is because an accuracy of market segmentation will produce effectiveness of marketing strategies. This may be viewed as the congruence of market offer of a set of products and services and its corresponding consumer perception among the target segment. More the target segment is able to understand and believe the cues communicated by the firms through 4Ps marketing mix (Richardson et al., 1994). Similarly, understanding consumer’s need, value, and behavior associated with the product can help the marketers to develop segments around brand loyalty, price-sensitive, or feature-sensitive respondents (Feldman, 2006). The second conclusion is there is no significance difference among various demo-graphic variables. This findings show the importance of market segmentation to determine the appropriate strategy.
The suggestion that may be taken from this research is the need for having guidance for agribusiness managers
to investigate deeply the customers understanding, preferences and perception. It is understandable because marketing strategies can determine appropriate strate-gies among three distinct segments based on particular characteristics.
Consequently, this kind of research shall be done in many places considering only few studies on customer attitudes to farm producers are available. The research setting should also be extended to include more than one company and more than one kind of agricultural input. Further, follow-up research on the same issues of this study after a period of time is needed to observe the pattern of changes in the perception of customers.
REFERENCES
Alexander CE, Wilson CA, Foley DH (2005). Agricultural Input Market Segments: Who Is Buying What? J. Agribusiness 23: 114.
Beierlein JG, Woolverton MW (1991). Agribusiness Marketing. Prentice hall, Englewood cliffs. New Jersey pp. 3-10.
Boehlje M (1992). Alternative Models of Structural Change in Agriculture and Related Industries. Agribusiness 8: 219-233. Bhuian SN, Kim D (1999). Customer attitude toward marketing mix
element pertaining to foreign products in an emerging international
market, Int. J. Commerce Manag. 9: 116-137.
Brassington F, Pettitt S (2003). Principles of Marketing, Third Edition, Prentice Hall/Financial Times. New Jersey.
Chan E, Yau OHM, Chan R (1990). Consumer sentiment in Australia: A replication and cross-national comparison. Euro. J. Mark 24(10): 44-58.
Chan T, Cui G (2004). Consumer attitudes towards marketing in a transitional economy: a replication and extension. J. Consumer Mark. 21: 10-26.
Constantinides E (2006). The Marketing Mix Revisited: Towards the
21st Century Marketing. J. MarkManag, 22: 407-438.
Coviello NE, Brodie RJ, Munro HJ (2000). An investigation of marketing
practice by firm size. J. BusVenturing, 15: 523-545.
Djarwanto, Pangestu S (1996). Survey Research Methodology. LP3ES. Jakarta. Indonesia.
Feldman D (2006). Segmentation building blocks. Mark Res. Vol. 18/2.
p. 23-29.
Ferrel OC, Hartline, MD, Lucas GH Jr (2002). Marketing Strategy, 2nd
ed, Thomson southwestern, Bangalore, p.74.
Flint D, Woodruff R, Gardial SF (1997). Customer Value Change in Industrial Marketing Relationships. A Call for New Strategies and Research. Ind Mark Manag, 26: 163 –175.
Gaski RM, Etzel MJ (1986). The Index of Consumer Sentiment toward
Marketing, J. Mark, 50: 71-81.
Gaski JF, Etzel MJ (2005), National aggregate consumer sentiment toward marketing: a thirty-year retrospective and analysis. J. Consumer Res, 31: 859-68.
Gloy BA, Akridge JT (1999). Segmenting the commercial producer
marketplace for agricultural inputs. Int. Food Agribusiness Manag.
Rev. 2: 145-163.
Griffith RL, Pol LA (1994). Segmenting Industrial Market. Ind. Mark
Manag. 23: 39-46.
Harbor AL, Martin MA, Akridge JT (2006). Assessing Agricultural Input Brand Loyalty Among U.S. Mid-Size and Commercial Producers. Annual Meeting, Purdue University, USA.
Laughlin JL, Taylor CR (1991). An approach to industrial market segmentation. Industrial Mark Manag. 20: 127-136.
Lewis JA (1978) Implications of Alternative Definitions of Small Farm: In
Toward a Federal Small Farms Policy. NRC Rep. No. 9, National
Rural Center, Washington DC.
Mark. 37: 385-406.
Martana HB (2002). Customers attitude and perception toward product of feedmill manufacturing. Magister Manag Agribusiness. Gadjah Mada University. Yogyakarta, Indonesia.
Richardson SP, Dick SA and Jain AK (1994), Extrinsic and intrinsic cue effects on perceptions of store brand quality. J. Mark, 58: 28-36. Romano C, Ratnatunga J (1996). The Role of Marketing, Eur J. Mark,
29: 9-30.
Rosenburg A, Turvey CG (1991). Identifying management profiles of
Ontario swine producers through cluster analysis. Rev. Agric. Econ.
13: 201-213.
Sengupta K, Chattopadhyay (2006). Importance of appropriate marketing strategies for sustainability of small business in a developing country. Asia Pacific J. Mark Logistics 18: 328-341. Shaw V (1995). Successful Marketing Strategies, A Study of British and
German Companies in the Machine Tool Industry. Ind. Mark Manag. 21: 329-339.
Singh SP, Williamson H Jr. (1985). Perspectives on the Small Farm (Small, Low-Income Farms in Tennessee). Cooperative Research Program, School Agr, Home Econ., Tennessee State University, Nashville.
Soekartawi (2005a). Marketing Management for Agricultural Products: Theory and Its Application)". RajaGrafindo Persada Press, 3rd Edition, Jakarta, (ISBN: 979-421-207-5).
Sudharsan D, Winter F (1998). Strategic segmentation of industrial
market. The Journal of Business and Industrial Marketing. Santa
Barbara. Vol 13. p 8.
Suwarsono (1997). Customer attitude of fishpond farmers toward marketing mix of firm. Magister Agribusiness Manag. Gadjah Mada University. Yogyakarta. Indonesia.
Tripp L and Pal S (2000). Information and Agricultural Input Market :
Pearl Millet Seed in Rajashtan. J.Int Dev. 12: 133-144.
Walker OC Jr., Boyd HW Jr., Larreche JC (2001). Marketing Strategy. Tata McGraw Hill, New Delhi pp. 12-13.