Directory UMM :Data Elmu:jurnal:A:Agricultural & Forest Meterology:Vol105.Issue4.Dec2000:
Teks penuh
Gambar


Dokumen terkait
First, remote-sensing investigations are discussed, especially those directed toward taking full advantage of the capabilities of the new generation of satellites
The vegetation communities were a perennial, floodplain sacaton grassland (Sporobolus wrightii) and a tree/shrub grouping composed largely of mesquite (Prosopis velutina).
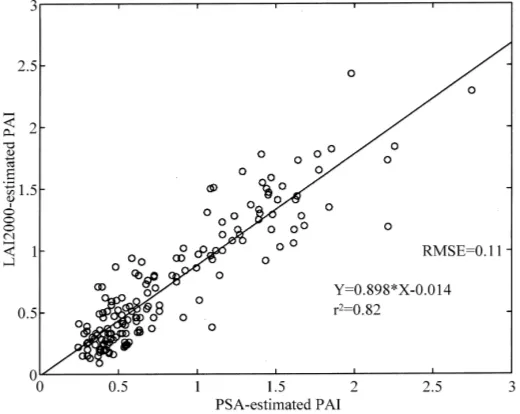
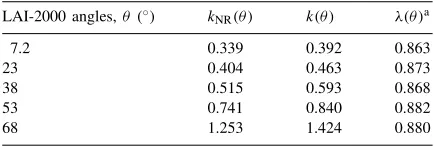
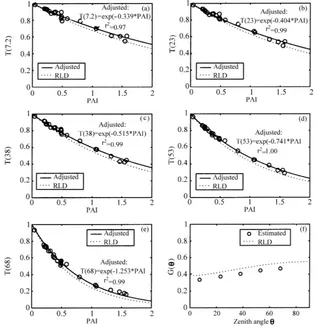
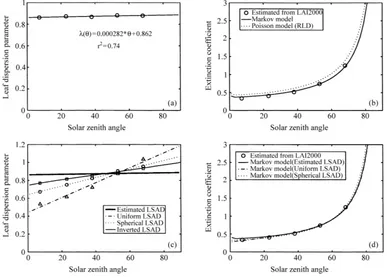
[r]
Contrary to the electrical analogy, where soil and vegetation controls on evaporation are reproduced with the help of empirical surface resistances (allowing for the calculation of
Populus fremontii, a dominant ‘phreatophyte’ in these semi-arid riparian ecosystems, also used mainly groundwater, but at the ephemeral stream site during the summer rainy season
Estimates of evapotranspiration (ET) from riparian vegetation along a 122 m reach of the San Pedro River using both a water balance approach and by scaling up sap flow measurements
Comparison of stomatal NH3 compensation points determined on the basis of apoplastic NH4 + and H + concentrations (horizontal bars) and measured atmospheric NH3 concentrations ( d )
Micrometeorological measurements above the canopy indicated that gaseous Cl compounds were emitted for most of the time, and this was supported by the source/sink distributions
