Directory UMM :Data Elmu:jurnal:A:Agricultural & Forest Meterology:Vol104Issue2Agus2000:
Teks penuh
Gambar
Dokumen terkait
In one group of plants, grown on a homogeneous soil and exposed to mod- erate CO 2 enrichment, isotopic discrimination was signifi- cantly reduced in response to increasing CO 2
Eects of treatments and incubation days on soil process rates of N mineralization, nitri®cation, microbial N assimilation, and the ratios of these rates were analyzed using
Partially as a result of the low methane uptake rates recorded at these high soil moisture values, both the sheltered and the unsheltered plots have signi®cant, negative
Root diameter at soil level (Tables 2 and 3) was larger under low soil water, and clay loam soil type whereas low compaction pressures (0 – 125 kPa) resulted in larger diameter
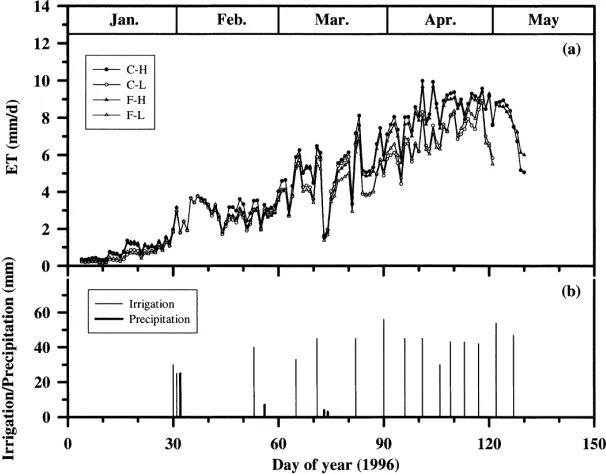
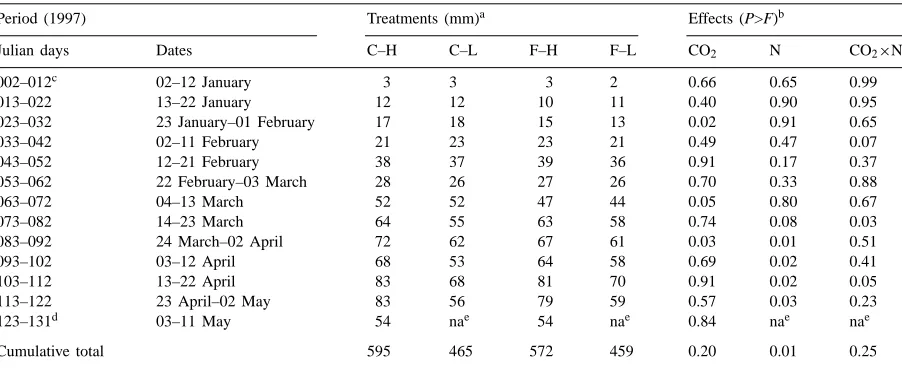
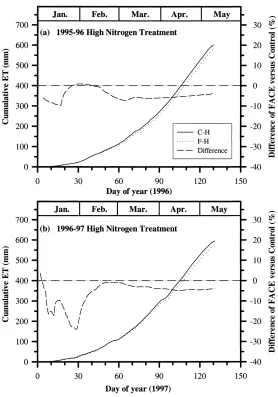
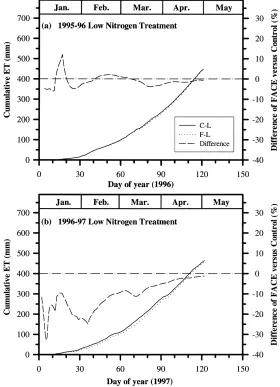
The losses of water by evapotranspiration and evaporation from soil were investigated during two seasons from wheat and lupin crops sown at two times. Evapotranspiration was
The simulated increase in maize grain yield for the HadCM2 climate change scenario for the 2020s was due to the relatively low projected increase in air temperature, and a
In SVAT models, the effect of soil water stress on plant transpiration is generally represented by applying a function depending on soil moisture or soil water potential to
Soil, mulch, and air temperatures were measured with fine-wire thermocouples, the sensible heat flux was determined with an air renewal model from the cubic structure function
