INTERNAL REPORT nr. 2006-031
Planning Report: SEAD
Strategic Environmental Archaeology Database
by
Phil Buckland, Johan Olofsson & Roger Engelmark
Strategic Environmental Archaeology Database
by
Phil Buckland
Roger
Engelmark
Johan
Olofsson
funded by The Swedish Research Council
undertaken at
The Environmental Archaeology Lab.
Dept. Archaeology & Sami Studies
Umeå University
Classification: Internal MAL Report – not for distribution
outside of MAL and those immediately
concerned with this application within VR
(without permission of the authors).
(c) 2006 The authors & MAL
Contact details for authors:
Phil Buckland [email protected]
Johan Olofsson [email protected]
Contents
List of Figures... i
List of Tables ...ii
List of abbreviations ...ii
Database terminology...ii
Flow chart symbols...iii
1
Abstract...1
2
Introduction & Background...1
2.1 The Environmental Archaeology Lab’s Part in SEAD...1
2.2 Need for SEAD ...2
2.3 Summary of Project Scope...2
3
Development Strategy ...3
3.1 Outline...3
3.2 Proposed Developmental Cycle...4
4
Analysis of Existing System ...7
4.1 Data Entities...7
4.1.1 Field data (internal & external)...8
4.1.1.1 Summary ...8
4.1.1.2 Component details...9
4.1.2 Laboratory data ...9
4.1.2.1 Summary ...9
4.1.2.2 Component details...9
4.1.3 Office data...12
4.1.3.1 Summary ...12
4.1.3.2 Component details...12
4.2 Process (Data Flow) Models...13
4.2.1 Data acquisition/creation...13
4.2.1.1 Summary ...13
4.2.1.2 Component details...14
4.2.2 Data manipulation...15
4.2.3 Data storage...16
4.2.3.1 Manually created data ...16
4.2.3.2 Digitally acquired data...16
4.2.3.3 Common data & backups...16
4.3 User & Data Requirements ...16
4.3.1 Data/database scope ...17
4.3.2 Data entry...17
4.3.3 General interface design...17
4.3.4 Data retrieval...17
4.4 Previous Database Related Work at MAL...18
4.4.1 Bugs Coleopteran Ecology Package ...18
4.4.2 Plant macrofossil database preparation...18
4.4.3 ProvBase ...18
4.4.4 MALdb/MALBase...19
4.4.5 Report archive...20
4.4.6 Image database...20
4.5 Potential Users ...21
4.5.1 MAL staff...21
4.5.3 Guest researchers on location at MAL...21
4.5.4 Local interdisciplinary cooperation ...21
4.5.5 Remote researchers and students ...21
5
Database Design (Logical) ...22
5.1 Data Structure & Relationships...22
5.1.1 Introduction...22
5.1.2 Data area definitions ...23
5.1.3 Bilingual interface and searching...24
5.1.4 Data security ...25
5.1.5 Data structure ...25
5.1.5.1 Project data...26
5.1.5.2 Site data...27
5.1.5.3 Sample Group data...28
5.1.5.4 Sample data (including dating evidence)...28
5.1.5.5 Lab & Common data...29
5.2 Potential Queries and Analysis Routes (Processes)...33
5.2.1 Standard Queries...33
5.2.2 Advanced Queries...35
5.3 Local User Interface Design ...37
5.3.1 Data entry and retrieval (process models)...37
5.3.1.1 Data & database preparation...37
5.3.1.2 Biological proxy data entry...40
5.3.1.3 Soil chemistry/property data entry...42
5.3.1.4 Other data and metadata entry ...45
5.3.1.5 Data retrieval...45
5.3.2 GIS ...46
5.4 Internet Access...47
5.4.1 Data retrieval...47
5.4.2 Geographical display of data (maps) ...48
5.4.3 Security and restrictions...49
5.5 Exporting and Reporting Needs...49
5.5.1 Export types ...49
5.5.2 Export formats...52
5.5.3 Templates & standard recording sheets ...52
5.6 Documentation...53
5.7 Expansion Potential ...54
5.7.1 Addition of further proxies ...54
5.7.1.1 Example 1: Expansion to include Lead Isotope data ...55
5.7.1.2 Example 2: Expansion to include Diatom abundance proxy data ...55
5.7.2 Expanding the analytical power and target audience of SEAD ...56
5.8 Backup Strategy ...57
5.9 Maintenance Strategy...57
5.9.1 Database server and database...58
5.9.2 Backup and emergency recovery strategy ...58
5.9.3 Data security, clients and users...58
5.9.4 Update management...58
6
Limited Physical Prototype ...59
6.1 Database Structure ...59
6.1.1 Evaluation ...59
6.2 Project Management Database (MALBase/Maldb)...59
7
Overview of Existing Similar or Related Systems ...60
7.1 ADS – Archaeological Data Service...60
7.2 AIP – Archaeological Investigations Project...61
7.3 Intrasys...61
7.4 EPD – European Pollen Database...62
7.5 Bugs Coleopteran Ecology Package ...62
7.6 The Swedish Sites and Monuments Record (FMIS)...63
8
Research Collaboration ...64
8.1 Sweden...64
8.2 International ...64
9
Research & Teaching...65
9.1 SEAD Publication Strategy...65
9.2 Potential for Use in Research...65
9.3 Potential for Use in Teaching...67
10
Detailed Time/Cost Analysis ...68
10.1 Hardware & Software Requirements ...68
10.1.1 Software ...68
10.1.1.1 Development ...68
10.1.1.2 Operation...69
10.1.2 Hardware...69
10.1.2.1 Development ...69
10.1.2.2 Operation...69
10.2 Programming, Development & Implementation time...70
10.2.1 Skills required for development team ...71
10.2.2 Estimate of programming and database development time ...72
10.2.2.1 Database (backend)...72
10.2.2.2 Local client software (local frontend)...72
10.2.2.3 Onsite GIS interface...72
10.2.2.4 Web interface (remote frontend) including GIS simulation ...72
10.2.3 Documentation...73
10.2.4 Data Conversion, Import and Entry ...73
10.2.5 Implementation, Training and Parallel Running...73
10.2.6 Evaluation ...73
10.2.7 Operational Maintenance (data, software and hardware) ...73
10.2.8 Publication, Presentation, Meetings and Marketing ...73
10.3 Commercial Potential...74
10.4 Assessment of Available Resources at the Institution ...75
10.4.1 Hardware & software...75
10.4.2 Human resources...75
11
Conclusions...76
11.1 Final SEAD Design Criteria ...76
11.2 Check List for Funding Application Preparation...76
11.3 Final Remarks ...77
12
References ...78
List of Figures
Figure 3.1. SEAD Developmental Schedule. See section 10.2 for time budget estimates. (Note that these phases do not represent employment units or personnel, but rather the estimated time required to undertake each of the developmental
phases, rounded to the nearest month, and excluding vacation time). ... 6
Figure 4.1. General data structure observed at MAL, showing Project/Site/Sample Group/Sample hierarchy. ... 8
Figure 4.2. Screenshot from ProvBase, showing the main Area/Site browsing interface and the Unit (c.f. sample group) browser popup. ... 19
Figure 4.3. Screenshot of the MALdb prototype project management database system, showing the Control Panel used to access different interface areas (top) and the ‘Browse by Project’ form (bottom). Note that the somewhat unconventional backgrounds are suggestions only! ... 20
Figure 5.1. Suggested Client-Server-Web structure of the SEAD database system, including developer interaction. The latter will be minimal during the use and maintenance phase... 22
Figure 5.2. Schematic of SEAD data areas, showing the direction of one-to-many relationships as defined by the data hierarchy. (Component lists are non-exhaustive, refer to Section 5.1.5, Appendix I and the prototype files stored at MAL for more details) ... 23
Figure 5.3. Explanation of database structure diagrams. ... 26
Figure 5.4. Structure of Project data area ... 27
Figure 5.5. Structure of Site data area ... 27
Figure 5.6. Structure of Sample Group data area ... 28
Figure 5.7. Structure of Sample data area ... 29
Figure 5.8. Structure of Common data area for samples ... 30
Figure 5.9. Structure of biological proxy master data area ... 30
Figure 5.10. Structure of Bibliographic and Users data area ... 30
Figure 5.11. Structure of Lab & Common data area (continues in Figure 3.1)... 31
Figure 5.12. Structure of Lab & Common data area (continued from Figure 5.11, continues in Figure 5.13) ... 32
Figure 5.13. Structure of Lab & Common data area (continued from Figure 5.13, continues in Figure 5.14) ... 32
Figure 5.14. Structure of Lab & Common data area (continued from Figure 5.13) ... 33
Figure 5.15. Process model for sample handling in SEAD. ... 38
Figure 5.16. Process model for Project and Site selection/setup. ... 39
Figure 5.17. Process model for Sample setup showing Sample Group creation and optional export of recording sheets. ... 40
Figure 5.18. Schematic showing input process for measured chemical/physical property data and quantified biological proxy into SEAD. ... 41
Figure 5.19. Process model for input of biological proxy data. ... 42
Figure 5.20. Process model for soil chemistry/property sample processing. Units represent complete task groups. Calculated items may be stored to improve efficiency. P = Phosphates; MS = Magnetic Susceptibility; Ptot = Total Phosphate. (Continued on Figure 24). ... 43
Figure 5.21. Process model for import of analysis machine created files and recording sheets for soil chemistry/property data. (Continued from Figure 5.24). ... 44
Figure 5.22. Generalised model of SEAD data retrieval (web and local client interfaces are not differentiated here)... 46
Figure 5.23. Sketch of SEAD web interface, showing control panel for switching between subforms, and the ‘Simple’ subform. Note that this is a suggestion only, and will be developed in line with user requirements. ... 47
Figure 5.24. Sketch of SEAD web interface, showing GIS interface subform. Note that the preview map image is taken from the MAL Flash Project Browser online at http://www.umu.se/envarchlab/mal/projects/images/projectmap2.html 48 Figure 5.25. Schematic of selected reporting and exporting features of SEAD, including output for external GIS analysis. ... 50
Figure 5.26. Process model for dataset outputs, schematically showing data selection and use of templates... 51
List of Tables
Table 3.1. Proposed SEAD Developmental Cycle ... 3
Table 4.1. Assessment scales for digitalisation of existing data (5 is highest on all scales, uncertainty is marked with a question mark) ... 7
Table 5.1. Outline of SEAD Data areas schematised in Figure 5.2 (and Appendix I). ‘Level’ shows the hierarchic position of the data ‘Area’, where 1 is the highest level. See Section 5.1.5 for structural details. ... 24
Table 5.2. Table structure and data examples for enabling bilingual interface and searching. The example shows the structure of the table tblAnalysisMethods, which holds details of the scientific methods used in environmental archaeology analyses... 25
Table 5.3. Initial user groups for SEAD access... 31
Table 5.4. Predicted common export formats for data from SEAD. ... 52
Table 10.1. Summary of proposed developer software ... 68
Table 10.2. Estimated cost of developer software (based on academic prices from summer 2006)... 69
Table 10.3. Estimated hardware costs (summer 2006)... 70
Table 10.4. Summary of time required and projected cost for SEAD development. * Developmental phases as shown in Figure 3.1, and described below. ¤ Annual software costs dependent on ESRI licensing situation ... 71
List of abbreviations
GIS – Geographical Information Systems
(G)UI – (Graphical) User Interface
MAL – Environmental Archaeology Lab., Umeå University (Miljöarkologiska Laboratoriet)
MS – Microsoft
SEAD – Strategic Environmental Archaeology Database
SQL – Structured Query Language
All trademarks and brand names are copyright of their respective owners.
Database terminology
Database A collection of related data items, and the information describing them, in this case computer stored.
Table A subset of the database, containing records and fields (columns) of more closely related data.
Record An individual row of related data in a table.
Field A column in a table, where each record/field cell contains the value of the field for that record.
Index Generally a sorted field in a table, allowing records to be arranged according to some defined sort order such as ascending/descending.
Query The database term for a request for data that matches specified criteria. SQL is a language for constructing these requests.
Flow chart symbols
Terminator – start/end of process.
Preparation – steps necessary before undertaking the subsequent tasks.
Process – process or activity.
Predefined process – a process that has actions defined by either a method description, or programmatically by a subroutine/function.
Question/choice – process flow will diverge depending on user choice or data properties (e.g. Yes/No, x>y).
Display – information output to screen or general screen operations.
Store – save or load data to/from database.
Report/external data – hand written data/information, files produced by external software, or files produced by SEAD for external use.
Connector – shows link between multiple diagram parts or figures.
Flow charts were produced with Diagram Designer v.1.15 (© 2006 Michael Vinter) and finished in CorelDraw X3 (© 2005 Corel Corporation).
Database structure diagrams were created in Microsoft Visual Studio 2005 (© 2005 Microsoft Corporation) and finished in CorelDraw X3.
1 Abstract
This document lays out a strategy for the development of SEAD – A Strategic Environmental Archaeology Database, which will facilitate the digitisation and accessibility augmentation of MAL’s existing data from nearly thirty years of work in the fields of archaeology and
environmental science. SEAD will also provide a framework for the entry of data from all future research and consultancy work at MAL, and allow guest researchers and external partners to contribute to, and work with the same data. The planned system will be implemented at both local and internet levels, and be designed with an aim towards broadening its scope with external partners in the future.
SEAD will be made available online in order to increase the ease of access to environmental archaeology data and encourage an expansion of both the discipline and Sweden’s role in it. This is inline with current EU strategies on enhancing research infrastructure, and providing a greater insight into human-environment interactions for long term planning.
2 Introduction & Background
2.1 The Environmental Archaeology Lab’s Part in SEAD
The Environmental Archaeology Lab in Umeå (MAL) has worked in the fields of archaeology and environmental science for nearly thirty years, over which time an enormous amount of raw data on the long term interactions of people and their environments has been amassed. These data consist mainly of proxy variables – that is to say measurements of the changes in physical or chemical properties of sediments, and quantities of macro fossils found on or around sites of archaeological and Quaternary scientific interest. The vast majority of this data is not in digital form, and only available by extraction from published reports: another large portion is stored digitally but in a variety of formats. On their own these individual measures and variables can provide important interpretive information for the reconstruction of
prehistoric human activity and environmental change. The combination of several proxies (multi-proxy analyses) greatly increases their analytical power – the relative advantages of each variable complement each other in terms of their ability to reflect environmental changes. Multi-proxy analyses are difficult to undertake without a framework which allows for variable sequences to be overlain and analysed within a common timescale.
One of the primary aims of SEAD is to make this data available in both its raw and interpreted forms. The latter will be facilitated by making all published reports available online, and linked to the relevant data and meta data.
A relational database would greatly improve the accessibility of these data, and allow for the comparison of different variables over the entire geographical and chronological scope of the dataset. Development of user-friendly interfaces for data entry, retrieval, reporting and exporting, and advanced querying will provide a powerful tool for the analysis of
environmental change and human interaction with the environment. It will allow complex research questions to be formulated and investigated with a power and efficiency not currently possible due to the disparate nature of the data.
The development of a flexible and expandable system will facilitate the relatively simple addition of further analysis methods, and their related data, as the lab’s analysis and
2.2 Need for SEAD
Environmental archaeology now stands at a critical point where the amount of accumulated data permits more complex research questions than ever before to be investigated. This data, however, is currently not in a sufficiently organised form to permit these questions to be realistically analysed. SEAD would provide a framework for this organization. In addition, it would greatly empower and simplify the investigative process for archaeologists and social scientists, especially in tasks where the interpretation of environmental data are crucial to explaining past societies and their interaction with their environments. The data are naturally of fundamental importance for research into sustainable development in that they hold a number of long term proxy records of human impact on the environment.
There is a real demand from Quaternary geologists and environmental scientists for cooperation with archaeologists in the investigation of past climate and environmental
change. In particular, there is a general understanding that questions on the nature and extent of past human impacts cannot be answered without investigations into the civilisations that instigated them. At the moment the greater part of this archaeological knowledge and data is not in a form readily accessible or useable by external research groups, even in collaborative projects. There is also a marked polarity between research areas resulting from the traditional disciplinary and faculty boundaries.
Many areas of environmental science examine only the recent past, but with methods and study objects similar to those of environmental archaeology. SEAD would bridge the gap in timescales between the disciplines, and allow for a more holistic approach to modern ecology with an emphasis on human interactions with the natural environment - past, present and future.
SEAD would go a long way towards realising this objective of multidisciplinary, longitudinal research, by both facilitating data exchange and providing a common medium for research
initiatives. It would, in addition, permit the investigation of single proxies with a greater spatial and chronological perspective than previously feasible.
2.3 Summary of Project Scope
3 Development
Strategy
3.1 Outline
This document represents the completion of Phase 1 of the SEAD developmental cycle – Planning. The full developmental cycle is outlined in Table 3.1, and described in detail in section 3.2.
Phase Title
1. Planning
2. Database Construction
3. Client Software Development
4. Implementation, Training & Parallel Running
5. Importing of Existing Data
6. MAL Activation & Fine Tuning
7. Internet Activation
8. Evaluation
9. Use & Maintenance
Table 3.1. Proposed SEAD Developmental Cycle
The phases outlined in Table 3.1 are not intended to be chronologically static or exclusive, and will overlap each other in terms of their content and schedule as deemed necessary under development, and as required by MAL staff. Implementation and training, for example, may necessitate improvements to the interfaces that require more programming; and fine tuning of the system during activation may require minor adjustments to the structure of the database. However, the chronological framework for the full developmental cycle will be effectively limited by the logical flow of database systems development, as suggested in Figure 3.1. From the third month of development departmental staff and research partners will be
3.2 Proposed Developmental Cycle
1. Planning
Analysis of existing system, and comprehensive logical design of replacement system (SEAD). This report represents the results of this phase.
2. Database Construction
Essentially the physical implementation of the logical database design, its immediately associated operational interfaces, and the tools necessary for the client software to interrogate the data.
- Construction of physical database, including a entry of a test subset of MAL’s data - Construction of basic database management interfaces (beyond those provided in the
developer tools)
- Construction of preliminary stored procedures/queries
3. Client Software Development
Custom built software for the operation of SEAD, from data input and output to maintenance, mapping and internet access.
- Construction of interfaces, query systems, report templates - Inline and online documentation
- Mapping interface (GIS)
- Development of internet interfaces
- Debugging
4. Implementation, Training & Parallel Running
Instruction of MAL staff on use of SEAD, and testing in lab routines. A full test and training strategy will be devised in cooperation with MAL staff during the first half year of the project.
- Research orientated interrogation of test datasets (simulated research) - Testing of:
- import routines (existing data) - data entry systems
- reporting, export & mapping systems - internet access
- Design of training manuals
5. Import of Existing Data
Comprehensive import of all existing MAL analogue and digital data, including translation of meta data when appropriate.
- Identification meta data for compatibility with other archives - digitization of MAL reports
- Translation of Swedish material
6. Documentation, MAL Activation & Fine Tuning
Full implementation of SEAD as data management system for MAL, and devolution of existing system.
- Minor adjustments to database structure if necessary - Production of user guide and advanced manuals
- Application to teaching
7. Internet Activation
Full implementation of the SEAD web interface, with online access to published data within database. (The domain sead.se has already been acquired for this goal).
8. Evaluation
Comprehensive evaluation (with report) on the successes and inadequacies of the SEAD project’s developmental phases.
- Usability & functionality (data input & output) - Input, transaction & database validation - Fulfilment of initial and later requirements
9. Use & Maintenance
Year 1 2 3
Month from Project Start 1 2 3 4 5 6 7 8 9 10 11 12 1 2 3 4 5 6 7 8 9 10 11 12 ... 1 Planning (completed June 2006)
2 Database Construction
3 Program Development (Combined) ── ── ── ── ── ── ── ── ── ── ── ── ── ── ── ── ── ── ── ──
Local Client
GIS (Local & Web) Internet Interface
4 Implementation, Training & Parallel Running 5 Import of Existing Data
6 Documentation, MAL Activation, Fine Tuning
7 Web Activation ►
8 Evaluation
9 Use & Maintenance ►
4 Analysis of Existing System
4.1 Data Entities
The data held by MAL is the result of over 30 years of research and consultancy, undertaken by a large number of employees and external partners. This is reflected in the variety of and limited consistency visible in all data types. As a result it is most convenient to classify the data elements encompassed by MAL’s current activities into three zones of acquisition/creation: Field, Laboratory and Office. These zones have remained more or less constant throughout the history of the lab., and this classification reflects the modus operandi of MAL, rather than a logical division of data based on type
and purpose more typical of systems analysis.
An assessment of the current digitalisation status and the anticipated effort required to convert and import the existing data into SEAD is given for each identified data entity group. Table 4.1 provides a key to the assessment scale. Uncertainty due to difficulty of assessing the material is indicated by a question mark. This may either indicate high variability in the data as described in the associated comments, or that the task showed signs of being more complex than the available data at first suggested.
Current level of digitalisation: 0-5
Volume of data: 1-5
Uniformity of data: 1-5
Complexity of task: 1-5
Table 4.1. Assessment scales for digitalisation of existing data (5 is highest on all scales, uncertainty is marked with a question mark)
Figure 4.1. General data structure observed at MAL, showing Project/Site/Sample Group/Sample hierarchy.
4.1.1 Field data (internal & external)
4.1.1.1 Summary
A variety of data is collected in the field, from information about individual soil samples, general site information to information about the landscape surrounding the investigated area. Field maps are used to record the location of sample points,
archaeological features, variation in soil properties and other data which might be of use interpreting the results of analyses. Additional information is also recorded on the field maps or on the actual sample bags.
Coordinate data (X,Y,Z) is most often produced by a 3rd party (contractor) using a total station. On some occasions these measurements are performed by MAL personnel using a total station or GPS.
of samples collected by external parties (not trained by MAL personnel) can be marked with considerable variation.
4.1.1.2 Component details
Data: Sample metadata
Comments: Highly variable and disparate. Many external projects have had
questionable sample labelling policies, and ineffective structures. A system must be devised which is both efficient and can cater for these
problem samples. The effectiveness of the SEAD must not however, be sacrificed in order to cater for badly designed legacy data.
Much of this data could be in paper form in structured files, but some is entered into MS Excel files during logging and processing.
Status: Current level of digitalisation: 2? Volume of data: 5
Uniformity of data: 1? Complexity of task: 5
4.1.2 Laboratory data
4.1.2.1 Summary
The majority of laboratory data is subject to routines which ensure the creation of appropriate metadata and data elements. There are, however inconsistencies in the storage location and quality of this data, particularly where plant macrofossil analyses are concerned.
An ‘Incoming folder’ holds a master list of the information necessary for identifying sample batches. All samples handled in the laboratory at MAL are given a unique identification number, referred to as its “MALnummer”, constructed by the
concatenation of a sample batch number followed by a sample number. This minimizes the possibility of mixing up samples from different investigations. These unique
identifiers follow the samples through every step of the process, from pre-processing to reporting and are used for all types of samples processed in the laboratory.
4.1.2.2 Component details
Data related to arrival of samples in lab
Data: Sample batch information: type, size, date received, external contact and project information. (Incoming folder)
Comments: System was implemented in 1999 and is used as a temporary store for project meta data. This is digitised for 1999-2003.
Can be used as central node for project information (if used consistently), and may be useful when creating project structure in SEAD.
Status: Current level of digitalisation: 2 Volume of data: 2
Proxy data
Data: Soil chemistry/physical properties
Comments: pre 1996 data – probably must be manually typed into new template post 1996 data - each MS Excel sheet must be opened, checked, and
converted to new template
This is a considerable job due to the massive volume of data
once converted to standard MS Excel format these will be importable into SEAD relatively easily.
Status: Current level of digitalisation: 4 Volume of data: 5
Uniformity of data: 4 Complexity of task: 3
Data: Plant macros
Comments: Degree of digitalisation largely unknown, probably much relatively recent data that must be extracted from tables in Word, earlier data must be scanned of hand typed.
Creation of a central species list creation system, with templates for raw data would significantly enhance the speed and accuracy of this work. Systematisation of qualitative descriptors (few, many etc.) is also needed
to an extent
Status: Current level of digitalisation: 2? Volume of data: 4
Uniformity of data: unknown Complexity of task: 5
Data: Pollen
Comments: All data must exist digitally either on server or staff machines.
Raw data from the pollen analysis program Tilia can easily be exported to dbf, which can be imported to other database systems or analysis software such as C2.
Questions exist as to whether the species dictionary information is easily extractable and whether it could be used as a lookup/central index for plant/pollen species.
Older pollen diagrams may have to be scanned and their data reverse engineered if considered of great importance (a very time consuming task).
Status: Current level of digitalisation: 5? Volume of data: 4?
Data: C14 (Radiocarbon dates)
Comments: There is a central list of all dates submitted by MAL since 1999, which is digitised up to 2002. Details and metadata (sample type etc.) for dates are however, not digitised.
Although how samples are referenced in the analogue records varies to some extent, it is always possible to relate dates to samples by their descriptions.
Missing dates may be found in printed reports, although there will inevitably be some loss of data.
Status: Current level of digitalisation: 2? Volume of data: 3?
Uniformity of data: 2? Complexity of task: 4?
Data: Insects
Comments: Fully digitised since inception in 1996.
In addition, the Bugs database contains records of the majority of fossil insect analyses undertaken in Europe (excluding chironomids).
Status: Current level of digitalisation: 5 Volume of data: 1
Uniformity of data: 5 Complexity of task: 1
Data: Mollusca
Comments: Raw data primarily analogue, in Word files where it exists digitally. Similar situation to plant macrofossils.
tatus: Current level of digitalisation: 2? Volume of data: 1?
Uniformity of data: 3? Complexity of task: 5?
Data: Wood
Comments: Raw data primarily analogue, in Word files where it exists digitally. Similar situation to plant macrofossils.
Status: Current level of digitalisation: 1? Volume of data: 1?
Uniformity of data: 1? Complexity of task: 5?
Data: Other
Comments: Minimal osteological analyses are undertaken at MAL, and only a limited amount of data stored outside of reports.
Analysis methods
All methods are systematically described and stored on the central server as MS Word files. The is part of MAL’s quality assurance policy.
4.1.3 Office data
4.1.3.1 Summary
Office data creation most often occurs before and after the above data types. Much of this data may be considered metadata and helps to describe the analysis data and put it in context. It is therefore often hierarchically above field and lab data.
Feature data produced by contractors or collaboration partners contains important information on topography, geography and structures found when excavating
archaeological sites. Archaeological information such as shape, volume, construction, finds and preliminary interpretation and topographic information are very useful when working with environmental archaeological samples.
Site and sample coordinate data is often provided by collaborative partners, and must sometimes be converted from their local investigation grid to Swedish national grid or latitude/longitude.
4.1.3.2 Component details Pre-project stage
Data: Preliminary: project description, preliminary contract specifications Background material
Negotiation notes, phone call logs Cost estimation
Management Decisions
Status: Currently ad hoc - template and routines exist but are not in use
Contractors & external contacts
Data: Lists of contractors and previous collaboration partners
Status: No central list exists, information is mainly held by those individuals responsible for the related projects
Project/Site info
Data: Project/subproject/site hierarchy
Project descriptions and definitions (e.g. research & contract) Project completion stages
Status: Structure of major projects usually reflected in file structure on server and individual computers
No central storage of project descriptions, info held (if at all) on PC of individual responsible for project
There is no current system for uniquely identifying Projects or Sites.
Scientific publications & MAL reports
Comments: The majority of MAL reports are stored centrally on the server, although not always as single documents. There is a central digital list of all reports after 1996. Reports from before this date will be more difficult to track down.
Scientific articles are not centralized and are located on the computers of individual researchers
Centralising these as Adobe pdf files on the server is recommended, so that they can found and distributed more easily.
Status: Current level of digitalisation: 3 Volume of data: 2
Uniformity of data: 4 Complexity of task: 2
Report templates
A standard MAL report template exists, but its use is adapted to individual preferences. There are only templates for the presentation and publication of insect and pollen proxy data. There is a reasonable amount of systematization in the reporting of soil chemistry data which could be used to produce templates. No templates exist for the other proxies.
4.2 Process (Data Flow) Models
Process models describe the movement of data through the operational structure of the lab., from creation/acquisition through analysis to reporting.
The routines used to handle the enormous amounts of data produced at MAL are a result of many years of method development and laboratory research. In the early years of MAL the vast majority of data were analogue (in creation and storage), but the use of PC:s in daily activities has gradually become indispensable. Software, including MS Office and specialised utilities for controlling analytical instruments assists the creation, storage and manipulation of data. All analytical methods are thoroughly documented and stored on a server to ensure the high standard of quality required by scientific research.
As a result most aspects of the lab’s routines are well organised, even if the
implementation of routines may vary. The following sections describe the current state of each process, paying special attention to the degree of computerisation. Relevant suggestions for improvement are given where deemed appropriate, and incorporated into the design Section 5 later. Section 5 also includes flow diagrams describing the optimised versions of the routines examined here in a form suggested for
implementation through SEAD. The descriptions below are a summary of an ongoing and comprehensive analysis of MAL’s operations.
4.2.1 Data acquisition/creation
4.2.1.1 Summary
Two groups of data acquisition/creation can be identified: manual created and digital acquired.
Manually created data
documents. Less common proxies such as wood type and molluscs are processed in the same way. Insect data are recorded on pre-printed recording sheets during analyses and subsequently entered into the Bugs2000(9) database for storage and interpretation.
Digitally acquired data
Magnetic susceptibility (measured with a Bartington MS-2 meter) and Loss on ignition (using a analytical laboratory scale connected to a PC) analyses create data directly in template based MS Excel sheets. Phosphate content is measured using an Ultrospec 2000 UV/Visible Spectrophotometer which, through specialised software (Swift II) produces results files in a format that is easily converted to MS Excel format.
4.2.1.2 Component details
Data related to arrival of samples in lab (see Figure 5.15, Figure 5.16 & Figure 5.17)
Data: Sample batch information: type, size, date received, contact information.
Process Status:
Logged in ‘Incoming folder’ (inkommande pärm) per batch, individual
samples are not logged until processed.
Sample batches are assigned a unique identifier which is the first part of the MALnummer (see above). There is some inconsistency in the use of the MALnummer in that they are often used as Project numbers. Whilst this works for small projects with only one batch of samples, it is not workable for multi-batch projects and is liable to cause significant confusion. Almost all samples are recorded in this way, although a few single sample
projects may slip through the system and be only recorded on the computer of the individual responsible for the analyses.
Proxy data (see Figure 5.20, Figure 5.21 & Figure 5.19)
Data: Soil chemistry
Process
Status: Automated data acquisition to MS Excel file from Spectrophotometer (Phosphates) & Bartington (Magnetic Susceptibility). Standard/calibration values for P are recorded digitally.
Manual input of LOI, Ph, sample weight data into MS Excel sheets
Currently no recording of useful qualitative (Grinding method, Calc. lumps, iron concretions, charcoal, artefacts, etc) & semi-quantitative properties (grain-size fractions). There is a need for a flexible logging system during sample processing.
Currently no facility to log changes/corrections to data (for back-tracking and quality assurance).
Data: Plant macros
Process Status:
Currently no standard computerised logging of data, individual researchers work in their own routine. Quality of data is ensured by professional expertise, but there is little coordination of metadata to enable raw data, results and project status to be found by other staff.
Null results (samples without any macrofossils) are often not recorded. Suggest the use of standard forms, generated by SEAD for recording. Database input of species lists would ensure conformity of styles and
Data: Pollen
Process Status:
Majority of analyses performed off-site. Samples sent for analyses come back as results in Tilia Graph format, but Excel compatible raw data files are available.
Test analyses are most often returned in paper form, or as emails.
Storage of raw pollen data in SEAD would be of great research importance, but not necessarily improve the data creation phase
Data: C14 (Radiocarbon dates)
Process Status:
Metadata on samples sent for dating are recorded on standard paper forms, the index to which has been digitised to an extent.
Results are returned in either paper or email form, and stored in physical folders.
There is no systematic routine for the digital storage of the data.
Data: Insects
Process Status:
All raw data are by routine digitally stored in the Bugs2000 database.
Data: Less common proxies (wood, molluscs, osteology)
Process Status:
No routines are implemented for the digital storage of the data. Routines are similar to those described for plant macrofossils above. Osteological raw data is handled by external partners.
4.2.2 Data manipulation
Data are manually moved between data acquisition and analysis and report writing machines. Automated routines for backup exist, but are only sporadically implemented due to lack of resources.
Calculations, statistics and graphing are chiefly undertaken in MS Excel and to some extent in other software including Golden Software’s Grapher and Statview Software’s Statview.
Spatial data is analysed in Golden software’s Surfer or ESRI’s ArcView, with which soil
chemical and topographic maps are produced. GIS problems are solved in ArcView.
Data handling is standardized to some extent. Forms exist for all the current methods but they are not always used and they can be changed when there is a need for it. This has resulted in a system where data may exist in a variety of forms, and there is limited conformity between data areas.
All soil chemical data post 1996 exists digitally in MS Excel format. The layout and form of the underlying template document has, however, changed over the years. In particular, columns have been added, moved, renamed or deleted as required, and the placement of metadata within the files varies. This is not an ideal situation for database import, and requires that every Excel sheet be examined before import.
Field maps are digitized using Golden software’s Surfer or ESRI’s ArcView. Sample
4.2.3 Data storage
4.2.3.1 Manually created data
Data is usually stored on the computer on which the researcher is working, in most cases located in the office of the individual member of staff. Guest researchers and students are often allowed to store data centrally on the lab’s server, but data can often remain locally stored.
4.2.3.2 Digitally acquired data
Data are initially stored locally on the PC that the particular analytical machine is connected to. When the analytical procedures for a sequence of samples are completed data are compiled into a single MS Excel file and moved to a specific computer (or the central server). This file is named following a naming convention based on the project number (MALnummer) mentioned in section 4.1.2. The file is later distributed to the person(s) who will write the report.
4.2.3.3 Common data & backups
Photos from sites showing terrain, vegetation, soil profiles, stratigraphy and features (both geological and archaeological) are stored on a PC dedicated to image processing. A centralized backup system secures the data. The current system is DAT tape based and is suitable for small scale laboratory analyses. It is not suitable for large scale photo documentation and field map digitalization. Backup of the latter kind of data are
managed by moving data regularly to other hard drives. The existing backup routine is not currently enforced by the MAL staff, and there appears to be a serious deficiency in this aspect of data security.
4.3 User & Data Requirements
The necessity of a database system has become more and more evident during the past years. MAL has produced about 150 000 (non-normalized) data records and these are stored in about 2000 Excel documents and a number of word documents. A database would greatly help solve problems of data integrity and process uniformity, and accelerate data retrieval, analysis and interpretation.
What follows is summary of requests, ideas and constraints on the form of SEAD as dictated by both the perceived needs and requests of the prospective users and the data themselves. The former were obtained by a combination of personal experience,
questionnaires, meetings and interviews with the clients. The authors have also included projected user and data requirements as predicted from the users that were not
encompassed by the latter, and the assessed potential user base of SEAD.
The immediate potential user base for SEAD can be described as poorly computer literate, and although there is a general understanding of the benefits of database storage there is limited understanding of the potentials of such as a research and teaching tool. The authors stress that effective implementation of Phase 4: ‘Implementation, Training & Parallel Running’ (see section 3.1) along with close cooperation between MAL staff and the developers is essential in order to rectify this problem. There is however, a
thorough understanding of the benefits of making the data held at MAL easily available to the wider research community.
Comments considered of particular importance are summarised below, with developer’s remarks where the user’s comments differed significantly from the developer’s
4.3.1 Data/database scope
“SEAD should encompass the entire scope of the lab’s analyses.” “Descriptive sample data must be included (size, volume etc.).” “Links to electronically stored reports would be useful.”
“Ecological and descriptive data for plant species is not necessary due to the ease of
access to the literature in the lab and the expertise of MAL staff.”
Developer’s comment: Whilst this may be valid for researchers with a high level of expertise, this data would potentially be of great importance for students and researchers with less knowledge of plant ecology and ethnobotany. The data would also increase the advanced research power of the database by making it possible to query by combinations of vegetation groups, environment and ethnographic
information. This principle has been developed in the Bugs Coleopteran Ecology Package1.
“Descriptions of archaeological artefacts are outside the scope of SEAD.” “Detailed description of sites and sampling localities is not necessary.”
4.3.2 Data entry
“MAL should act as a clearing house for all SEAD data entry. This would ensure that data quality rules are uniformly enforced, and simplify administration. Online interfaces could be developed to enable off-site data submission.”
“Routines should be put in place to automate the movement of data from analysis machines to the central database.”
“It must be easy to create and edit sites, and project structures should be transparent and understandable. Simple project management facilities would be useful”
“A flexible import interface should be designed to help import the variety of existing soil chemistry/property data. For example, a guided wizard type system.”
“Plant macrofossil data should be input directly into SEAD from paper recording sheets. A spreadsheet like interface with samples as columns and species as rows is essential, and species should preferably be selected from a master list to avoid mistakes.” “It must be possible to import pollen data from files exported by the pollen software
Tilia (Eric Grimm), and possibly C2 (Steve Juggins).”
“Insect data could be entered into Bugs, and then imported into SEAD.”
“Uncommon proxies (wood, molluscs) should be input directly into SEAD at a later date.”
4.3.3 General interface design “Must be easy to use.”
“Should be flexible/customisable to an extent so that users with different levels of computer literacy can comfortably use the system.”
“Users should be able to save settings so that their preferred (or most commonly used) interface parts are always readily available on their client machine.”
4.3.4 Data retrieval
- Where and when is a specified species known from?
- What is the preservation status of material from a specified place? - What is the dating evidence for Site X?”
“Summary data must be readily accessible – e.g. calculated information such as the number of samples from a specified location. It would be advantageous to be able to obtain multi-site summary data in a form that can easily be graphed.”
“The investigation of complex research questions should not require advanced computer/database skills.”
4.4 Previous Database Related Work at MAL
The following projects and tasks have been under either partly or entirely by MAL, and can contribute to the development of SEAD.
4.4.1 Bugs Coleopteran Ecology Package
Database and analysis software for entomology and palaeoentomology.
Latest version developed by Phil Buckland as part of his PhD project at MAL and in cooperation with partners in the UK, see http://www.bugs2000.org/ and Section 7.5 for details. PhD project funded by The Bank of Sweden Tercentenary Foundation within the Northern Crossroads project, along with external research partners in the UK (Paul Buckland, University of Bournemouth).
4.4.2 Plant macrofossil database preparation
Initial steps towards the construction of a database for MAL’s palaeobotanical work have been taken, including: rough database design; identification of essential needs and data components; cursory identification of existing similar systems and taxonomic codes.
Work undertaken by Tina Nilsson, supervised by Phil Buckland, and with earlier involvement of Roger Engelmark and Karin Viklund.
4.4.3 ProvBase
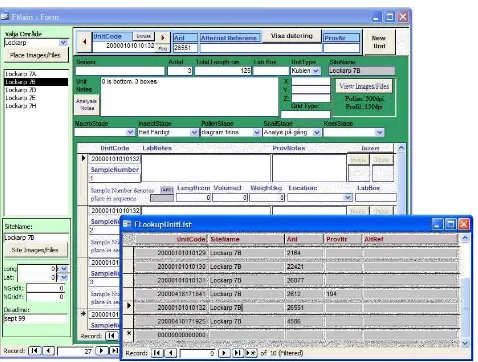
ProvBase was created to store status information for consultancy projects (Figure 4.2). The system is fully functional at the Project/Site/Sample level, but contains only a small data set as limited resources prevented its full implementation. It has the ability to store sample metadata, record the status of analyses and store links to raw data files along with project contact details. It currently contains no facility for the internal storage of raw data or reporting/exporting facilities. ProvBase was designed primarily to retrieve sample and status metadata for existing projects.
Figure 4.2. Screenshot from ProvBase, showing the main Area/Site browsing interface and the Unit (c.f. sample group) browser popup.
4.4.4 MALdb/MALBase
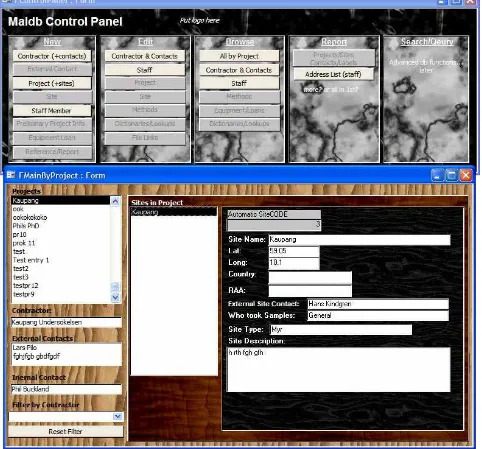
A prototype project and site management system was created, building on the work undertaken for ProvBase (above 4.4.3), and designed to form the basis for the project management aspect of a system such as SEAD. The ‘Browse by Project’ form shown in Figure 4.3 shows a list of projects and summary data on the left. Selecting a project shows a list of sites within that project, from which details of each site can be reached by clicking them. The natural browsing progression in SEAD would then be to access sample group and proxy data for the site by the click of a button.
Figure 4.3. Screenshot of the MALdb prototype project management database system, showing the Control Panel used to access different interface areas (top) and the ‘Browse by Project’ form (bottom). Note that the somewhat unconventional backgrounds are suggestions only!
4.4.5 Report archive
The in-house digital archiving of all MAL reports has been initiated, but resources are limited for its continuation. These reports will be made publicly available through the lab’s website. See 4.1.3.2. – Scientific publications & MAL reports.
4.4.6 Image database
The data consists of a large number of photographs relating to projects (sites,
excavations, soil profiles), general reference (landscape types, settlements & structures, landuse) and reference collections (insects, seeds). The systematic photographing of the insect reference collection has been assessed and a pilot study undertaken by Tina Nilsson and Phil Buckland.
The imaging and image database resources are a considerable and valuable investment that should be more fully exploited.
4.5 Potential Users
Several discrete but related initial user groups have been identified for SEAD:
4.5.1 MAL staff
Employees of MAL will be responsible for the bulk of data entry, both during the development of the project and during the operational phase. Researchers at MAL will conduct research, and be involved in teaching using SEAD.
4.5.2 Students on location at MAL
SEAD will be integrated into environmental archaeology taught courses at the basic and advanced levels. Postgraduate students will also be encouraged to use the facilities for both storage of their own data and as a research tool.
4.5.3 Guest researchers on location at MAL
Guest researchers will be encouraged and invited to conduct SEAD based research.
4.5.4 Local interdisciplinary cooperation
SEAD has great potential for use in disciplines from environmental science to cultural history. Multidisciplinary projects will be encouraged primarily, but usage by users from single disciplines will also be most welcome. Researchers from Quaternary sciences have repeatedly expressed an interest in a database of environmental
archaeology, and in collaborative research with archaeologists, especially in the areas of environmental change and human impact.
4.5.5 Remote researchers and students
5 Database Design (Logical)
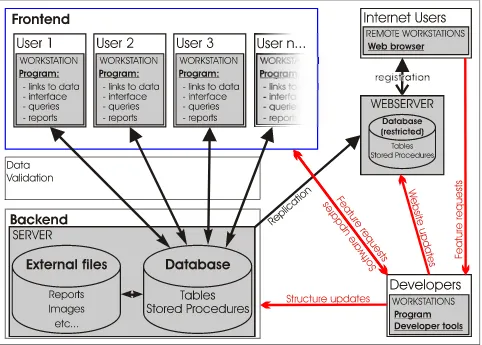
[image:34.595.59.541.212.557.2]The proposed structure of SEAD consists of a Microsoft SQL-Server relational database located on a central server PC. Lab users will interact with this backend (see Figure 5.1) through locally installed client software custom built in Microsoft Access, Visual Studio Tools for Office and VBA (or alternative as deemed appropriate at time of construction). Internet users will query and retrieve data through a combination of HTML, Flash and ASP.NET based web pages served from a replicated copy of the backend (see restrictions 5.4.3) hosted by a third party service provider (Figure 5.1).
Figure 5.1. Suggested Client-Server-Web structure of the SEAD database system, including developer interaction. The latter will be minimal during the use and maintenance phase.
5.1 Data Structure & Relationships
5.1.1 Introduction
used to retrieve any combination of linked (related) data items. The process of
reorganising data structures into relational database form is known as normalisation (2).
Environmental archaeology data is by its nature multi-proxy - it consists of several measurable quantities that can give a greater insight into climate and environmental change and human impact together than they can independently. It is also
chronologically and spatial extant, and thus forms a multi-dimensional data domain which must be normalised into an efficient data structure if it is to be accessed efficiently. Although the domain is complex, it is logically structured, and thus lends itself relatively easily to normalisation.
MAL’s existing data was examined (Section 4.1) and structured according to principles of data normalisation. A small amount of redundancy (denormalisation) is suggested in some peripheral tables in order to improve data retrieval efficiency.
5.1.2 Data area definitions
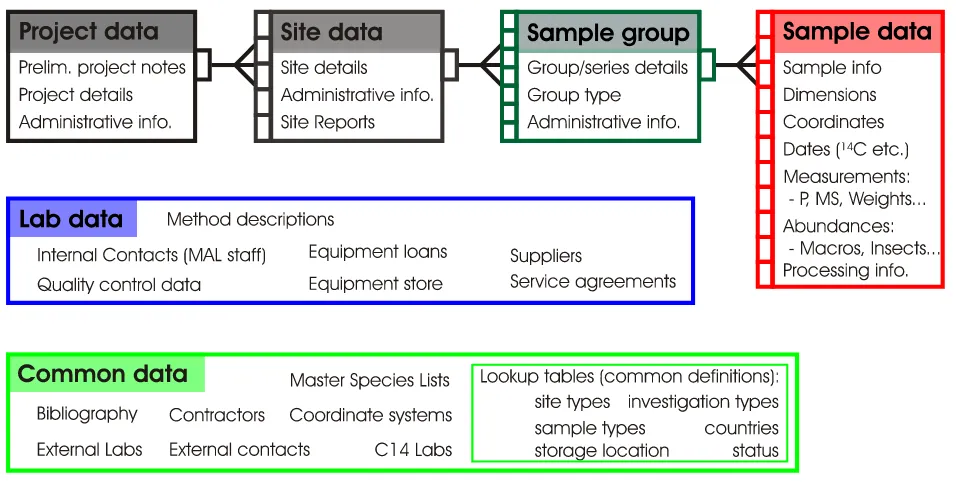
The proposed structure consists of over 120 related tables, broken down here into manageable data areas. Each area is centred on a nodal table, and reflects the hierarchy of data within MAL projects. The data areas are shown schematically in Figure 3.1 and outlined in Table 5.1.
Note that although SEAD is not designed as a project/laboratory administration system it incorporates all the features of the existing MAL project administration database (MALdb, see 4.4.4). This enforces a data hierarchy which facilitates both efficient data retrieval and administration in keeping with relational database design, and meshes with existing lab practice.
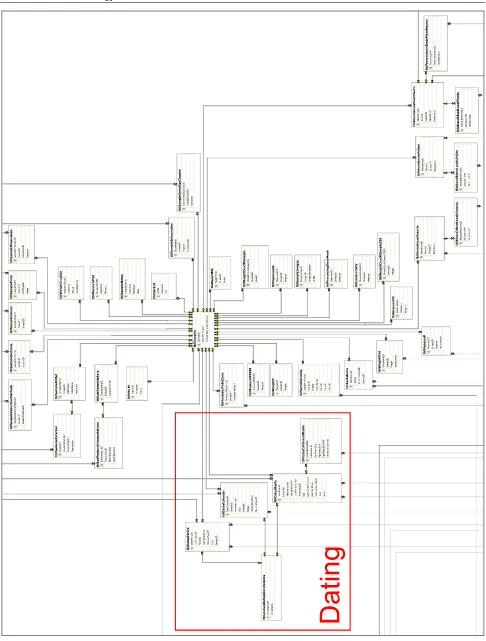
[image:35.595.60.538.468.710.2]A somewhat compressed image of the full structural diagram is included in Appendix I for orientation, and readers should refer to Section 5.1.5 and the prototype files stored at MAL for full details.
Level Area Definition – data centred around...
1 Projects The highest level of administrative organisation, and the first to be
defined on project initiation.
2 Sites Sublevel of Project, may be >1 Site per Project.
Data centred on an investigation location, a spatially defined investigative area within a project.
3 Sample Groups Sublevel of Site, may be >1 Sample Group per Site.
Data centred on a group of samples from a site with a common relationship and purpose, for example: a collection of samples from a house foundation taken for plant macrofossil analyses; a collection of spatial samples for soil chemical prospection.
Includes (meta)data specific to a cohesive group of samples. (Note that feature/context descriptions and interpretations may not necessarily apply to these same sample group units. It is a feature of variable archaeological excavation systems that sample groups may intersect several features/contexts.)
4 Samples Elements of a Sample Group.
Samples belong to only one Sample Group, and a Sample Group is described exhaustively by the samples that comprise it.
An individual sediment unit which is treated with analyses, and the raw and meta data associated with it.
This is the bulk of SEAD’s data elements.
- Lab Data Data specific to the Environmental Archaeology Lab.
- Common Data Data not specific to the lab, but utilised in various parts of the
database.
Table 5.1. Outline of SEAD Data areas schematised in Figure 5.2 (and Appendix I). ‘Level’ shows the hierarchic position of the data ‘Area’, where 1 is the highest level. See Section 5.1.5 for structural details.
5.1.3 Bilingual interface and searching
The SEAD local client program will be implemented with a bilingual Swedish and English interface. This will allow for a wider spectrum of users, from Swedish
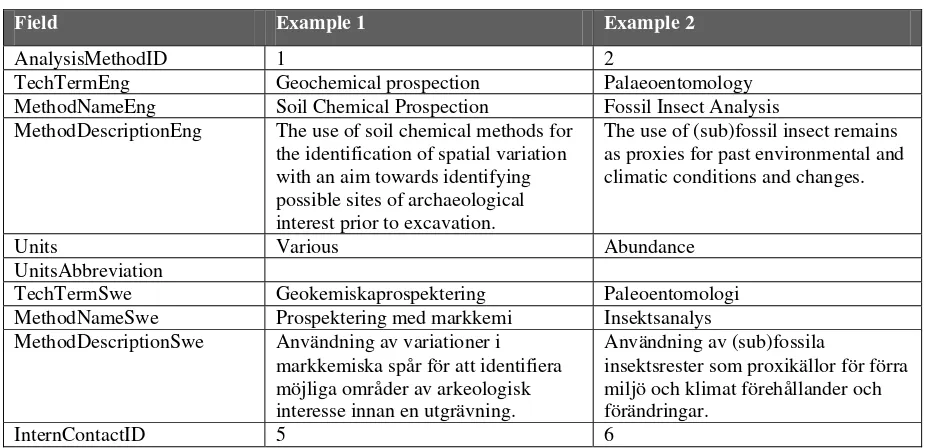
undergraduate students and local researchers to international guest researchers. As the majority of raw data is numerical values/abundances, the main concern is with user interfaces, search terms and metadata. This will be solved by the language duplication of relevant names and descriptions, as shown in the examples in Table 5.2, and the creation of parallel English and Swedish forms within the frontend. Users will be able to choose the interface language on start-up, and switch from within the program.
In addition, the facility to store common names of plants and animals (in the biological proxy master tables – see Figure 5.9) in any number of languages will greatly ease international work, and interaction with the general public .
Field Example 1 Example 2
AnalysisMethodID 1 2
TechTermEng Geochemical prospection Palaeoentomology
MethodNameEng Soil Chemical Prospection Fossil Insect Analysis MethodDescriptionEng The use of soil chemical methods for
the identification of spatial variation with an aim towards identifying possible sites of archaeological interest prior to excavation.
The use of (sub)fossil insect remains as proxies for past environmental and climatic conditions and changes.
Units Various Abundance
UnitsAbbreviation
TechTermSwe Geokemiskaprospektering Paleoentomologi
MethodNameSwe Prospektering med markkemi Insektsanalys MethodDescriptionSwe Användning av variationer i
markkemiska spår för att identifiera möjliga områder av arkeologisk interesse innan en utgrävning.
Användning av (sub)fossila
insektsrester som proxikällor för förra miljö och klimat förehållander och förändringar.
[image:37.595.83.546.52.276.2]InternContactID 5 6
Table 5.2. Table structure and data examples for enabling bilingual interface and searching. The example shows the structure of the table tblAnalysisMethods, which holds details of the scientific methods used in environmental archaeology analyses.
5.1.4 Data security
As SEAD will inevitably contain unpublished data from ongoing contracts and research, a security system must be put in place to prevent unauthorised access to this data. The proposed structure allows data to be assigned access levels at the Sites level by users with administrative or developer access rights. The facility of SQL Server to enforce security levels for virtually any object (table, form, query etc.) will enable this policy, and others, to be rigorously enforced.
5.1.5 Data structure
Tables and relationships for the MAL project database (see Sections 4.4.3 & 6) were prototyped using MS Access 2000. This structure was then further normalised and expanded into the full SEAD database using MS Visual Studio’s SQL-Server database project interface. The resulting design has over 120 interrelated tables fulfilling the large part of SEAD’s anticipated data requirements, and representing all areas of the lab’s activities (see Appendix I). The large number of tables and complex linked structure is a feature of a highly normalised relational database, which improves data storage and retrieval efficiency.
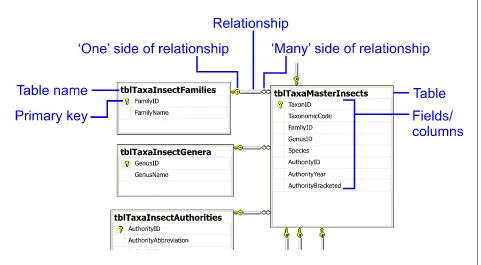
The data areas defined in section 4 and outlined above are shown in more detail in this section. Refer to Figure 5.3 for an explanation of the database structure diagrams, and Appendix I to see how the areas are related.
Database tables are linked by one to many relationships where the data held in the
primary key field is unique for every record in that table (the ‘one’ side of the
relationship). The field with the same name on the ‘many’ side of the relationship may contain several records where this value is identical, and is referred to as the foreign key. For the example shown in Figure 5.3: in tblTaxaInsectGenera the beetle Genus
Specific attributes, such as field types, sizes and restrictions will be not be presented in this document, and should be considered in the Database Construction phase (see section 3).
Figure 5.3. Explanation of database structure diagrams.
5.1.5.1 Project data
Figure 5.4. Structure of Project data area
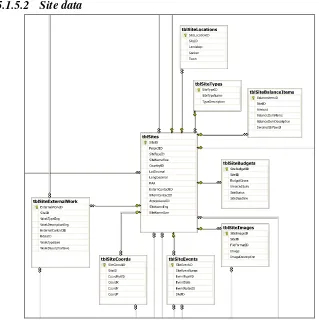
5.1.5.2 Site data
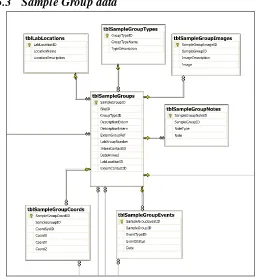
[image:39.595.89.408.378.700.2]5.1.5.3 Sample Group data
Figure 5.6. Structure of Sample Group data area
5.1.5.4 Sample data (including dating evidence)
Variations in the excavation and sampling practices of external bodies (generally archaeological contractor) is catered for by the use of both external and internal references being held in separate tables.
Figure 5.7. Structure of Sample data area
5.1.5.5 Lab & Common data
Figure 5.8. Structure of Common data area for samples
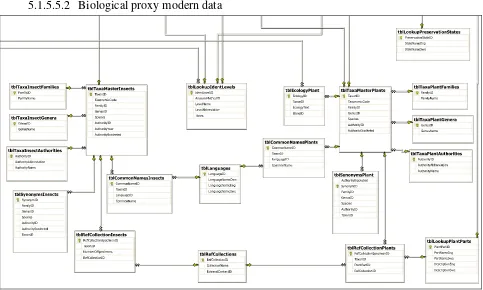
5.1.5.5.2 Biological proxy modern data
Figure 5.9. Structure of biological proxy master data area
Master tables for molluscs are omitted for clarity, but follow the form of the plant tables. Master tables include the facility for storage of taxonomic codes which will enable lists to be generated in taxonomic order. It is suggested that European taxonomy be followed (e.g. Flora Europea).
A simple modification would enable multiple taxonomic ordering systems to be implemented for increased compatibility between research groups.
5.1.5.5.3 Bibliographic data
5.1.5.5.4 Users data
The Users data is used to retain information on registered users and limit access to data from the site level. Further data security and access rights will be handled by SQL-Servers security model. The need for six initial user groups have been identified as shown in Table 5.3.
Group Description
System Administrator Developer level access, full data entry and retrieval plus system modificaion/programming.
MAL Staff Onsite Full data access, entry and retrieval.
External Onsite Restricted to only published data retrieval and specific project data entry.
MAL Staff Online Full data retrieval access to the extent permitted by the online database.
External Online Restricted to only published data retrieval.
Student Restricted access, customisable, but initially as External
Onsite.
Table 5.3. Initial user groups for SEAD access.
5.1.5.5.5 Other Lab & Common data
Figure 5.12. Structure of Lab & Common data area (continued from Figure 5.11, continues in Figure 5.13)
Figure 5.14. Structure of Lab & Common data area (continued from Figure 5.13)
5.2 Potential Queries and Analysis Routes (Processes)
Generalised SQL statements are given below for a few of the (predicted) most common data retrieval queries. Note that the syntax has been simplified in some cases for the sake of clarity.
More details of how data retrieval is facilitated through the user interface is given in Section 5.3.1. The queries given below are based on the examples given in Figure 5.22, and represent part of the evaluation (see 6.1) of the data structure outlined above. The queries given below were not tested with data, and are not saved as stored procedures within the SEAD (Visual Studio) design files. They are only intended to give an indication of how the proposed structure permits data retrieval, and to validate the structural logic of relationships.
5.2.1 Standard Queries
The majority of analysis routes will concern the retrieval of sample based data for particular projects, sites or groups of samples.
Retrieve phosphate measurements for all samples at Site ‘Lockarp7B SELECT tblMeasureP.Measure, tblSites.SiteNameSwe
FROM tblSites INNER JOIN tblSampleGroups ON tblSites.SiteID =
tblSampleGroups.SiteID INNER JOIN tblSamples ON tblSampleGroups.SampleGroupID =
tblSamples.SampleGroupID INNER JOIN tblMeasureP ON tblSamples.SampleID =
tblMeasureP.SampleID
Retrieve 14C dates for Sample Group with External Reference ‘Context147’ SELECT tblSampleGroups.ExternGroupRef, tblDatesRadio.*
FROM tblSampleGroups INNER JOIN tblSamples ON tblSampleGroups.SampleGroupID =
tblSamples.SampleGroupID INNER JOIN tblDatesRadio ON tblSamples.SampleID =
tblDatesRadio.SampleID
WHERE (tblSampleGroups.ExternGroupRef = 'Context147')
Retrieve taxonomically ordered plant macro species list, with abundance data, for Site ‘Lockarp7B’ (note that a crosstab variant of this query could be used to retrieve this data in the spreadsheet like form commonly used with biological proxy data) SELECT tblSites.SiteNameSwe, tblAbundancesPlantMacro.Abundance,
tblTaxaPlantFamilies.FamilyName,
tblTaxaPlantGenera.GenusName, tblTaxaPlantAuthorities.AuthorityName,
tblTaxaMasterPlants.TaxonomicCode FROM tblSampleGroups INNER JOIN
tblSamples ON tblSampleGroups.SampleGroupID = tblSamples.SampleGroupID INNER JOIN
tblSites ON tblSampleGroups.SiteID = tblSites.SiteID INNER JOIN
tblAbundancesPlantMacro ON tblSamples.SampleID = tblAbundancesPlantMacro.SampleID INNER JOIN
tblTaxaMasterPlants ON tblAbundancesPlantMacro.TaxonID = tblTaxaMasterPlants.TaxonID INNER JOIN tblTaxaPlantAuthorities ON
tblTaxaMasterPlants.AuthorityID =
tblTaxaPlantAuthorities.AuthorityID INNER JOIN tblTaxaPlantFamilies ON
tblTaxaMasterPlants.FamilyID =
tblTaxaPlantFamilies.FamilyID INNER JOIN tblTaxaPlantGenera ON
tblTaxaMasterPlants.GenusID = tblTaxaPlantGenera.GenusID WHERE (tblSites.SiteNameSwe = 'Lockarp7B')
ORDER BY tblTaxaMasterPlants.TaxonomicCode
Retrieve bibliographic details and PDF files for all reports published by MAL during 1999
SELECT tblBiblio.*, tblLookupPublishers.PublisherName, tblReports.ReportPDFLink
FROM tblBiblio INNER JOIN
tblLookupPublishers ON tblBiblio.PublisherID = tblLookupPublishers.PublisherID INNER JOIN
tblReports ON tblBiblio.BiblioID = tblReports.BiblioID
WHERE (tblLookupPublishers.PublisherName = 'MAL') AND (tblBiblio.Year = 1999)
Retrieve contact details for all current MAL staff sorted by surname SELECT tblInternalContacts.*,
tblLookupEmployStatus.EmployStatusName FROM tblInternalContacts INNER JOIN
tblLookupEmployStatus ON tblInternalContacts.EmployStatusID = tblLookupEmployStatus.EmployStatusID
Retrieve bibliographic details for all MAL reports which either include the word ‘soil’ in the title or have the keyword ‘soil’
SELECT tblBiblio.*, tblBiblio.Title AS RefTitle, tblBiblioKeywords.Keyword
FROM tblBiblio INNER JOIN
tblLookupPublishers ON tblBiblio.PublisherID = tblLookupPublishers.PublisherID INNER JOIN
<