KEMENTERIAN KESETATAN RM.2.11/IC.SPenelitian/2016 DIREKTORAT JENDERAL BINA PELAYANAN KESETATAN
RUMAT SAKIT UMUM PUSAT
T. ADAM MALIK
Jl. Bunga Lau No. 17 Medan Tuntungan Km.12 Kotan Pos 246 Telp. (061) 8364581-8360143-8360051 Fax. 8360255 MEDAN-20136
PERSETUJUAN SETALAT PENJELASAN
(INFORMEF CONSENT) JUDUL PENELITIAN :
Analisis Faktor Risiko terhadap Kejadian Stroke di RSUP H. Adam Malik Medan
INSTANSI/SMF PELAKSANA :
Fakultas keperawatan Universitas Sumatera Utara
Bapak/Ibu yang terhormat ,
Saya Marta Telambanua mahasiswa S1 Ilmu Keperawatan Fakultas Keperawatan Universitas Sumatera Utara yang akan melakukan penelitian dengan tujuan untuk menganalisis faktor risiko kejadian stroke RSUP H. Adam Malik Medan.
Saya sebagai peneliti untuk mencapai tujuan penelitian ini, mengharapkan partisipasi bapak/ibu/saudara sebagai responden untuk menjawab pertanyaan kuisioner yang akan penelti tanyakan. Hasil pengisian kuisioner oleh responden, peneliti akan menjamin kerahasiaan dan tidak ada orang lain yang membacanya selain peneliti sendiri. Semua data dan informasi yang didapat dari bapak/ibu/saudara akan digunakan hanya untuk kepentingan penelitian dalam mengembangkan ilmu keperawatan dan sebagai bukti penelitian yang benar atau sah dalam penelitian.
Keikutsertaan sebagai responden dalm penelitian ini bersifat sukarela, jika tidak berkenan menjadi responden, bapak/ibu/saudara berhak untuk tidak ikut berperan serta tanpa sangsi apapun. Apabila bapak/ibu/saudara setuju berpartisipasi maka saya mohon kesediaannya menandatangani lembar persetujuan menjadi responden.
Demikian atas partisipasi dan kerjasamanya, saya ucapkan terimakasih.
Peneliti,
( Marta Telambanua ) Nama : Tgl.Lahir: No. RM :
KEMENTERIAN KESETATAN RM.2.11/IC.SPenelitian/2016 DIREKTORAT JENDERAL BINA PELAYANAN KESETATAN
RUMAT SAKIT UMUM PUSAT
T. ADAM MALIK
Jl. Bunga Lau No. 17 Medan Tuntungan Km.12 Kotan Pos 246 Telp. (061) 8364581-8360143-8360051 Fax. 8360255 MEDAN-20136
LEMBARAN PERSETUJUAN
Setelah membaca lembaran penjelasan di atas dan sudah dimengerti, kami
Nama : H. Adam Malik Medan.
Menyatakan tidak keberatan maupun melakukan tuntutan di kemudian hari.
Demikian pernyataan ini saya perbuat dalam keadaan sehat, penuh kesadaran dan tanpa paksaan dari pihak manapun.
Medan, 2016
Lampiran 3
KUISIONER
No. Responden :
Tgl. Pengumpulan Data :
1. Usia :
2. Jenis kelamin Perempuan Laki – laki
3. Riwayat Penyakit Keluarga Hipertensi
Diabetes Melitus Jantung
Stroke
4. Riwayat Hipertensi Ya
Tidak
5. Riwayat Hiperkolesterolemia Ya
Tidak
6. Riwayat Penyakit Jantung Ya
Tidak
7. Riwayat Penyakit Diabetes Melitus Ya
8. Riwayat Merokok Ya
Tidak
9. Riwayat konsumsi Alkohol Ya
Tidak
10.Riwayat aktivitas Fisik Ya
Tidak
MASTER DATA
Usia J.Kelamin
/TABLES=kejadianstroke BY usia jeniskelamin riwayatkeluargastroke riwayathipertensi riwayathiperkolester olemia riwayatpjk riwayatd
m riwayatmerokok riwayatkonsumsialkohol riwayataktivitasfisik
/FORMAT=AVALUE TABLES
/STATISTICS=CHISQ
/CELLS=COUNT
/COUNT ROUND CELL.
Crosstabs
Case Processing Summary Cases
Valid Missing Total
N Percent N Percent N Percent
kejadianstroke * usia 66 100.0% 0 .0% 66 100.0%
kejadianstroke * jeniskelamin 66 100.0% 0 .0% 66 100.0%
kejadianstroke *
riwayatkeluargastroke 66 100.0% 0 .0% 66 100.0%
kejadianstroke *
riwayathipertensi 66 100.0% 0 .0% 66 100.0%
kejadianstroke *
riwayathiperkolesterolemia 66 100.0% 0 .0% 66 100.0%
kejadianstroke * riwayatpjk 66 100.0% 0 .0% 66 100.0%
kejadianstroke * riwayatdm 66 100.0% 0 .0% 66 100.0%
kejadianstroke * riwayatmerokok 66 100.0% 0 .0% 66 100.0%
kejadianstroke *
riwayatkonsumsialkohol 66 100.0% 0 .0% 66 100.0%
kejadianstroke *
riwayataktivitasfisik 66 100.0% 0 .0% 66 100.0%
kejadianstroke * usia
Count
Usia
Dewasa awal Dewasa akhir Lansia awal Lansia akhir Manula
Kejadianstroke tidak ada 0 0 10 14
Linear-by-Linear Association .490 1 .484
N of Valid Cases 66
a. 4 cells (40,0%) have expected count less than 5. The minimum expected
count is ,50. laki-laki perempuan
Pearson Chi-Square 3.155a 1 .076
Continuity Correctionb 2.318 1 .128
Likelihood Ratio 3.187 1 .074
Fisher's Exact Test .127 .064
Linear-by-Linear Association 3.107 1 .078
N of Valid Casesb 66
a. 0 cells (,0%) have expected count less than 5. The minimum expected count is 12,50.
b. Computed only for a 2x2 table
kejadianstroke * riwayatkeluargastroke
Continuity Correctionb .000 1 1.000
Likelihood Ratio .160 1 .689
Fisher's Exact Test 1.000 .500
Linear-by-Linear Association .157 1 .692
N of Valid Casesb 66
a. 2 cells (50,0%) have expected count less than 5. The minimum expected count is 3,50.
kejadianstroke * riwayathipertensi
Continuity Correctionb 8.759 1 .003
Likelihood Ratio 10.570 1 .001
Fisher's Exact Test .003 .001
Linear-by-Linear Association 10.124 1 .001
N of Valid Casesb 66
a. 0 cells (,0%) have expected count less than 5. The minimum expected count is 15,50.
b. Computed only for a 2x2 table
Crosstab
Continuity Correctionb .639 1 .424
Likelihood Ratio 1.481 1 .224
Fisher's Exact Test .427 .213
Linear-by-Linear Association 1.416 1 .234
N of Valid Casesb 66
a. 2 cells (50,0%) have expected count less than 5. The minimum expected count is 3,50.
b. Computed only for a 2x2 table
Crosstab
Continuity Correctionb 3.556 1 .059
Likelihood Ratio 5.684 1 .017
Fisher's Exact Test .054 .027
Linear-by-Linear Association 5.043 1 .025
N of Valid Casesb 66
a. 2 cells (50,0%) have expected count less than 5. The minimum expected count is 4,00.
b. Computed only for a 2x2 table
Chi-Square Tests
Continuity Correctionb .000 1 1.000
Likelihood Ratio .218 1 .641
Fisher's Exact Test 1.000 .500
Linear-by-Linear Association .213 1 .644
N of Valid Casesb 66
a. 2 cells (50,0%) have expected count less than 5. The minimum expected count is 2,50.
b. Computed only for a 2x2 table
kejadianstroke * riwayatmerokok
Continuity Correctionb 2.546 1 .111
Fisher's Exact Test .108 .054
Linear-by-Linear Association 3.611 1 .057
N of Valid Casesb 66
a. 0 cells (,0%) have expected count less than 5. The minimum expected count is 6,00.
b. Computed only for a 2x2 table
kejadianstroke * riwayatkonsumsialkohol
Continuity Correctionb 1.650 1 .199
Likelihood Ratio 3.178 1 .075
Fisher's Exact Test .197 .098
Linear-by-Linear Association 2.889 1 .089
N of Valid Casesb 66
a. 2 cells (50,0%) have expected count less than 5. The minimum expected count is 3,00.
kejadianstroke * riwayataktivitasfisik
Crosstab Count
riwayataktivitasfisik
Total tidak ada
kejadianstroke tidak ada 33 33
ada 33 33
Total 66 66
Chi-Square Tests Value
Pearson Chi-Square .a
N of Valid Cases 66
a. No statistics are computed because
riwayataktivitasfisik is a constant.
Hasil Uji Bivariat
kejadianstroke * usia Crosstabulation usia
Total Tidak berisiko Berisiko
kejadianstroke tidak ada Count 10 23 33
% within kejadianstroke 30.3% 69.7% 100.0%
ada Count 8 25 33
% within kejadianstroke 24.2% 75.8% 100.0%
Total Count 18 48 66
% within kejadianstroke 27.3% 72.7% 100.0%
Value df
Continuity Correctionb .076 1 .782
Likelihood Ratio .306 1 .580
Fisher's Exact Test .783 .391
Linear-by-Linear Association .301 1 .583
N of Valid Casesb 66
a. 0 cells (,0%) have expected count less than 5. The minimum expected count is 9,00.
b. Computed only for a 2x2 table
Risk Estimate
Value
95% Confidence Interval
Lower Upper
Odds Ratio for kejadianstroke (tidak
ada / ada) 1.359 .457 4.035
For cohort usia = Tidak berisiko 1.250 .565 2.767
For cohort usia = Berisiko .920 .684 1.237
N of Valid Cases 66
kejadianstroke * jeniskelamin Crosstabulation jeniskelamin
Total laki-laki perempuan
kejadianstroke tidak ada Count 9 24 33
% within kejadianstroke 27.3% 72.7% 100.0%
ada Count 16 17 33
% within kejadianstroke 48.5% 51.5% 100.0%
Total Count 25 41 66
% within kejadianstroke 37.9% 62.1% 100.0%
Value df
Continuity Correctionb 2.318 1 .128
Likelihood Ratio 3.187 1 .074
Fisher's Exact Test .127 .064
Linear-by-Linear Association 3.107 1 .078
N of Valid Casesb 66
a. 0 cells (,0%) have expected count less than 5. The minimum expected count is 12,50.
b. Computed only for a 2x2 table
Risk Estimate
Value
95% Confidence Interval
Lower Upper
Odds Ratio for kejadianstroke (tidak
ada / ada) .398 .143 1.112
For cohort jeniskelamin = laki-laki
.562 .291 1.087
For cohort jeniskelamin = perempuan
1.412 .954 2.088
N of Valid Cases 66
kejadianstroke * riwayatkeluargastroke Crosstabulation riwayatkeluargastroke
Total
tidak ada ada
kejadianstroke tidak ada Count 29 4 33
% within kejadianstroke 87.9% 12.1% 100.0%
ada Count 30 3 33
% within kejadianstroke 90.9% 9.1% 100.0%
Total Count 59 7 66
% within kejadianstroke 89.4% 10.6% 100.0%
Value df
Continuity Correctionb .000 1 1.000
Likelihood Ratio .160 1 .689
Fisher's Exact Test 1.000 .500
Linear-by-Linear Association .157 1 .692
N of Valid Casesb 66
a. 2 cells (50,0%) have expected count less than 5. The minimum expected count is 3,50.
b. Computed only for a 2x2 table
Risk Estimate
Value
95% Confidence Interval
Lower Upper
Odds Ratio for kejadianstroke (tidak ada
/ ada) .725 .149 3.525
For cohort riwayatkeluargastroke = tidak
ada .967 .818 1.142
For cohort riwayatkeluargastroke = ada 1.333 .323 5.500
N of Valid Cases 66
kejadianstroke * riwayathipertensi Crosstabulation
riwayathipertensi
Total
tidak ada ada
kejadianstroke tidak ada Count 22 11 33
% within kejadianstroke 66.7% 33.3% 100.0%
ada Count 9 24 33
% within kejadianstroke 27.3% 72.7% 100.0%
Total Count 31 35 66
Chi-Square Tests
Continuity Correctionb 8.759 1 .003
Likelihood Ratio 10.570 1 .001
Fisher's Exact Test .003 .001
Linear-by-Linear Association 10.124 1 .001
N of Valid Casesb 66
a. 0 cells (,0%) have expected count less than 5. The minimum expected count is 15,50.
b. Computed only for a 2x2 table
Risk Estimate
Value
95% Confidence Interval
Lower Upper
Odds Ratio for kejadianstroke (tidak ada
/ ada) 5.333 1.859 15.301
For cohort riwayathipertensi = tidak ada
2.444 1.332 4.486
For cohort riwayathipertensi = ada
.458 .271 .775
N of Valid Cases 66
kejadianstroke * riwayathiperkolesterolemia Crosstabulation riwayathiperkolesterolemia
Total
tidak ada ada
kejadianstroke tidak ada Count 28 5 33
% within kejadianstroke 84.8% 15.2% 100.0%
ada Count 31 2 33
% within kejadianstroke 93.9% 6.1% 100.0%
kejadianstroke * riwayathiperkolesterolemia Crosstabulation riwayathiperkolesterolemia
Total
tidak ada ada
kejadianstroke tidak ada Count 28 5 33
% within kejadianstroke 84.8% 15.2% 100.0%
ada Count 31 2 33
% within kejadianstroke 93.9% 6.1% 100.0%
Total Count 59 7 66
% within kejadianstroke 89.4% 10.6% 100.0%
Chi-Square Tests
Continuity Correctionb .639 1 .424
Likelihood Ratio 1.481 1 .224
Fisher's Exact Test .427 .213
Linear-by-Linear Association 1.416 1 .234
N of Valid Casesb 66
a. 2 cells (50,0%) have expected count less than 5. The minimum expected count is 3,50.
b. Computed only for a 2x2 table
Risk Estimate
Value
95% Confidence Interval
Lower Upper
Odds Ratio for
kejadianstroke (tidak ada /
For cohort
riwayathiperkolesterolemia =
ada
2.500 .522 11.983
N of Valid Cases 66
kejadianstroke * riwayatpjk Crosstabulation riwayatpjk
% within kejadianstroke 78.8% 21.2% 100.0%
Total Count 58 8 66
% within kejadianstroke 87.9% 12.1% 100.0%
Chi-Square Tests
Continuity Correctionb 3.556 1 .059
Likelihood Ratio 5.684 1 .017
Fisher's Exact Test .054 .027
Linear-by-Linear Association 5.043 1 .025
N of Valid Casesb 66
a. 2 cells (50,0%) have expected count less than 5. The minimum expected count is 4,00.
b. Computed only for a 2x2 table
Value
95% Confidence Interval
Lower Upper
Odds Ratio for
kejadianstroke (tidak ada /
ada)
8.615 .995 74.574
For cohort riwayatpjk = tidak
ada 1.231 1.021 1.484
For cohort riwayatpjk = ada .143 .019 1.098
N of Valid Cases 66
kejadianstroke * riwayatdm Crosstabulation riwayatdm
Total tidak ada ada
kejadianstroke tidak ada Count 30 3 33
% within kejadianstroke 90.9% 9.1% 100.0%
Ada Count 31 2 33
% within kejadianstroke 93.9% 6.1% 100.0%
Total Count 61 5 66
% within kejadianstroke 92.4% 7.6% 100.0%
Chi-Square Tests
Value df
Asymp. Sig.
(2-sided)
Exact Sig.
(2-sided)
Exact Sig.
Pearson Chi-Square .216a 1 .642
Continuity Correctionb .000 1 1.000
Likelihood Ratio .218 1 .641
Fisher's Exact Test 1.000 .500
Linear-by-Linear Association .213 1 .644
N of Valid Casesb 66
a. 2 cells (50,0%) have expected count less than 5. The minimum expected count is 2,50.
b. Computed only for a 2x2 table
Risk Estimate
Value
95% Confidence Interval
Lower Upper
Odds Ratio for kejadianstroke (tidak
ada / ada) .645 .101 4.137
For cohort riwayatdm = tidak ada .968 .843 1.111
For cohort riwayatdm = ada 1.500 .268 8.401
N of Valid Cases 66
kejadianstroke * riwayatmerokok Crosstabulation riwayatmerokok
Total tidak ada ada
% within kejadianstroke 90.9% 9.1% 100.0%
Ada Count 24 9 33
% within kejadianstroke 72.7% 27.3% 100.0%
Total Count 54 12 66
% within kejadianstroke 81.8% 18.2% 100.0%
Chi-Square Tests
Continuity Correctionb 2.546 1 .111
Likelihood Ratio 3.808 1 .051
Fisher's Exact Test .108 .054
Linear-by-Linear Association 3.611 1 .057
N of Valid Casesb 66
a. 0 cells (,0%) have expected count less than 5. The minimum expected count is 6,00.
b. Computed only for a 2x2 table
Risk Estimate
Value
95% Confidence Interval
Lower Upper
Odds Ratio for kejadianstroke (tidak ada /
ada) 3.750 .913 15.400
For cohort riwayatmerokok = tidak ada 1.250 .988 1.581
For cohort riwayatmerokok = ada .333 .099 1.123
N of Valid Cases 66
kejadianstroke * riwayatkonsumsialkohol Crosstabulation riwayatkonsumsialkohol
Total
tidak ada ada
kejadianstroke tidak ada Count 32 1 33
ada Count 28 5 33
% within kejadianstroke 84.8% 15.2% 100.0%
Total Count 60 6 66
Continuity Correctionb 1.650 1 .199
Likelihood Ratio 3.178 1 .075
Fisher's Exact Test .197 .098
Linear-by-Linear Association 2.889 1 .089
N of Valid Casesb 66
a. 2 cells (50,0%) have expected count less than 5. The minimum expected count is 3,00.
b. Computed only for a 2x2 table
Risk Estimate
Value
95% Confidence Interval
Lower Upper
Odds Ratio for kejadianstroke (tidak ada / ada)
5.714 .629 51.888
For cohort riwayatkonsumsialkohol = tidak ada
1.143 .978 1.336
For cohort riwayatkonsumsialkohol = ada
.200 .025 1.620
N of Valid Cases 66
kejadianstroke * riwayataktivitasfisik Crosstabulation
riwayataktivitasfisik
Total tidak ada
% within kejadianstroke 100.0% 100.0%
ada Count 33 33
% within kejadianstroke 100.0% 100.0%
Total Count 66 66
% within kejadianstroke 100.0% 100.0%
Chi-Square Tests
Value
Pearson Chi-Square .a
N of Valid Cases 66
a. No statistics are computed because
riwayataktivitasfisik is a constant.
Risk Estimate
Value
Odds Ratio for kejadianstroke
(tidak ada / ada) .
a
a. No statistics are computed because
riwayataktivitasfisik is a constant.
FREQUENCIES VARIABLES=usia jeniskelamin riwayatkeluargastroke riwayathipertensi riwayathiperkolesterol emia riwayatpjk riwayatdm riwa
yatmerokok riwayatkonsumsialkohol riwayataktivitasfisik kejadianstroke /STATISTICS=STDDEV MINIMUM MAXIMUM MEAN
/ORDER=ANALYSIS.
Statistics
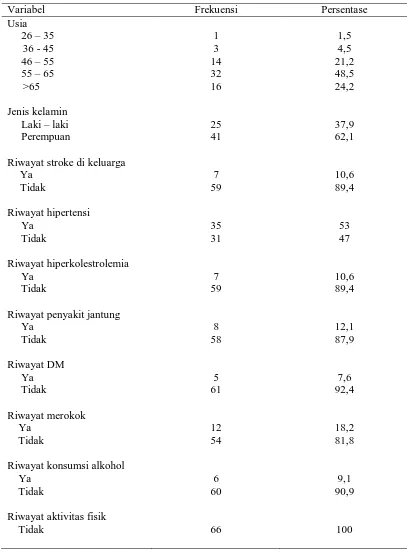
Frequency Percent Valid Percent
Cumulative
Frequency Percent Valid Percent
Cumulative
Percent
perempuan 41 62.1 62.1 100.0
Total 66 100.0 100.0
Riwayatkeluargastroke
Frequency Percent Valid Percent
Cumulative
Percent
Valid tidak ada 59 89.4 89.4 89.4
ada 7 10.6 10.6 100.0
Total 66 100.0 100.0
Riwayathipertensi
Frequency Percent Valid Percent
Cumulative
Percent
Valid tidak ada 31 47.0 47.0 47.0
ada 35 53.0 53.0 100.0
Total 66 100.0 100.0
Riwayathiperkolesterolemia
Frequency Percent Valid Percent
Cumulative
Percent
Valid tidak ada 59 89.4 89.4 89.4
ada 7 10.6 10.6 100.0
Total 66 100.0 100.0
Frequency Percent Valid Percent
Cumulative
Percent
Valid tidak ada 58 87.9 87.9 87.9
ada 8 12.1 12.1 100.0
Total 66 100.0 100.0
Riwayatdm
Frequency Percent Valid Percent
Cumulative
Percent
Valid tidak ada 61 92.4 92.4 92.4
ada 5 7.6 7.6 100.0
Total 66 100.0 100.0
Riwayatmerokok
Frequency Percent Valid Percent
Cumulative
Percent
Valid tidak ada 54 81.8 81.8 81.8
ada 12 18.2 18.2 100.0
Total 66 100.0 100.0
Riwayatkonsumsialkohol
Frequency Percent Valid Percent
Cumulative
Percent
Valid tidak ada 60 90.9 90.9 90.9
ada 6 9.1 9.1 100.0
Riwayataktivitasfisik
Frequency Percent Valid Percent
Cumulative
Percent
Valid tidak ada 66 100.0 100.0 100.0
Kejadianstroke
Frequency Percent Valid Percent
Cumulative
Percent
Valid tidak ada 33 50.0 50.0 50.0
ada 33 50.0 50.0 100.0
Total 66 100.0 100.0
LOGISTIC REGRESSION VARIABLES kejadianstroke /METHOD=ENTER usia
/PRINT=CI(95)
/CRITERIA=PIN(0.05) POUT(0.10) ITERATE(20) CUT(0.5).
Logistic Regression
Case Processing Summary
Unweighted Casesa N Percent
Selected Cases Included in Analysis 66 100.0
Missing Cases 0 .0
Total 66 100.0
Unselected Cases 0 .0
Total 66 100.0
Dependent Variable Encoding Original
Value Internal Value
tidak ada 0
ada 1
Block 0: Beginning Block
Classification Tablea,b
Observed
Predicted
kejadianstroke Percentage
Correct
tidak ada ada
Step 0 Kejadianstroke tidak ada 0 33 .0
ada 0 33 100.0
Overall Percentage 50.0
a. Constant is included in the model.
b. The cut value is ,500
Variables in the Equation
B S.E. Wald df Sig. Exp(B)
Step 0 Constant .000 .246 .000 1 1.000 1.000
Variables not in the Equation
Score df Sig.
Step 0 Variables Usia .497 1 .481
Overall Statistics .497 1 .481
Omnibus Tests of Model Coefficients
Step -2 Log likelihood
Cox & Snell R
Square
Nagelkerke R
Square
1 90.996a .008 .010
a. Estimation terminated at iteration number 3 because parameter
estimates changed by less than ,001.
Classification Tablea
Overall Percentage 47.0
a. The cut value is ,500
Variables in the Equation
B S.E. Wald df Sig. Exp(B)
95,0% C
Lower
Step 1a Usia -.201 .286 .493 1 .483 .818 .4
Variables in the Equation
B S.E. Wald df Sig. Exp(B)
95,0% C
Lower
Step 1a Usia -.201 .286 .493 1 .483 .818 .4
a. Variable(s) entered on step 1: usia.
LOGISTIC REGRESSION VARIABLES kejadianstroke /METHOD=ENTER jeniskelamin
/PRINT=CI(95)
/CRITERIA=PIN(0.05) POUT(0.10) ITERATE(20) CUT(0.5).
Logistic Regression
Case Processing Summary
Unweighted Casesa N Percent
Selected Cases Included in Analysis 66 100.0
Missing Cases 0 .0
Total 66 100.0
Unselected Cases 0 .0
Total 66 100.0
a. If weight is in effect, see classification table for the total number of cases.
Dependent Variable Encoding Original
Value Internal Value
tidak ada 0
ada 1
Classification Tablea,b
Observed
Predicted
kejadianstroke
Percentage
Correct
tidak ada ada
Step 0 kejadianstroke tidak ada 0 33 .0
ada 0 33 100.0
Overall Percentage 50.0
a. Constant is included in the model.
b. The cut value is ,500
Variables in the Equation
B S.E. Wald df Sig. Exp(B)
Step 0 Constant .000 .246 .000 1 1.000 1.000
Variables not in the Equation
Score df Sig.
Step 0 Variables jeniskelamin 3.155 1 .076
Overall Statistics 3.155 1 .076
Block 1: Method = Enter
Omnibus Tests of Model Coefficients
Chi-square df Sig.
Step 1 Step 3.187 1 .074
Block 3.187 1 .074
Model Summary
Step -2 Log likelihood
Cox & Snell R
Square
Nagelkerke R
Square
1 88.308a .047 .063
a. Estimation terminated at iteration number 3 because parameter
estimates changed by less than ,001.
Classification Tablea
Observed
Predicted
kejadianstroke Percentage
Correct
tidak ada ada
Step 1 kejadianstroke tidak ada 24 9 72.7
ada 17 16 48.5
Overall Percentage 60.6
a. The cut value is ,500
Variables in the Equation
B S.E.
Wal
d df Sig. Exp(B)
95,0% C.I.for EXP(B)
Lower Upper
a. Variable(s) entered on step 1:
jeniskelamin.
LOGISTIC REGRESSION VARIABLES kejadianstroke /METHOD=ENTER riwayatkeluargastroke /PRINT=CI(95)
Logistic Regression
Case Processing Summary
Unweighted Casesa N Percent
Selected Cases Included in Analysis 66 100.0
Missing Cases 0 .0
Total 66 100.0
Unselected Cases 0 .0
Total 66 100.0
a. If weight is in effect, see classification table for the total number of cases.
Dependent Variable Encoding Original
Value Internal Value
tidak ada 0
ada 1
Block 0: Beginning Block
Classification Tablea,b
Observed
Predicted
Kejadianstroke
Percentage
Correct
tidak ada Ada
Step 0 Kejadianstroke tidak ada 0 33 .0
ada 0 33 100.0
Overall Percentage 50.0
a. Constant is included in the model.
Variables in the Equation
B S.E. Wald Df Sig. Exp(B)
Step 0 Constant .000 .246 .000 1 1.000 1.000
Variables not in the Equation
Score Df Sig.
Step 0 Variables riwayatkeluargastroke .160 1 .689
Overall Statistics .160 1 .689
Block 1: Method = Enter
Omnibus Tests of Model Coefficients
Chi-square df Sig.
Step 1 Step .160 1 .689
Block .160 1 .689
Model .160 1 .689
Model Summary
Step -2 Log likelihood
Cox & Snell R
Square
Nagelkerke R
Square
1 91.335a .002 .003
a. Estimation terminated at iteration number 3 because parameter
estimates changed by less than ,001.
Classification Tablea
Kejadianstroke
Percentage
Correct
tidak ada Ada
Step 1 kejadianstroke tidak ada 4 29 12.1
ada 3 30 90.9
Overall Percentage 51.5
a. The cut value is ,500
Variables in the Equation
B S.E. Wald Df Sig. Exp(B)
95,0% C.I.for EXP(B)
Lower Upper
Step 1a riwayatkeluargastroke -.322 .807 .159 1 .690 .725 .149 3.525
Constant .034 .260 .017 1 .896 1.034
a. Variable(s) entered on step 1: riwayatkeluargastroke.
LOGISTIC REGRESSION VARIABLES kejadianstroke /METHOD=ENTER riwayathipertensi
/PRINT=CI(95)
/CRITERIA=PIN(0.05) POUT(0.10) ITERATE(20) CUT(0.5).
Logistic Regression
Case Processing Summary
Unweighted Casesa N Percent
Selected Cases Included in Analysis 66 100.0
Missing Cases 0 .0
Total 66 100.0
Unselected Cases 0 .0
Total 66 100.0
Dependent Variable Encoding Original
Value Internal Value
tidak ada 0
ada 1
Block 0: Beginning Block
Classification Tablea,b
Observed
Predicted
kejadianstroke Percentage
Correct
tidak ada ada
Step 0 Kejadianstroke tidak ada 0 33 .0
Ada 0 33 100.0
Overall Percentage 50.0
a. Constant is included in the model.
b. The cut value is ,500
Variables in the Equation
B S.E. Wald df Sig. Exp(B)
Step 0 Constant .000 .246 .000 1 1.000 1.000
Variables not in the Equation
Score df Sig.
Step 0 Variables Riwayathipertensi 10.280 1 .001
Overall Statistics 10.280 1 .001
Omnibus Tests of Model Coefficients
Step -2 Log likelihood
Cox & Snell R
Square
Nagelkerke R
Square
1 80.925a .148 .197
a. Estimation terminated at iteration number 3 because parameter
estimates changed by less than ,001.
Classification Tablea
Overall Percentage 69.7
a. The cut value is ,500
Variables in the Equation
B S.E. Wald df Sig. Exp(B)
95,0% C.I.for EXP(B)
Lower Upper
Step 1a Riwayathipertensi 1.674 .538 9.691 1 .002 5.333 1.859 15.301
Variables in the Equation
B S.E. Wald df Sig. Exp(B)
95,0% C.I.for EXP(B)
Lower Upper
Step 1a Riwayathipertensi 1.674 .538 9.691 1 .002 5.333 1.859 15.301
a. Variable(s) entered on step 1: riwayathipertensi.
LOGISTIC REGRESSION VARIABLES kejadianstroke /METHOD=ENTER riwayathiperkolesterolemia /PRINT=CI(95)
/CRITERIA=PIN(0.05) POUT(0.10) ITERATE(20) CUT(0.5).
Logistic Regression
Case Processing Summary
Unweighted Casesa N Percent
Selected Cases Included in Analysis 66 100.0
Missing Cases 0 .0
Total 66 100.0
Unselected Cases 0 .0
Total 66 100.0
a. If weight is in effect, see classification table for the total number of cases.
Dependent Variable Encoding Original
Value Internal Value
Dependent Variable Encoding Original
Value Internal Value
tidak ada 0
ada 1
Block 0: Beginning Block
Classification Tablea,b
Observed
Predicted
kejadianstroke Percentage
Correct
tidak ada ada
Step 0 kejadianstroke tidak ada 0 33 .0
Ada 0 33 100.0
Overall Percentage 50.0
a. Constant is included in the model.
b. The cut value is ,500
Variables in the Equation
B S.E. Wald df Sig. Exp(B)
Step 0 Constant .000 .246 .000 1 1.000 1.000
Variables not in the Equation
Score df Sig.
Step 0 Variables riwayathiperkolesterolemia 1.438 1 .230
Overall Statistics 1.438 1 .230
Omnibus Tests of Model Coefficients
Step -2 Log likelihood
Cox & Snell R
Square
Nagelkerke R
Square
1 90.015a .022 .030
a. Estimation terminated at iteration number 3 because parameter
estimates changed by less than ,001.
Classification Tablea
Overall Percentage 54.5
a. The cut value is ,500
Variables in the Equation
B S.E. Wald df Sig. Exp(B)
95,0% C.I.for EXP(B)
Lower Upper
Step 1a Riwayathiperkolesterol
emia -1.018 .876 1.350 1 .245 .361 .065 2.013
Variables in the Equation
B S.E. Wald df Sig. Exp(B)
95,0% C.I.for EXP(B)
Lower Upper
Step 1a Riwayathiperkolesterol
emia -1.018 .876 1.350 1 .245 .361 .065 2.013
a. Variable(s) entered on step 1: riwayathiperkolesterolemia.
LOGISTIC REGRESSION VARIABLES kejadianstroke /METHOD=ENTER riwayatpjk
/PRINT=CI(95)
/CRITERIA=PIN(0.05) POUT(0.10) ITERATE(20) CUT(0.5).
Logistic Regression
Case Processing Summary
Unweighted Casesa N Percent
Selected Cases Included in Analysis 66 100.0
Missing Cases 0 .0
Total 66 100.0
Unselected Cases 0 .0
Total 66 100.0
a. If weight is in effect, see classification table for the total number of cases.
Dependent Variable Encoding Original
Value Internal Value
tidak ada 0
ada 1
Classification Tablea,b
Observed
Predicted
kejadianstroke
Percentage
Correct
tidak ada ada
Step 0 kejadianstroke tidak ada 0 33 .0
Ada 0 33 100.0
Overall Percentage 50.0
a. Constant is included in the model.
b. The cut value is ,500
Variables in the Equation
B S.E. Wald df Sig. Exp(B)
Step 0 Constant .000 .246 .000 1 1.000 1.000
Variables not in the Equation
Score df Sig.
Step 0 Variables Riwayatpjk 5.121 1 .024
Overall Statistics 5.121 1 .024
Block 1: Method = Enter
Omnibus Tests of Model Coefficients
Chi-square df Sig.
Step 1 Step 5.684 1 .017
Block 5.684 1 .017
Model Summary
Step -2 Log likelihood
Cox & Snell R
Square
Nagelkerke R
Square
1 85.812a .083 .110
a. Estimation terminated at iteration number 5 because parameter
estimates changed by less than ,001.
Classification Tablea
Observed
Predicted
kejadianstroke Percentage
Correct
tidak ada ada
Step 1 kejadianstroke tidak ada 32 1 97.0
Ada 26 7 21.2
Overall Percentage 59.1
a. The cut value is ,500
Variables in the Equation
B S.E. Wald df Sig. Exp(B)
95,0% C.I.for EXP(B)
Lower Upper
Step 1a riwayatp
jk 2.154 1.101 3.825 1 .051 8.615 .995 74.574
Constan
t -.208 .264 .618 1 .432 .813
a. Variable(s) entered on step 1: riwayatpjk.
LOGISTIC REGRESSION VARIABLES kejadianstroke /METHOD=ENTER riwayatdm
/PRINT=CI(95)
Logistic Regression
Case Processing Summary
Unweighted Casesa N Percent
Selected Cases Included in Analysis 66 100.0
Missing Cases 0 .0
Total 66 100.0
Unselected Cases 0 .0
Total 66 100.0
a. If weight is in effect, see classification table for the total number of cases.
Dependent Variable Encoding Original
Value Internal Value
tidak ada 0
Ada 1
Block 0: Beginning Block
Classification Tablea,b
Observed
Predicted
kejadianstroke Percentage
Correct
tidak ada ada
Step 0 kejadianstroke tidak ada 0 33 .0
ada 0 33 100.0
Overall Percentage 50.0
a. Constant is included in the model.
b. The cut value is ,500
Variables in the Equation
B S.E. Wald df Sig. Exp(B)
Step 0 Constant .000 .246 .000 1 1.000 1.000
Score df Sig.
Step 0 Variables riwayatdm .216 1 .642
Overall Statistics .216 1 .642
Block 1: Method = Enter
Omnibus Tests of Model Coefficients
Chi-square Df Sig.
Step 1 Step .218 1 .641
Block .218 1 .641
Model .218 1 .641
Model Summary
Step -2 Log likelihood
Cox & Snell R
Square
Nagelkerke R
Square
1 91.278a .003 .004
a. Estimation terminated at iteration number 3 because parameter
estimates changed by less than ,001.
Classification Tablea
Observed
Predicted
kejadianstroke Percentage
Correct
tidak ada ada
Step 1 kejadianstroke tidak ada 3 30 9.1
ada 2 31 93.9
Overall Percentage 51.5
Variables in the Equation
B S.E. Wald Df Sig. Exp(B)
95,0% C.I.for EXP(B)
Lower Upper
Step 1a riwayatd
m -.438 .948 .214 1 .644 .645 .101 4.137
Constan
t .033 .256 .016 1 .898 1.033
a. Variable(s) entered on step 1: riwayatdm.
LOGISTIC REGRESSION VARIABLES kejadianstroke /METHOD=ENTER riwayatmerokok
/PRINT=CI(95)
/CRITERIA=PIN(0.05) POUT(0.10) ITERATE(20) CUT(0.5).
Logistic Regression
Case Processing Summary
Unweighted Casesa N Percent
Selected Cases Included in Analysis 66 100.0
Missing Cases 0 .0
Total 66 100.0
Unselected Cases 0 .0
Total 66 100.0
a. If weight is in effect, see classification table for the total number of cases.
Dependent Variable Encoding Original
Value Internal Value
tidak ada 0
Block 0: Beginning Block
Classification Tablea,b
Observed
Predicted
kejadianstroke Percentage
Correct
tidak ada ada
Step 0 kejadianstroke tidak ada 0 33 .0
ada 0 33 100.0
Overall Percentage 50.0
a. Constant is included in the model.
b. The cut value is ,500
Variables in the Equation
B S.E. Wald df Sig. Exp(B)
Step 0 Constant .000 .246 .000 1 1.000 1.000
Variables not in the Equation
Score df Sig.
Step 0 Variables riwayatmerokok 3.667 1 .056
Overall Statistics 3.667 1 .056
Block 1: Method = Enter
Omnibus Tests of Model Coefficients
Chi-square Df Sig.
Step 1 Step 3.808 1 .051
Block 3.808 1 .051
Model Summary
Step -2 Log likelihood
Cox & Snell R
Square
Nagelkerke R
Square
1 87.688a .056 .075
a. Estimation terminated at iteration number 4 because parameter
estimates changed by less than ,001.
Classification Tablea
Observed
Predicted
kejadianstroke Percentage
Correct
tidak ada ada
Step 1 kejadianstroke tidak ada 30 3 90.9
ada 24 9 27.3
Overall Percentage 59.1
a. The cut value is ,500
Variables in the Equation
B S.E. Wald df Sig. Exp(B)
95,0% C.I.for EXP(B)
Lower Upper
Step 1a riwayatmeroko
k 1.322 .721 3.363 1 .067 3.750 .913 15.400
Constant -.223 .274 .664 1 .415 .800
a. Variable(s) entered on step 1: riwayatmerokok.
LOGISTIC REGRESSION VARIABLES kejadianstroke /METHOD=ENTER riwayatkonsumsialkohol /PRINT=CI(95)
/CRITERIA=PIN(0.05) POUT(0.10) ITERATE(20) CUT(0.5).
Logistic Regression
Unweighted Casesa N Percent
Selected Cases Included in Analysis 66 100.0
Missing Cases 0 .0
Total 66 100.0
Unselected Cases 0 .0
Total 66 100.0
a. If weight is in effect, see classification table for the total number of cases.
Dependent Variable Encoding Original
Value Internal Value
tidak ada 0
Ada 1
Block 0: Beginning Block
Classification Tablea,b
Observed
Predicted
kejadianstroke
Percentage
Correct
tidak ada ada
Step 0 kejadianstroke tidak ada 0 33 .0
ada 0 33 100.0
Overall Percentage 50.0
a. Constant is included in the model.
b. The cut value is ,500
Variables in the Equation
B S.E. Wald df Sig. Exp(B)
Variables not in the Equation
Score df Sig.
Step 0 Variables riwayatkonsumsialkohol 2.933 1 .087
Overall Statistics 2.933 1 .087
Block 1: Method = Enter
Omnibus Tests of Model Coefficients
Chi-square Df Sig.
Step 1 Step 3.178 1 .075
Block 3.178 1 .075
Model 3.178 1 .075
Model Summary
Step -2 Log likelihood
Cox & Snell R
Square
Nagelkerke R
Square
1 88.318a .047 .063
a. Estimation terminated at iteration number 4 because parameter
estimates changed by less than ,001.
Classification Tablea
Overall Percentage 56.1
Variables in the Equation
B S.E. Wald df Sig. Exp(B)
95,0% C.I.for EXP(B)
Lower Upper
Step 1a riwayatkonsumsialkohol 1.743 1.126 2.398 1 .122 5.714 .629 51.888
Constant -.134 .259 .266 1 .606 .875
a. Variable(s) entered on step 1: riwayatkonsumsialkohol.
LOGISTIC REGRESSION VARIABLES kejadianstroke /METHOD=ENTER riwayataktivitasfisik
/PRINT=CI(95)
/CRITERIA=PIN(0.05) POUT(0.10) ITERATE(20) CUT(0.5).
Logistic Regression
Case Processing Summary
Unweighted Casesa N Percent
Selected Cases Included in Analysis 66 100.0
Missing Cases 0 .0
Total 66 100.0
Unselected Cases 0 .0
Total 66 100.0
a. If weight is in effect, see classification table for the total number of cases.
Dependent Variable Encoding Original
Value Internal Value
tidak ada 0
Block 0: Beginning Block
Classification Tablea,b
Observed
Predicted
kejadianstroke Percentage
Correct
tidak ada ada
Step 0 Kejadianstroke tidak ada 0 33 .0
ada 0 33 100.0
Overall Percentage 50.0
a. Constant is included in the model.
b. The cut value is ,500
Variables in the Equation
B S.E. Wald df Sig. Exp(B)
Step 0 Constant .000 .246 .000 1 1.000 1.000
Block 1: Method = Enter
Model Summary
Step -2 Log likelihood
Cox & Snell R
Square
Nagelkerke R
Square
1 91.495a .000 .000
a. Estimation terminated at iteration number 1 because parameter
estimates changed by less than ,001.
Classification Tablea
Classification Tablea
Observed
Predicted
kejadianstroke
Percentage
Correct
tidak ada ada
Step 1 Kejadianstroke tidak ada 0 33 .0
ada 0 33 100.0
Overall Percentage 50.0
a. The cut value is ,500
Variables in the Equation
B S.E. Wald df Sig. Exp(B)
Step 1 Constant .000 .246 .000 1 1.000 1.000
LOGISTIC REGRESSION VARIABLES kejadianstroke
/METHOD=ENTER jeniskelamin riwayathipertensi riwayathiperkolesterolemia riwayatpjk riwayatmerokok ri wayatkonsumsialkohol
/PRINT=CI(95)
/CRITERIA=PIN(0.05) POUT(0.10) ITERATE(20) CUT(0.5).
Logistic Regression
ase Processing Summary
Unweighted Casesa N Percent
Selected Cases Included in Analysis 66 100.0
Missing Cases 0 .0
Total 66 100.0
Unselected Cases 0 .0
Total 66 100.0
Dependent Variable Encoding Original
Value Internal Value
tidak ada 0
Ada 1
Block 0: Beginning Block
Classification Tablea,b
Observed
Predicted
kejadianstroke
Percentage
Correct
tidak ada ada
Step 0 kejadianstroke tidak ada 0 33 .0
ada 0 33 100.0
Overall Percentage 50.0
a. Constant is included in the model.
b. The cut value is ,500
Variables in the Equation
B S.E. Wald df Sig. Exp(B)
Step 0 Constant .000 .246 .000 1 1.000 1.000
Variables not in the Equation
Score df Sig.
Step 0 Variables Jeniskelamin 3.155 1 .076
Riwayathipertensi 10.280 1 .001
riwayathiperkolesterolemia 1.438 1 .230
riwayatpjk 5.121 1 .024
riwayatmerokok 3.667 1 .056
Variables not in the Equation
Score df Sig.
Step 0 Variables Jeniskelamin 3.155 1 .076
Riwayathipertensi 10.280 1 .001
riwayathiperkolesterolemia 1.438 1 .230
riwayatpjk 5.121 1 .024
riwayatmerokok 3.667 1 .056
riwayatkonsumsialkohol 2.933 1 .087
Overall Statistics 21.060 6 .002
Block 1: Method = Enter
Omnibus Tests of Model Coefficients
Chi-square Df Sig.
Step 1 Step 24.484 6 .000
Block 24.484 6 .000
Model 24.484 6 .000
Model Summary
Step -2 Log likelihood
Cox & Snell R
Square
Nagelkerke R
Square
1 67.011a .310 .413
a. Estimation terminated at iteration number 5 because parameter
estimates changed by less than ,001.
Classification Tablea
Observed
Predicted
kejadianstroke Percentage
Correct
tidak ada ada
Step 1 kejadianstroke tidak ada 27 6 81.8
ada 12 21 63.6
Overall Percentage 72.7
Variables in the Equation
B S.E. Wald df Sig. Exp(B)
95,0% C.I.for EXP(B)
Lower Upper
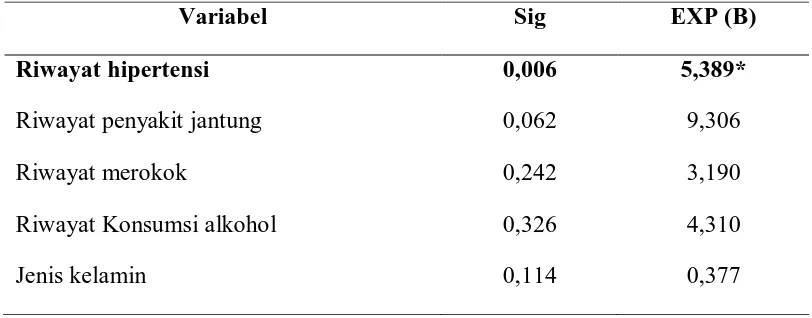
Step 1a jeniskelamin -.976 .622 2.460 1 .117 .377 .111 1.276
riwayathipertensi 1.631 .617 6.988 1 .008 5.106 1.524 17.105
riwayathiperkolesterolem
ia -1.207 1.227 .968 1 .325 .299 .027 3.312
riwayatpjk 2.258 1.181 3.654 1 .056 9.566 .944 96.905
riwayatmerokok 1.081 .992 1.187 1 .276 2.947 .422 20.596
riwayatkonsumsialkohol 1.837 1.615 1.295 1 .255 6.281 .265 148.808
Constant .237 1.086 .048 1 .827 1.268
a. Variable(s) entered on step 1: jeniskelamin, riwayathipertensi, riwayathiperkolesterolemia, riwayatpjk,
riwayatmerokok, riwayatkonsumsialkohol.
LOGISTIC REGRESSION VARIABLES kejadianstroke
/METHOD=ENTER jeniskelamin riwayathipertensi riwayatpjk riwayatmerokok riwayatkonsumsialkohol /PRINT=CI(95)
/CRITERIA=PIN(0.05) POUT(0.10) ITERATE(20) CUT(0.5).
Logistic Regression
Case Processing Summary
Unweighted Casesa N Percent
Selected Cases Included in Analysis 66 100.0
Missing Cases 0 .0
Total 66 100.0
Unselected Cases 0 .0
Total 66 100.0
Dependent Variable Encoding Original
Value Internal Value
tidak ada 0
Ada 1
Block 0: Beginning Block
Classification Tablea,b
Observed
Predicted
kejadianstroke
Percentage
Correct
tidak ada ada
Step 0 Kejadianstroke tidak ada 0 33 .0
ada 0 33 100.0
Overall Percentage 50.0
a. Constant is included in the model.
b. The cut value is ,500
Variables in the Equation
B S.E. Wald df Sig. Exp(B)
Step 0 Constant .000 .246 .000 1 1.000 1.000
Variables not in the Equation
Score df Sig.
Step 0 Variables Jeniskelamin 3.155 1 .076
riwayathipertensi 10.280 1 .001
riwayatpjk 5.121 1 .024
riwayatmerokok 3.667 1 .056
riwayatkonsumsialkohol 2.933 1 .087
Block 1: Method = Enter
Omnibus Tests of Model Coefficients
Chi-square Df Sig.
Step 1 Step 23.437 5 .000
Block 23.437 5 .000
Model 23.437 5 .000
Model Summary
Step -2 Log likelihood
Cox & Snell R
Square
Nagelkerke R
Square
1 68.058a .299 .399
a. Estimation terminated at iteration number 5 because parameter
estimates changed by less than ,001.
Classification Tablea
Overall Percentage 72.7
a. The cut value is ,500
Variables in the Equation
B S.E. Wald df Sig. Exp(B)
95,0% C.I.for EXP(B)
Classification Tablea
Overall Percentage 72.7
Constant .126 1.081 .014 1 .907 1.134
a. Variable(s) entered on step 1: jeniskelamin, riwayathipertensi, riwayatpjk, riwayatmerokok, riwayatkonsumsialkohol.
LOGISTIC REGRESSION VARIABLES kejadianstroke
/METHOD=ENTER jeniskelamin riwayathipertensi riwayatpjk riwayatmerokok /PRINT=CI(95)
/CRITERIA=PIN(0.05) POUT(0.10) ITERATE(20) CUT(0.5).
Logistic Regression
Case Processing Summary
Unweighted Casesa N Percent
Selected Cases Included in Analysis 66 100.0
Missing Cases 0 .0
Total 66 100.0
Unselected Cases 0 .0
Total 66 100.0
a. If weight is in effect, see classification table for the total number of cases.
Dependent Variable Encoding Original
Value Internal Value
tidak ada 0
Block 0: Beginning Block
Classification Tablea,b
Observed
Predicted
kejadianstroke Percentage
Correct
tidak ada ada
Step 0 kejadianstroke tidak ada 0 33 .0
ada 0 33 100.0
Overall Percentage 50.0
a. Constant is included in the model.
b. The cut value is ,500
Variables in the Equation
B S.E. Wald df Sig. Exp(B)
Step 0 Constant .000 .246 .000 1 1.000 1.000
Variables not in the Equation
Score df Sig.
Step 0 Variables jeniskelamin 3.155 1 .076
riwayathipertensi 10.280 1 .001
riwayatpjk 5.121 1 .024
riwayatmerokok 3.667 1 .056
Block 1: Method = Enter
Omnibus Tests of Model Coefficients
Chi-square Df Sig.
Step 1 Step 22.416 4 .000
Block 22.416 4 .000
Model 22.416 4 .000
Model Summary
Step -2 Log likelihood
Cox & Snell R
Square
Nagelkerke R
Square
1 69.079a .288 .384
a. Estimation terminated at iteration number 5 because parameter
estimates changed by less than ,001.
Classification Tablea
Overall Percentage 74.2
a. The cut value is ,500
ariables in the Equation
B S.E. Wald df Sig. Exp(B)
Step 1a jeniskelamin -.940 .614 2.348 1 .125 .391
riwayathipertensi 1.623 .599 7.346 1 .007 5.068
riwayatpjk 2.225 1.187 3.511 1 .061 9.250
ariables in the Equation
B S.E. Wald df Sig. Exp(B)
Step 1a jeniskelamin -.940 .614 2.348 1 .125 .391
riwayathipertensi 1.623 .599 7.346 1 .007 5.068
riwayatpjk 2.225 1.187 3.511 1 .061 9.250
riwayatmerokok 1.835 .799 5.276 1 .022 6.268
Constant .105 1.076 .010 1 .922 1.111
a. Variable(s) entered on step 1: jeniskelamin, riwayathipertensi, riwayatpjk, riwayatmerokok.
LOGISTIC REGRESSION VARIABLES kejadianstroke
/METHOD=ENTER jeniskelamin riwayathipertensi riwayatpjk riwayatkonsumsialkohol /PRINT=CI(95)
/CRITERIA=PIN(0.05) POUT(0.10) ITERATE(20) CUT(0.5).
Logistic Regression
Case Processing Summary
Unweighted Casesa N Percent
Selected Cases Included in Analysis 66 100.0
Missing Cases 0 .0
Total 66 100.0
Unselected Cases 0 .0
Total 66 100.0
a. If weight is in effect, see classification table for the total number of cases.
Dependent Variable Encoding Original
Value Internal Value
tidak ada 0
Block 0: Beginning Block
Classification Tablea,b
Observed
Predicted
kejadianstroke
Percentage
Correct
tidak ada ada
Step 0 Kejadianstroke tidak ada 0 33 .0
ada 0 33 100.0
Overall Percentage 50.0
a. Constant is included in the model.
b. The cut value is ,500
Variables in the Equation
B S.E. Wald df Sig. Exp(B)
Step 0 Constant .000 .246 .000 1 1.000 1.000
Variables not in the Equation
Score df Sig.
Step 0 Variables Jeniskelamin 3.155 1 .076
Riwayathipertensi 10.280 1 .001
Riwayatpjk 5.121 1 .024
riwayatkonsumsialkohol 2.933 1 .087
Overall Statistics 19.298 4 .001
Block 1: Method = Enter
Omnibus Tests of Model Coefficients
Chi-square Df Sig.
Step 1 Step 21.987 4 .000
Omnibus Tests of Model Coefficients
Step -2 Log likelihood
Cox & Snell R
Square
Nagelkerke R
Square
1 69.508a .283 .378
a. Estimation terminated at iteration number 5 because parameter
estimates changed by less than ,001.
Classification Tablea
Overall Percentage 71.2
a. The cut value is ,500
Variables in the Equation
B S.E. Wald df Sig. Exp(B)
95,0% C.I.for EXP(B)
Variables in the Equation
B S.E. Wald df Sig. Exp(B)
95,0% C.I.for EXP(B)
Lower Upper
a. Variable(s) entered on step 1: jeniskelamin, riwayathipertensi, riwayatpjk,
riwayatkonsumsialkohol.
LOGISTIC REGRESSION VARIABLES kejadianstroke
/METHOD=ENTER riwayathipertensi riwayatpjk riwayatkonsumsialkohol riwayatmerokok /PRINT=CI(95)
/CRITERIA=PIN(0.05) POUT(0.10) ITERATE(20) CUT(0.5).
Logistic Regression
Case Processing Summary
Unweighted Casesa N Percent
Selected Cases Included in Analysis 66 100.0
Missing Cases 0 .0
Total 66 100.0
Unselected Cases 0 .0
Total 66 100.0
a. If weight is in effect, see classification table for the total number of cases.
Dependent Variable Encoding Original
Value Internal Value
tidak ada 0
Block 0: Beginning Block
Classification Tablea,b
Observed
Predicted
kejadianstroke Percentage
Correct
tidak ada ada
Step 0 kejadianstroke tidak ada 0 33 .0
ada 0 33 100.0
Overall Percentage 50.0
a. Constant is included in the model.
b. The cut value is ,500
Variables in the Equation
B S.E. Wald df Sig. Exp(B)
Step 0 Constant .000 .246 .000 1 1.000 1.000
Variables not in the Equation
Score df Sig.
Step 0 Variables Riwayathipertensi 10.280 1 .001
riwayatpjk 5.121 1 .024
riwayatkonsumsialkohol 2.933 1 .087
riwayatmerokok 3.667 1 .056
Block 1: Method = Enter
Omnibus Tests of Model Coefficients
Chi-square Df Sig.
Step 1 Step 20.868 4 .000
Block 20.868 4 .000
Model 20.868 4 .000
Model Summary
Step -2 Log likelihood
Cox & Snell R
Square
Nagelkerke R
Square
1 70.627a .271 .361
a. Estimation terminated at iteration number 5 because parameter
estimates changed by less than ,001.
Classification Tablea
Overall Percentage 71.2
a. The cut value is ,500
Variables in the Equation
B S.E. Wald df Sig. Exp(B)
95,0% C.I.for EXP(B)
Lower Upper
Step 1a riwayathipertensi 1.708 .596 8.203 1 .004 5.519 1.715 17.761
Riwayatpjk 2.334 1.167 3.998 1 .046 10.320 1.047 101.702
riwayatkonsumsialkohol 1.350 1.491 .821 1 .365 3.858 .208 71.627
Variables in the Equation
B S.E. Wald df Sig. Exp(B)
95,0% C.I.for EXP(B)
Lower Upper
Step 1a riwayathipertensi 1.708 .596 8.203 1 .004 5.519 1.715 17.761
Riwayatpjk 2.334 1.167 3.998 1 .046 10.320 1.047 101.702
riwayatkonsumsialkohol 1.350 1.491 .821 1 .365 3.858 .208 71.627
riwayatmerokok 1.089 .994 1.200 1 .273 2.972 .423 20.866
Constant -1.447 .485 8.903 1 .003 .235
a. Variable(s) entered on step 1: riwayathipertensi, riwayatpjk, riwayatkonsumsialkohol,
riwayatmerokok.
LOGISTIC REGRESSION VARIABLES kejadianstroke
/METHOD=ENTER riwayathipertensi riwayatkonsumsialkohol riwayatmerokok jeniskelamin /PRINT=CI(95)
/CRITERIA=PIN(0.05) POUT(0.10) ITERATE(20) CUT(0.5).
Logistic Regression
Case Processing Summary
Unweighted Casesa N Percent
Selected Cases Included in Analysis 66 100.0
Missing Cases 0 .0
Total 66 100.0
Unselected Cases 0 .0
Total 66 100.0
a. If weight is in effect, see classification table for the total number of cases.
Dependent Variable Encoding Original
Value Internal Value
tidak ada 0
Block 0: Beginning Block
Classification Tablea,b
Observed
Predicted
kejadianstroke Percentage
Correct
tidak ada ada
Step 0 Kejadianstroke tidak ada 0 33 .0
ada 0 33 100.0
Overall Percentage 50.0
a. Constant is included in the model.
b. The cut value is ,500
Variables in the Equation
B S.E. Wald df Sig. Exp(B)
Step 0 Constant .000 .246 .000 1 1.000 1.000
Variables not in the Equation
Score df Sig.
Step 0 Variables Riwayathipertensi 10.280 1 .001
riwayatkonsumsialkohol 2.933 1 .087
riwayatmerokok 3.667 1 .056
jeniskelamin 3.155 1 .076
Overall Statistics 17.027 4 .002
Block 1: Method = Enter
Omnibus Tests of Model Coefficients
Chi-square Df Sig.
Step 1 Step 18.706 4 .001
Block 18.706 4 .001
Model Summary
Step -2 Log likelihood
Cox & Snell R
Square
Nagelkerke R
Square
1 72.789a .247 .329
a. Estimation terminated at iteration number 5 because parameter
estimates changed by less than ,001.
Classification Tablea
Observed
Predicted
kejadianstroke Percentage
Correct
tidak ada ada
Step 1 Kejadianstroke tidak ada 20 13 60.6
ada 7 26 78.8
Overall Percentage 69.7
a. The cut value is ,500
Variables in the Equation
B S.E. Wald df Sig. Exp(B)
95,0% C.I.for EXP(B)
Lower Upper
a. Variable(s) entered on step 1: riwayathipertensi, riwayatkonsumsialkohol, riwayatmerokok,
jeniskelamin.
/METHOD=ENTER riwayathipertensi riwayatkonsumsialkohol riwayatmerokok jeniskelamin riwayatpjk /PRINT=CI(95)
/CRITERIA=PIN(0.05) POUT(0.10) ITERATE(20) CUT(0.5).
Logistic Regression
Case Processing Summary
Unweighted Casesa N Percent
Selected Cases Included in Analysis 66 100.0
Missing Cases 0 .0
Total 66 100.0
Unselected Cases 0 .0
Total 66 100.0
a. If weight is in effect, see classification table for the total number of cases.
Dependent Variable Encoding Original
Value Internal Value
tidak ada 0
Ada 1
Block 0: Beginning Block
Classification Tablea,b
Overall Percentage 50.0
a. Constant is included in the model.
Variables in the Equation
B S.E. Wald df Sig. Exp(B)
Step 0 Constant .000 .246 .000 1 1.000 1.000
Variables not in the Equation
Score Df Sig.
Step 0 Variables Riwayathipertensi 10.280 1 .001
riwayatkonsumsialkohol 2.933 1 .087
Riwayatmerokok 3.667 1 .056
Jeniskelamin 3.155 1 .076
Riwayatpjk 5.121 1 .024
Overall Statistics 20.523 5 .001
Block 1: Method = Enter
Omnibus Tests of Model Coefficients
Chi-square Df Sig.
Step 1 Step 23.437 5 .000
Block 23.437 5 .000
Model 23.437 5 .000
Model Summary
Step -2 Log likelihood
Cox & Snell R
Square
Nagelkerke R
Square
Model Summary
Step -2 Log likelihood
Cox & Snell R
Square
Nagelkerke R
Square
1 68.058a .299 .399
a. Estimation terminated at iteration number 5 because parameter
estimates changed by less than ,001.
Classification Tablea
Observed
Predicted
Kejadianstroke Percentage
Correct
tidak ada ada
Step 1 kejadianstroke tidak ada 26 7 78.8
ada 11 22 66.7
Overall Percentage 72.7
a. The cut value is ,500
Variables in the Equation
B S.E. Wald df Sig. Exp(B)
95,0% C.I.for EXP(B)
Lower Upper
a. Variable(s) entered on step 1: riwayathipertensi, riwayatkonsumsialkohol, riwayatmerokok, jeniskelamin,
Lampiran 9
Dana Penelitian
1. Proposal
a. Transportasi survey awal Rp. 40.000,-
b. Biaya print kertas proposal Rp. 50.000,-
c. Perbanyakan Proposal Rp. 50.000,-
d. Konsumsi Rp. 150.000,-
2. Pengumpulan dan Pengolahan Data
a. Transportasi Rp. 80.000,-
b. Penggandaan Kuesioner Rp. 80.000,-
c. Souvenir penelitian Rp. 150.000,-
d. Izin Penelitian Rp. 200.000,-
3. Persiapan Skripsi
a. Biaya Print, Penggandaan dan Penjilidan Rp. 150.000,-
b. Konsumsi Rp. 150.000
4. Biaya Tak Terduga Rp. 120.000,-
Lampiran 10
DAFTAR RIWAYAT HIDUP
Nama : Marta Telambanua
Tempat Tanggal Lahir: Fadoro, 09 September 1993
Jenis Kelamin : Perempuan
Agama : Keristen Protestan
Alamat :Jl. Karya Pasar IV Perumahan Marindal Asri No 8B
Riwayat Pendidikan
1. TK Suka Mulya SP 2 Bangkinang Tahun1998 – 2000
2. SD Negeri 2 Nainggolan Tahun2006
3. SMP Negeri 1 Dolok Panribuan Tahun2009
4. SMA Swasta Methodist 7 Medan Tahun2012
DAFTAR PUSTAKA
--- (2008). Laporan hasil riset kesehatan dasar (Riskesdas) Indonesia
Tahun 2007. Jakarta : Badan Penelitian dan pengembangan Departemen
Kesehatan RI.
--- (2013). Riset kesehatan dasar 2013. Jakarta: Badan Penelitian dan pengembangan Departemen Kesehatan RI.
Adam. (2011). Hubungan Umur, Hipertensi, dan Diabetes Melitus dengan
Kejadian Stroke di RSUD Syamsudin SH Sukabumi Periode 1 Mei 2010 –
30 April 2011. Skripsi : Mahasiswa Fakultas Kedokteran Universitas
Muhammadiyah Semarang.
Aisyah. (2012). Hubungan Umur, Jenis Kelamin, dan Hipertensi dengan
Kejadian Stroke. Skripsi : Mahasiswa Pendidikan Dokter FK UHO
Aries. (2006). Waspada Ancaman Penyakit Tidak Menular Solusi Pencegahan
dari Aspek Perilaku dan Lingkungan. Jakarta: PT Alex Media
Komputindo.
Arikunto, S. (2010). Prosedur Penelitian Suatu Pendekatan Praktek. Jakarta: Penerbit: Rineka Cipta.
Axanditya. (2011). Hubungan Faktor Risiko Stroke Non Hemoragik dengan
Fungsi Motorik. Skripsi : Program Pendidikan S-1 Kedokteran Umum
Fakultas Kedokteran Universitas Diponegoro.
Cahyono, B. (2008). Gaya Hidup dan Penyakit Modern. Yogyakarta : Karisius.
Cintya. (2012). Gambaran Faktor dan Tipe Stroke pada Pasien Rawat Inap di
Bagian Penyakit Dalam RSUD Kabupaten Solok Selatan Periode 1
januari 2010 – 31 Juni 2012. Skripsi : Mahasiswa Fakultas Kedokteran
Universitas Andalas.
Ivana. (2012). Hubungan Antara Konsumsi Alkohol dan Status Merokok dengan
Kejadian Hipertensi Pada Laki – laki usia 40 – 65 tahun di Desa Motoling
Dua Kecamatan Motoling Kabupaten Minahasa Selatan. Skripsi :
Mahasiswa Fakultas kesehatan Masyarakat Universitas Sam Ratulangi Manado.
Janssen. A. W. M. (2011). Risk Factor for Ischemic Stroke and Ischemic attack in
Patients Under Age 50. Department Of Internal Medicine Radboud
University Nijmegen Medical Centre.
Lawrewnce M. Brass, M.D. Yale University School Of Medicine Heart Book. 215-233.
Muhammad. (2011). Faktor Risiko Kejadian Stroke di RSUD Undata Palu Tahun
2011. Skripsi : Mahasiswa Program Studi Ilmu Kesehatan Mayarakat
Fakultas Kedokteran dan Ilmu Kesehatan Universitas Tadulako.
Mutmainna. (2012). Faktor Risiko Kejadian Stroke pada Dewasa Awal 18 – 40
Tahun di Kota Makassar tahun 2010 – 2012. Sripsi : Mahasiswa Fakultas
Kesehatan Masyarakat UNHAS Makassar.
Muttaqin, A. (2008). Asuhan Keperawatan Klien dengan gangguan Sistem
Persarafan. Jakarta: Salemba Medika.
Nastiti. (2012). Gambaran Faktor Risiko yang Dimiliki oleh Para Pasien Stroke
Rawat Inap di RSKM. Skripsi : Mahasiswa Fakultas Kesehatan
Masyarakat Universitas Indonesia.
Notoatmojo. (2007). Promosi Kesehatan dan Ilmu Perilaku. Jakarta : Rineka Cipta.
Pudiastuti. (2011). Penyakit Pemicu Stroke.Yogyakarta: Nuha Medika.
Wahyu, G. G. (2008). Stroke Hanya Menyerang Orang Tua?. Yogyakarta: PT Bentang Pustaka.
WHO. (2013). A Global brief on Hypertension. Ganeva, Switzerland.
BAB 3
KERANGKA PENELITIAN
3.1 Kerangka Konsep
Faktor Risiko Stroke
1. Usia
2. Jenis kelamin
3. Riwayat stroke di keluarga
4. Riwayat hipertensi
5. Riwayat penyakit diabetes melitus
6. Riwayat penyakit jantung
7. Riwayat Hiperkolesterolemia
8. Riwayat merokok
9. Riwayat konsumsi alkohol
10. Aktivitas fisik