Serum levels of high-density lipoprotein phospholipids correlate
inversely with severity of angiographically defined coronary artery
disease
Sung Lan Hsia
a,*, Robert Duncan
c, Alain H. Schob
b, Simon C. Chakko
b,
Reinaldo Mulingtapang
b, Jin Lin He
a, Guido O. Perez
baThe Department of Dermatology and Cutaneous Surgery,Veterans’Affairs Medical Center,Medical and Research Ser6ices,
Uni6ersity of Miami School of Medicine,PO Box016250R-250,Miami,FL33101, USA
bThe Department of Medicine,Veterans’Affairs Medical Center,Medical and Research Ser6ices,Uni6ersity of Miami School of Medicine,
Miami,FL33101, USA
cDepartment of Oncology,Uni
6ersity of Miami School of Medicine,Miami,FL 33101, USA Received 10 May 1999; received in revised form 6 December 1999; accepted 13 December 1999
Abstract
In an attempt to assess the relationship between lipid abnormalities and severity of coronary artery disease, we measured serum levels of cholesterol (SC), triglycerides (TG), phospholipids (SP), low density lipoprotein cholesterol (LDL-C), very low density lipoprotein cholesterol (VLDL-C), high density lipoprotein cholesterol (HDL-C), and high density lipoprotein phospholipids (HDL-P), in 217 men undergoing diagnostic coronary arteriography. We found significantly higher mean values of HDL-P and HDL-C in men with normal coronaries, but no significant differences in the other measured lipids. While there was no significant difference in HDL-C among patients with one, two or three-vessel disease, there was a negative correlation between HDL-P levels and the severity of the disease. These observations suggest that prospective studies would be of merit to establish the relevance of HDL-P in the development of coronary artery disease. © 2000 Elsevier Science Ireland Ltd. All rights reserved.
Keywords:Risk factors; Coronary artery disease; High-density lipoprotein cholesterol; High-density lipoprotein phospholipids
www.elsevier.com/locate/atherosclerosis
1. Introduction
Many risk factors for cardiovascular disease have been identified, and lipid abnormalities are among the most important [1]. It is well documented that there is a direct correlation between serum levels of cholesterol (SC), as well as low-density lipoprotein cholesterol (LDL-C), and the risk of coronary artery disease (CAD), and there is an inverse correlation between high density lipoprotein cholesterol (HDL-C) and the risk of the disease [2 – 8]. In addition, apoprotein levels have been found to be better predictors of CAD than the
lipoprotiens [9 – 15]. However, in spite of the volumi-nous literature on risk of CAD, a correlation between lipid abnormality and the severity of CAD has not been established, and no single lipid abnormality or combi-nation of abnormalities has been found to discriminate adequately the non-diseased from diseased subjects [13,14].
Several studies have pointed to an association be-tween atherosclerotic complications and low levels of HDL phospholipids (HDL-P) [15 – 22]. To further ex-plore this association, we undertook the present study, in which we compared levels of HDL-P, HDL-C and other lipid measurements including serum phospho-lipids (SP), SC, TG, LDL-C and VLDL-C, in patients undergoing cardiac catheterization for evaluation of suspected CAD.
* Corresponding author. Tel.: +1-305-2436345; fax: + 1-305-2433206.
2. Methods
2.1. Study subjects
Serum samples were collected consecutively over a 6-month period from 114 men who underwent diagnos-tic coronary angiography for evaluation of chest pain, abnormal stress tests, or abnormal echocardiographic findings at the Miami Veterans’Affairs Medical Center. A year later, a separate group of 103 men underwent similar studies. Fasting blood samples were collected immediately before the angiographic procedure prior to heparin administration, and the collection tube did not contain anti-coagulant. None of the medications were withheld because of the study; these included aspirin, beta-blockers, nitrates, calcium channel blockers, and angiotensin converting enzyme inhibitors, diuretics and digitalis. Approximately 10% of the patients were tak-ing lipid lowertak-ing agents at the time of the study. Some patients had received these medications in recent past. Since the study population was small and the clinical data were incomplete, the data were not stratified ac-cording to medications or other risk factors for atherosclerosis.
Catheterization was performed by either the Sones or the Judkins technique. Multiple views including angu-lated views were obtained, and the angiograms were evaluated. Criterion for judging the angiograms was whether or not there was 50% or greater narrowing of the transluminal diameter (as compared to normal dis-tal segments) in the left anterior descending coronary artery, the left circumflex artery, or the right coronary artery. To eliminate bias of judgment, the clinical inves-tigators were blind to laboratory findings and the labo-ratory was unaware of angiographic findings until all results were recorded and ready for statistical analysis.
2.2. Laboratory procedures
Chemical reagents and enzymes for cholesterol and phospholipid determinations were purchased from Sigma (St. Louis, MO). Enzymes for measuring triglyc-erides were purchased from Calbiochem (La Jolla, CA). Serum lipids were measured by enzymic methods: SC with cholesterol esterase, cholesterol oxidase and perox-idase [23], TG with lipase, glycerol kinase, glycerophos-phate oxidase and peroxidase [24], and choline-containing phospholipids by the micro enzymic method, using phospholipase D, choline oxidase and peroxidase [25].
The enzymic reactions were coupled with the color generating reagent, amino-antipyrine, and the intensity of color was measured at 505 nm with Spectronic 1201, manufactured by Milton Roy (Rochester, NY) for cholesterol and triglycerides. A Thermomax Microplate Reader manufactured by Molecular Devices (Menlo Park, CA) was used for phospholipid determinations. After the serum sample was subjected to ultracen-trifugation with a layer of saline (d=1.006), the VLDL (d=0.960 – 1.006) floating on top was removed. VLDL-C was calculated as the difference between SVLDL-C and cholesterol content in the VLDL-free fraction. HDL-C and HDL-P were measured after removal of Apo B-containing lipoproteins from serum by precipitation with the heparin manganese reagent [26]. LDL-C was calculated by subtracting HDL-C from the cholesterol content in the VLDL-free fraction.
2.3. Statistical procedures
Univariate statistical analyses were performed with the SAS system [27] software packages. Univariate analyses of variance were followed by pairwise com-parisons among disease groups using the Bonferroni correction for multiple comparisons. In order to prop-erly display the differences in the distribution of HDL-C and HDL-P values among the patient groups, a probit analysis [28] using the dummy variable method [29] was used. These analyses provide the parameters for the percentile plots of HDL-C and HDL-P values by patient group. The distribution of subjects by quar-tile was compared between disease groups using Chi square analysis.
3. Results
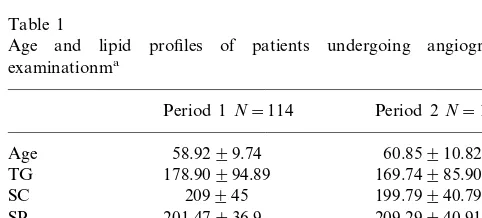
Forty patients had no or minor coronary lesions, 62 had one vessel, 50 had two vessel, and 65 had three vessel disease. Lipid profile data of the study patients collected in the two periods are shown in Table 1. Except for the mean of LDL-C in the second period being higher than that in the first period (126.09 vs.
Table 1
Age and lipid profiles of patients undergoing angiographic examinationma
Period 1N=114 Period 2N=103
Age 58.9299.74 60.85910.82
178.90994.89
TG 169.74985.90
209945 199.79940.79 SC
SP 201.47936.9 209.29940.91
LDL-C 102.03938.70 126.09934.79b
VLDL-C 63.06950.68 33.90919.51 39.78910.81 46.11916.69
HDL-C
88.23918.92 HDL-P 82.22921.66
Table 2
Lipid profiles of patients classified by number of vessels involveda
No. vessels involvedb
None One Two Three
62
N 40 50 65
Age 56.55910.95 58.8798.64 60.8299.15 61.84911.66
TG 161.95992.59 86.529106.40 169975.59 175.26986.08
202.32944.07 200944.61
2 03946.71 206.82942.64
SC
211.95937.35
SPc 205.50940.06 199.26943.20 205.03 935.22
112.89941.40 109.67934.64
LDL-C 119.76955.24 112.92941.75
54.94962.57 46.36930.61
29.28917.95 44.75926.60
VLDL-C
48.90914.54
HDL-C 41.98912.59* 41.96915.55* 41.69911.69*
104922.12
HDL-Pc 86.94920.48* 8 0.98914.63* 74.31914.11*,**,***
aAll values are mean9SD, age in years, and lipids in mg/dl.
bCriterion for judging the angiogram was whether or not there was 50% or greater narrowing of the transluminal diameter in any of the major
coronary arteries.
cPhospholipids were measured by enzymatic assays for choline-containing phospholipids.
*PB0.05 from no vessel disease. **PB0.05 from one vessel disease. ***PB0.06 from two vessel disease.
102.03 mg/dl,PB0.05), all other lipid values were not significantly different. For further analysis, data of the two periods were pooled, and Table 2 shows the distri-bution of lipid values among patients classified accord-ing to the number of occluded vessels.
In subjects with normal coronaries, HDL-C and HDL-P were higher than those with one, two, or three-vessel disease (PB0.05). However, there was no statistically significant difference in HDL-C between the patients with one, two or three-vessel disease. By com-parison, values of HDL-P were not only significantly higher in subjects with normal coronaries than those with occluded arteries, but there were also significant differences among patient groups with one, two or three- vessel disease. The other serum lipids, including SC, TG and LDL-C, were not discriminatory whether the patient had normal or diseased coronaries.
To compare the relative strength of HDL-C and HDL-P in correlation with the severity of CAD, we divided the data into quartiles and tabulated them according to the number of occluded vessels. Table 3 shows such a treatment for HDL-P, and Table 4, for HDL-C. It can be seen in Table 3 that approximately 60% of subjects without clinically significant CAD were in the highest quartile of HDL-P, whereas 50.77% of those with three vessel disease were in the lowest quar-tile, and 40% of those with two-vessel disease were in the second quartile. Patients with one-vessel disease had HDL-P values quite evenly distributed. Such a distinct pattern of distribution could not be found when HDL-C values were subjected to the same treatment (Table 4).
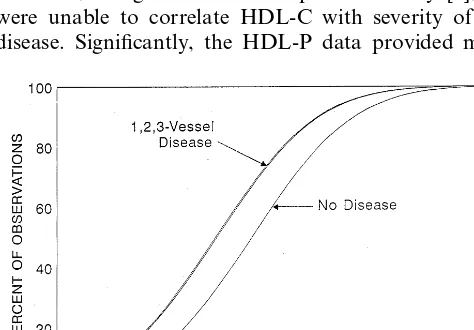
Fig. 1 and Fig. 2 show HDL-P and HDL-C values following probit analysis according to patient groups. This analysis provides a simultaneous pooled estimate of the cumulative distribution of sample values showing the separation of values between groups. As seen in Fig. 1 and Table 2, HDL-C values separate only the non-diseased from the diseased. There are no
differ-Table 3
Distribution of HDL-P values among patient groups
No. vessels involved Quartile of HDL-P values
2nd
1st 3rd 4th
None
24
Frequency 1 2 13
2.50 5.00 32.50
Frequency 11 14 5
% of cases 22.00 40.00 28.00 10.00
Three6esselsa,b,c
33
Frequency 16 11 5
24.62
% of cases 50.77 16.92 7.69
Table 4
Distribution of HDL-C values among patient groups
No. vessels involved Quartile of HDL-C values
4th
1st 2nd 3rd
Nonea
Frequency 5 10 14 11
12.50 25.00
% of cases 35.00 27.50
One6essel
Frequency 19 17 12 14
22.58 19.35
27.42
% of cases 30.65
Two6essels
Frequency 18 12 8 12
36.00 24.00
% of cases 16.00 24.00
Three6essels
Frequency 15 23 12 15
23.08 % of cases 23.08 35.38 18.46
aNo vessel disease compared to other three groups combined,
PB0.038.
information. This observation is in agreement with findings of a previous study by Kunz et al. [22]. In the present study, patients with one vessel disease had higher HDL-P than those with three vessel disease, and those with two vessel disease had higher HDL-P than those with three vessel disease. These data indicate an inverse correlation between HDL-P and the severity of CAD. Other measured lipid factors including SC, TG, and LDL-C did not differ in subjects with or without CAD. Because our data on risk factors were incom-plete, we were unable to perform multivariable analysis. Coronary angiography provides information on the anatomically defined extent of the lesions. In the present study, we quantified the severity of coronary artery involvement by assessing the number of arteries involved. This method is subject to judgemental bias and is less precise than the recently developed quantita-tive angiographic techniques. It none-the-less, offers easy clinical application and the data we collected from the two study periods show good reproducibility (Table 1).
The association of low HDL-P with increased risk of CAD has been reported in several previous studies [16 – 22]. Supporting data can also be found in several epidemiological studies, for example, Schriewer et al. [30] found that low HDL phosphatidylcholine levels correlated with other risk factors for coronary heart disease. Low levels of HDL-P have also been observed in diabetes [31], and end stage renal disease [32], condi-tions known to be associated with high prevalence of cardiovascular diseas.
The decreased HDL-P in CAD may be a result of an impairment of catabolism of the atherogenic triglyce-ride-rich lipoproteins, due to decreased transfer of phopholipids between plasma lipoproteins, mediated in part by the phospholipid transfer protein (PLTP) [33]. It has been shown experimentally that reduced plasma PLTP activity causes markedly decreased HDL lipid and apoproteins, demonstrating the importance of ences among the diseased groups. By contrast, Fig. 2
and Table 3 show that there is a consistent gradient in the distribution of HDL-P across all four patient groups.
4. Discussion
The relatively low LDL-C in our patients reflects the fact that many patients were probably on low fat diets and on lipid lowering agents. Epidemiological studies have established that HDL-C levels are inversely corre-lated with the risk for CAD. Data in Table 2 are in agreement with the established findings, in that patients with occluded arteries had significantly lower HDL-C. However, in agreement with a previous study [6], we were unable to correlate HDL-C with severity of the disease. Significantly, the HDL-P data provided more
PLTP activity in the maintenance of HDL levels [34]. It is not clear how changes in HDL-P may contribute to atherogenesis. It is conceivable that a decrease in phospholipid content may result in reduction of the capacity of HDL particles to accept cholesterol from extrahepatic tissues, and its subsequent removal via the ‘reverse cholesterol pathway’. A recent study has pro-vided evidence that HDL-P concentration and compo-sition are major factors effecting cholesterol efflux capacity from cells to the serum [34].
Taken together with previous findings, data from the present study suggest a possible relationship between low HDL-P and ischemic heart disease. Carefully de-signed prospective studies will be necessary to deter-mine whether or not low HDL-P is an independent predictor for the development of coronary artery disease.
Acknowledgements
This study was supported in part by grants from the Dermatology Foundation of Miami and the Wallace Genetic Foundation. The authors wish to thank Nereida Perez and Ying Nie for technical assistance, and to Gloria Hernandez, Sara Guerrero, and Lilliam Vargas for preparation of the manuscript.
References
[1] Castelli WP. Atherosclerosis 1996;124:S1 – 9.
[2] Kannel WB, Castelli WP, Gordon T, et al. Ann Intern Med 1971;74:1 – 12.
[3] Goldbourt U, Hotzman E, Nuefeld HN. Br Med J 1985;290:1239 – 43.
[4] Stamler J, Wentworth D, Neaton JD. J Am Med Assoc 1986;256:2823 – 8.
[5] Castelli WP, Abbott RD, McNamara PM. Circulation 1983;67:730 – 4.
[6] Swanson JO, Pierfont G, Adicoff A. Am J Med l981;71:235 – 9. [7] Naito HK. Ann NY Acad Sci 1985;454:230 – 8.
[8] Reardon MF, Nestel PJ, Craig IH, et al. Circulation 1985;71:881 – 8.
[9] Avogaro P, Bittolo BG, Cazzolato G, et al. Artery 1978;4:385 – 94.
[10] Maciejko JJ, Holmes DR, Kotte BA, et al. N Engl J Med 1983;309:385 – 9.
[11] Kottke BA, Zinsmeister AR, Holmes DR, et al. Mayo Clin Proc 1986;61:313 – 20.
[12] Schmidt SB, Wasserman AG, Muesing RA, et al. Am J Cardiol 1985;55:1459 – 62.
[13] Sedlis SP, Schechtman KB, Ludbrook PA, et al. Circulation 1986;73:978 – 86.
[14] Frick MH, Dahlen G, Berg K, et al. Chest 1978;73:62 – 5. [15] Perez GO, Mendez AJ, Goldberg RB, et al. Angiology
1990;41:525 – 32.
[16] Kostner GM, Marth E, Pfeiffer KP, et al. Eur Neurol 1986;25:346 – 54.
[17] Diez Prieto F, Baeza Minguez JF. Revista Clinica Espanola l984;173:291 – 6.
[18] Kajiyama G, Nakagawa M, Takata K, et al. Hiroshima J Med Sci 1981;30:175 – 82.
[19] Marques-Vidal P, Ruidavets JB, Cambou JP, et al. Atherosclero-sis 1995;112:29 – 38.
[20] Rajwade NA, Desai NK, Gupta KC. J Ass Phys India 1996;44:544 – 55.
[21] Sall ND, Toure M, Fall S, Sarr NG. Dakar Med 1994;39:77 – 80. [22] Kunz F, Pechlaner C, Erhart R, et al. Atherscler Thromb
1994;14:1146 – 50.
[23] Allain CC, Poon LS, Chan CS, Richmond W, Fu PC. Clin Chem 1974;20:470 – 5.
[24] McGowan MW, Artiss JD, Strandbergh DR, Zak B. Clin Chem 1983;29:538 – 42.
[25] Nie Y, He JL, Hsia SL. Lipids 1993;28:949 – 51. [26] Warnick GR, Albers JJ. J Lipid Res 1978;19:65 – 76.
[27] SAS Institute, SAS/STAT User’s Guide, Version 6, Volune 2. 4th ed. Cary NC, 1989.
[28] Finney DJ. Statistical Method in Biological Assay. New York: Haffner Publishing Company, 1964.
[29] Draper NR, Smith H. Applied Regression Analysis. New York: John Wiley and Sons, 1966.
[30] Schriewer H, Schulte H, Assmann G. J Clin Chem Clin Biochem 1984;22:515 – 21.
[31] Bagdade JD, Subbaiah PV. J Lab Clin Med 1989;113:235 – 40. [32] Lacour B, Roullet JB, Beyne P, Kreis H, Thevenin M, Drueke T.
J Clin Chem Clin Biochem 1985;23:805 – 10. [33] Tall A. Ann Rev Biochem 1995;64:235 – 57.
[34] Fournier N, Paul JL, Atger V, et al. Arterioscler Thromb Vasc Biol 1997;17:2685 – 91.