BUILDING EXTRACTION FROM REMOTE SENSING DATA USING FULLY
CONVOLUTIONAL NETWORKS
K. Bittnera, S. Cuia, P. Reinartza
a
Remote Sensing Technology Institute, German Aerospace Center (DLR), D-82234 Wessling, Germany (ksenia.bittner, shiyong.cui, peter.reinartz)@dlr.de
Commission VI, WG VI/4
KEY WORDS:deep learning, DSM, fully convolutional networks, building footprint, binary classification, fully connected CRF
ABSTRACT:
Building detection and footprint extraction are highly demanded for many remote sensing applications. Though most previous works have shown promising results, the automatic extraction of building footprints still remains a nontrivial topic, especially in complex urban areas. Recently developed extensions of the CNN framework made it possible to perform dense pixel-wise classification of input images. Based on these abilities we propose a methodology, which automatically generates a full resolution binary building mask out of aDigital Surface Model (DSM)using a Fully Convolution Network (FCN) architecture. The advantage of using the depth information is that it provides geometrical silhouettes and allows a better separation of buildings from background as well as through its invariance to illumination and color variations. The proposed framework has mainly two steps. Firstly, the FCN is trained on a large set of patches consisting of normalized DSM (nDSM) as inputs and available ground truth building mask as target outputs. Secondly, the generated predictions from FCN are viewed as unary terms for a Fully connected Conditional Random Fields (FCRF), which enables us to create a final binary building mask. A series of experiments demonstrate that our methodology is able to extract accurate building footprints which are close to the buildings original shapes to a high degree. The quantitative and qualitative analysis show the significant improvements of the results in contrast to the multy-layer fully connected network from our previous work.
1. INTRODUCTION 1.1 Related work
Building detection and footprint extraction are important remote sensing tasks and used in the fields of urban planning and re-construction, infrastructure development, three-dimensional (3D) building model generation, etc. Due to the sophisticated nature of urban environments the collection of building footprints from remotely sensed data is not yet productive and time consuming, if it is manually performed. Therefore, automatic methods are needed in order to complete the efficient collection of building footprints from large urban areas comprising of numerous con-structions. Recently, various approaches have been developed, which perform building extraction on the basis of high-resolution satellite imagery. Depending on the type of data employed for building extraction the existing methods can be divided into two main groups: using aerial or high-resolution satellite imagery and using three-dimensional (3D) information.
Aerial photos and high-resolution satellite images are extensively used in urban studies. The pioneering approaches proposed to extract edge, line and/or corner information, which are funda-mental elements for buildings extraction (Huertas and Nevatia, 1988, Irvin and McKeown, 1989). Many studies additionally in-corporate shadow information to the low-level features (Liow and Pavlidis, 1990, McGlone and Shufelt, 1994, Peng and Liu, 2005). Some methodologies formalize the building extraction problem in terms of graph theory (Kim and Muller, 1999, Krishnamachari and Chellappa, 1996, Sirmacek and Unsalan, 2009). Many re-searchers implemented more forward-looking methods to extract shapes of the detected buildings (Karantzalos and Paragios, 2009, Sirmacek et al., 2010). Further studies, which employ the
ad-vantages of multi-spectral information, solve the detection prob-lem in a classification framework (Lee et al., 2003, Koc-San and Turker, 2014, Sumer and Turker, 2013). However, due to the complexity of shapes and variety of materials of human-made constructions, the image classification in urban areas is still com-plicated.
In order to use the advantage of height information from DSM, obtained from optical stereo images or light detection and rang-ing measurements (LIDAR), several works investigated the build-ing footprint extraction from DSM alone or together with high-resolution imagery. In general, building detection from DSM is a very challenging task due to scene complexities and imperfec-tions in the methodological steps for depth image generation such as stereo matching methods. As a result this leads to a pres-ence of noise in the generated DSM. Although, the quality of stereo DSM concedes to the one from LIDAR data, they have become more popular in recent years due to their large coverage and lower costs as compared to LIDAR data. (Gerke et al., 2001) detects and generates building outlines from DSM by separating them from surrounding above-ground objects such as trees using Normalized Difference Vegetation Index (NDVI). Similar studies are employed in (San and Turker, 2006, Lu et al., 2002). (Krauß et al., 2012) introduced a methodology for DSM-based building mask generation by using an Advanced Rule-based Fuzzy Spec-tral Classification algorithm, which fuses nDSM with the classi-fied multispectral imagery. Afterwards, the height thresholding is applied to extract buildings from other surrounding objects. The approach proposed in (Br´edif et al., 2013) extracts rectangular building footprints directly from the DSM using a Marked Point Process (MPP) of rectangles and then refines them into polygonal building footprints.
automatic extraction of building footprints from DSM, they are still not able to provide satisfactory results. Therefore, our goal is to implement such a methodology, which will automatically, without any assumptions on the shape and size of buildings, ex-tract them from DSMs.
1.2 Deep Neural Networks for building extraction
With the revolutionary appearance of Convolutional Neural Net-works (CNNs), which became the state-of-the-art for image recog-nition problems, it became possible to automatically detect build-ings in remote sensing data. In (Yuan, 2016) the building foot-prints are automatically extracted from hight-resolution satellite images using Convolutional Network (ConvNet) framework. The authors in (Maggiori et al., 2017) propose to generate building mask out of RGB satellite imagery by using a FCN, firstly, trained on possibly inaccurate reference data, and, finally, refined on a small amount of manually labeled data. One of the first ap-proaches for above-ground objects classification from high-reso-lution DSM using a deep learning technique, specifically a Multi-layer Perceptron model, was demonstrated in the work of (Mar-manis et al., 2015). In our previous study (Davydova et al., 2016), we developed a similar approach to create a binary building mask from DSM using a four-layer fully connected neural network. As a continuation of our previous work in this paper we present a methodology using a deep learning approach, for building foot-print extraction from remote sensing data, particularly nDSM, with a focus on dense residential areas. Besides learning discrim-inative per-pixel classifiers, we further encode the output rela-tionship from FCN as unary term for fully connected Conditional Random Fields (CRF) and generate a final building mask.
2. METHODOLOGY 2.1 Fully Convolutional Network
Traditional CNNs architectures were generated for image-level classification tasks, which require an input image of a fixed size h×w×ch(handwrepresent the spatial dimensions, andchis the feature/channel dimension) and output a vector of class scores cli. The fully connected layers of such architectures have fixed
dimensions and completely discard the spatial information. FCNs on the other hand transform fully connected layers as a large set of 1×1 convolutions allowing the network to take input of any size and output classification maps of class scorescli(x, y). However,
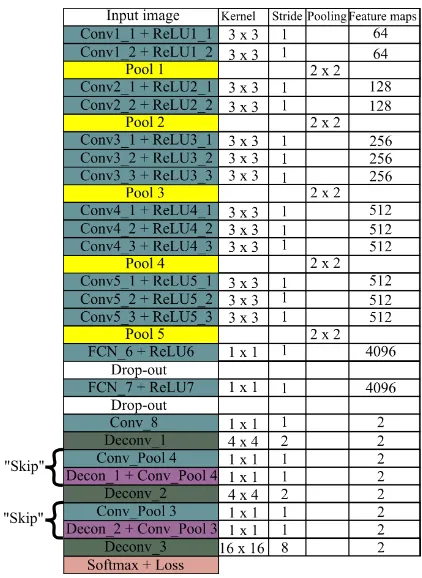
the maps generated by FCN per-class probability have smaller sizes and coarser spatial resolution compared to the input image due to the pooling layers along the network. The solution to this problem is to enlarge the FCN with deconvolution layers, which up-sample the previous layer. As a result, by adding several de-convolution operations at the top part of the network it allows to up-sample the coarse maps to the input image size and get the class scores for each pixel, performing an end-to-end learn-ing by backpropagation from the pixel-wise loss. However, the output of such FCN (known as FCN-32s) cannot obtain satisfy-ing object boundaries, because of the final deconvolution layer, which has the 32 pixel stride, restrict the scale of details. In or-der to refine object boundaries the high-frequency information from lower network layers is added with the help of the so-called “skip” layer. The “skip” layer combines the final prediction layer with the output of earlier convolutional layers with rich infor-mation. In this way, the FCN-16s adds “skip” connection from pool4, and FCN-8s propagates even more detailed information from the pool3 layer, in addition to the pool4 layer (see Figure 1).
Figure 1. Fully convolution network with “skip” connections. The last layers of the network are 2 dimensional feature maps as
we have two classes: building and non-building. More detailed description is given in Section 2.1
2.2 Problem Formulation
In practice, very few people train an entire CNN from scratch (with random initialization) due to the limited amount of training data. Therefore, it is common to take a model, pre-trained on a very large dataset, and transfer its relevant knowledge as an ini-tialization for a new task. Such models can be adapted then to the new task with relatively few training data. Nowadays, several net-works exist, which have been pre-trained on huge image datasets. A FCN, proposed in (Long et al., 2015), was constructed based on VGG-16 network, for which a model pre-trained on the large public image repositories Imagenet (Deng et al., 2009) exists. We take this pre-trained model and fine-tune it for our task, but ran-domly initialize the last layers, because the channel dimension is changed to 2 in order to predict scores for our binary task.
However, in contrast to Imagenet, which contains RGB images as inputs, our training dataset consists of depth images, which carry completely different information compared to intensities. The main concern is whether it is applicable to use a pre-trained model. It turns out to be suitable due to the fact that RGB and depth images share common features such as edges, corners, end-points, etc., at the low and middle level image domains.
The Imagenet database contains images which fit into the GPU size. Remote sensing images are huge and cannot be loaded into the GPU as a whole. As a result, in our work input im-ageI, i.e., nDSM, and corresponding target image with labels M, i.e., a building mask, are tiled into patches of sizew×h: P atchi(I)w×handP atchi(M)w×h.
the shallower network FCN-32s and gradually adding the “skip” connections to include the high-frequency information from the pool4 layer (FCN-16s) and then pool3 (FCN-8s). We apply the same procedure on our dataset: first, we fine-tune a 32 stride net-work, then 16 stride and finally 8 stride, and each next network uses the previous network’s weights to speed up the training pro-cess. We fine-tune the models by minimizing the negative log likelihood and adjusting the weights and biases along the whole network with a backpropagation algorithm using stochastic gradi-ent descgradi-ent (SGD) with a small batch. Mathematically, we solve
min
whereWlare the weights of the last layer,Wl−1are the weights of the previous layer,a(·)is an activation function,yirepresents
given true mask patchesP atchi(M)w×h. The softmax function
is given by
sof tmax(z) = exp(z)
kzk1
(2)
and the loss function is computed as
L=−X
k
yklogpk (3)
wherepkis the label assignment probability at pixelk.
After training, we take the FCN-8s as a final classifier and per-form predictions on a new unseen dataset. Those new data are forwarded though the network as separate patches and the pre-dicted maps with the same size as the patches are obtained. After that, the tiles are stitched together in order to generate an image with the same size as the original DSM.
2.3 Fully connected Conditional Random Field for object boundaries enhancement
In order to generate a binary building mask we need to assign to each image pixel the best suitable label, where 1 corresponds to building and 0 to non-building/background label. At the same time we want to keep spatial correlations between neighboring pixels and accurately localize segment boundaries.
Modern Deep CNN architectures produce typically quite smooth classification results (Chen et al., 2014). Therefore, we are in-terested in obtaining detailed local structures (object boundaries) rather than further smooth it. It can be reached, by applying Fully connected Conditional Random Field (CRF) approach proposed by (Koltun, 2011). Fully connected CRF allows an elegant way to combine single pixel predictions and shared structure through unary and pairwise terms. It differs from standard CRF by estab-lishing pairwise potentials on all pairs of pixels in the image and not only on neighboring pixels.
As described above, the predictions are computed by the cho-sen FCN-8s. These predictions can be seen as pixel-wise unary likelihoodsφi(xi)for the Fully connected CRF energy function
shown in Equation (4).
The pairwise edge potentials is defined by a linear combination of Gaussian kernels and has the form
ψij(xi, xj) =µ(xi, xj)
sian kernel, which depends on features (defined asf) extracted for pixeliandjand is weighted by parameterω(m). The kernels consist of two parts and are contrast-sensitive. They are defined as
where the first term called theappearance kerneland depends on both the pixel color intensities (IiandIj) and pixel positions (pi
andpj). This term encourages assigning similar labels to nearby
pixels with similar color. Parameterθαcontrols the degrees of
nearness andθβof similarity. The second term calledsmoothness
kernelis responsible for removing small isolated regions (Shotton et al., 2009).
As a result, applying the described methodology and minimizing the CRF energyE(x)we search for the most probable label as-signment for each pixel taking into account spatial correlations between them. This finally leads to a binary building mask.
3. STUDY AREA AND EXPEREMENTS
We perform experiments on datasets consisting of DSM recon-structed from WorldView-2 stereo panchromatic images with a resolution of 0.5 meter per pixel using the semi-global match-ing methodology proposed by (d’Angelo and Reinartz, 2011). In order to obtain a nDSM with only above-ground information a topography information was removed based on the methodology described in (Qin et al., 2016). As ground truth, a building mask covering the same region as DSM from the municipality of the city of Munich, Germany is used for learning the parameters in the neural network.
The fine-tuning was done on FCNs implemented in theCaf f e deep learning framework. For learning process we prepared a training data consisting of 7161 pairs of patches with size of 300×300 pixels. To avoid the artifacts and object discontinu-ity at tile boundaries the patches are generated with an overlap of 100 pixels. We start fine-tuning process of FCN-32s with a learn-ing rate of 0.0001, decreaslearn-ing it by a factor of 10 for each next stage of gradual learning. We used a weight decay of 0.0005 and a momentum of 0.99.
The final binary building mask was obtained using the FCRF soft-ware developed in (Koltun, 2011). We chose the smoothnessθγ
and appearance kernel parametersθαandθβafter performing an
experimental grid search varying the spatial and color ranges of these parameters and examining the resulting classification accu-racy. As a result, we found thatθγ= 3,θα= 3 andθβ= 11 work
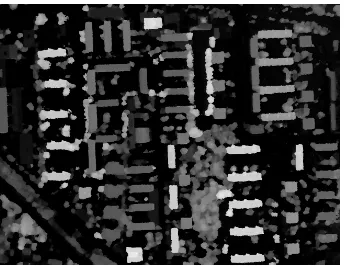
Figure 2. Normalized Digital Surface Model. Test region.
4. RESULTS AND DISCUSSIONS
In this section we present and discuss the results obtained from the methodology described above for binary building mask gen-eration. After gradual training of FCNs, we use the final FCN-8 model for our binary classification task. To demonstrate the performance of our model we present to the network a new test dataset, which was used neither for training nor for validation (see Figure 2).
4.1 Qualitative Results
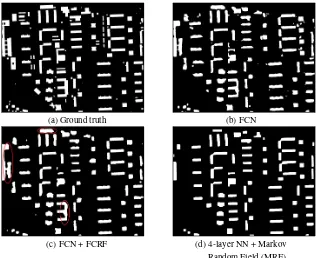
The building mask generated directly from the last layer of FCN-8 network is presented in Figure 3(b). As can be seen from the results, the FCN model is able to extract only the buildings from the nDSM without any influence of other above-ground objects. However, some noise could be noticed in the form of small re-gions near building boundaries together with irregularities of the boundaries itself. Therefore, the Fully connected CRF is applied as a post processing step in order to remove this noise and im-prove the boundaries (see Figure 3(c)). In Figure 3(d) we present the building mask extracted from the four-layer fully connected network from our previous work. The configuration of the net-work stayed the same as described in (Davydova et al., 2016), but in order to perform the comparison, we train it on the same dataset. In comparison to the four-layer network FCN can man-age to extract complex building structures, without missing some of its parts (for example see red marks in left and down parts of Figure 3(c)) and with the size of footprints, which is closer to original one (see red mark on the upper part of Figure 3(c)). This can be explained as deep neural network learns to take into ac-count the context within a 300×300 pixel window in contrast to 32×32 pixel window of four-layer network. Of course, one can increase the input patch size to a bigger one for multy-layer net-work, but it will heavily influence the computation time. Besides, FCN does not over-smooth the object boundaries and can identify more detailed building structures. The absence of some buildings on defined mask is due to the low sensitivity of our approach to the recognition of low-rise buildings, which are surrounded by higher buildings. Another possible reason is their small amount in the training dataset that limited our network in learning this
kind of buildings. Besides, the low-raised buildings can be to-tally covered by the trees that makes their detection impossible.
4.2 Quantitative Results
To assess the quality of the proposed methodology on the se-lected test dataset in comparison to the ground truth shown in Figure 3(a) we used metrics commonly used for semantic seg-mentation and useful for binary classification task. Let TP, FP, FN denote the total number of true positive, false positive and false negative, respectively. Then we can define those metrics as following:
P recision= T P
T P+F P, (8)
Recall= T P
T P+F N (9)
where theP recisionis the fraction of predicted positives which are actual positive, theRecallis the proportion of actual positives which are predicted positive. The higher these metrics, the better the performance of model. Besides, we employ theF−measure (see Equation (10)) derived from the precision and recall values in Equations (8) - (9) for the pixel-based evaluation. For simplicity, we setβ= 1. It reaches its best value at 100%and worst at 0%.
Fmeasure=
(1 +β2)T P
(1 +β)2T P+β2F N+F P (10)
Another useful metric is Intersection over Union (IoU), which is an average value of the intersection of the prediction and ground truth regions over the union of them. Here we adapted this met-ric to the binary case, because in our data there are many more pixels which belong to the background than those belonging to the buildings areas. Therefore, in our case IoU is defined as the number of pixels labeled as building on both in the ground truth and predicted mask, divided by the total number of pixels labeled as buildings in each of them (Maggiori et al., 2017).
IoU= T P npred+ngt
, (11)
wherenpredis the number of pixels labeled as buildings in
pre-dicted mask andngtis the one in ground truth. The results are
presented in Table 1.
The results show that doing a binary classification of remote sens-ing data by ussens-ing a deep convolutional network, in our case the FCN-8, outperforms the binary mask generated by four-layer fully connected network. The FCN followed by a dense fully con-nected CRF refinement significantly improves the mask quality. This statement is also confirmed from the quantitative point of view (see second line of Table 1). The Intersection over Union (IoU) was not improved after applying a post processing step. This can be explained as for some buildings in DSM boundaries cannot be clearly seen due to their possible overlap with trees or inaccuracies of DSM itself. As a result the presence of inaccura-cies in buildings outlines can be observed.
Table 1. Binary classification results on the test dataset in comparison to the four-layer network.
Fmeasure IoU P recision Recall
FNC-8 67% 41% 82% 79%
FNC-8+FCRF 70% 41% 86% 78%
(a) Ground truth (b) FCN
(c) FCN + FCRF (d) 4-layer NN + Markov
Random Field (MRF)
Figure 3. Results of extraction of building footprints from test region.
5. CONCLUSION AND FUTURE WORK Recent developments in neural network approaches have greatly advanced the performance of visual recognition tasks such as im-age classification, localization and detection. We proposed to use a fully convolutional network architecture for automatic build-ing footprint extraction from remote sensbuild-ing data, specifically the nDSM. The main advantage of using DSM data is that they pro-vide the elevation information of the objects, which is crucial for the tasks such as buildings extraction in urban area. Because the satellite images are huge, we tile the nDSM and available ref-erence building mask into patches. In the first step, the FCNs were trained on the prepared set of patches to extract the building footprints. The predictions, generated afterwords, are presented as unary terms to the Fully connected CRF and, finally, the bi-nary building mask is obtained. Experimental results show that the deep neural network approaches are suitable for the remote sensing applications such as building footprints extraction. The proposed methodology can generalize various shapes of urban and industrial buildings and is robust to their complexity and ori-entation. Some undetected buildings can be explained as they are totally covered by trees or they exhibit noisy representations of the DSM itself. In our further work, we will refine building outlines directly during the learning process including additional input data such as panchromatic or RGB images and will reorga-nize the network structure. The extracted building outlines then will be used for 3D model reconstruction.
REFERENCES
Br´edif, M., Tournaire, O., Vallet, B. and Champion, N., 2013. Ex-tracting polygonal building footprints from digital surface mod-els: a fully-automatic global optimization framework. ISPRS journal of photogrammetry and remote sensing77, pp. 57–65.
Chen, L.-C., Papandreou, G., Kokkinos, I., Murphy, K. and Yuille, A. L., 2014. Semantic image segmentation with deep
convolutional nets and fully connected crfs. arXiv preprint arXiv:1412.7062.
d’Angelo, P. and Reinartz, P., 2011. Semiglobal matching results on the isprs stereo matching benchmark.
Davydova, K., Cui, S. and Reinartz, P., 2016. Building footprint extraction from digital surface models using neural networks. In: SPIE Remote Sensing, International Society for Optics and Pho-tonics, pp. 100040J–100040J.
Deng, J., Dong, W., Socher, R., Li, L.-J., Li, K. and Fei-Fei, L., 2009. Imagenet: A large-scale hierarchical image database. In:Computer Vision and Pattern Recognition, 2009. CVPR 2009. IEEE Conference on, IEEE, pp. 248–255.
Gerke, M., Heipke, C. and Straub, B.-M., 2001. Building ex-traction from aerial imagery using a generic scene model and invariant geometric moments. In:Remote Sensing and Data Fu-sion over Urban Areas, IEEE/ISPRS Joint Workshop 2001, IEEE, pp. 85–89.
Huertas, A. and Nevatia, R., 1988. Detecting buildings in aerial images. Computer Vision, Graphics, and Image Processing 41(2), pp. 131–152.
Irvin, R. B. and McKeown, D. M., 1989. Methods for exploit-ing the relationship between buildexploit-ings and their shadows in aerial imagery. In:OE/LASE’89, 15-20 Jan., Los Angeles. CA, Interna-tional Society for Optics and Photonics, pp. 156–164.
Karantzalos, K. and Paragios, N., 2009. Recognition-driven two-dimensional competing priors toward automatic and accu-rate building detection. IEEE Transactions on Geoscience and Remote Sensing47(1), pp. 133–144.
Kim, T. and Muller, J.-P., 1999. Development of a graph-based approach for building detection. Image and Vision Computing 17(1), pp. 3–14.
Koltun, V., 2011. Efficient inference in fully connected crfs with gaussian edge potentials. Adv. Neural Inf. Process. Syst 2(3), pp. 4.
Krauß, T., Sirmacek, B., Arefi, H. and Reinartz, P., 2012. Fusing stereo and multispectral data from worldview-2 for urban model-ing. In:SPIE Defense, Security, and Sensing, International Soci-ety for Optics and Photonics, pp. 83901X–83901X.
Krishnamachari, S. and Chellappa, R., 1996. Delineating build-ings by grouping lines with mrfs. IEEE Transactions on image processing5(1), pp. 164–168.
Lee, D. S., Shan, J. and Bethel, J. S., 2003. Class-guided building extraction from ikonos imagery. Photogrammetric Engineering & Remote Sensing69(2), pp. 143–150.
Liow, Y.-T. and Pavlidis, T., 1990. Use of shadows for extract-ing buildextract-ings in aerial images. Computer Vision, Graphics, and Image Processing49(2), pp. 242–277.
Long, J., Shelhamer, E. and Darrell, T., 2015. Fully convolu-tional networks for semantic segmentation. In: Proceedings of the IEEE Conference on Computer Vision and Pattern Recogni-tion, pp. 3431–3440.
Lu, Y. H., Trunder, J. and Kubik, K., 2002. Automatic building extraction for 3d terrain reconstruction using interpretation tech-niques. School of Surveying and Spatial Information Systems, University of New South Wales, NSW.
Maggiori, E., Tarabalka, Y., Charpiat, G. and Alliez, P., 2017. Convolutional neural networks for large-scale remote-sensing image classification. IEEE Transactions on Geoscience and Re-mote Sensing55(2), pp. 645–657.
Marmanis, D., Adam, F., Datcu, M., Esch, T. and Stilla, U., 2015. Deep neural networks for above-ground detection in very high spatial resolution digital elevation models. ISPRS Annals of the Photogrammetry, Remote Sensing and Spatial Information Sci-ences2(3), pp. 103.
McGlone, J. C. and Shufelt, J. A., 1994. Projective and object space geometry for monocular building extraction. Technical re-port, DTIC Document.
Peng, J. and Liu, Y., 2005. Model and context-driven building extraction in dense urban aerial images.International Journal of Remote Sensing26(7), pp. 1289–1307.
Qin, R., Tian, J. and Reinartz, P., 2016. Spatiotemporal infer-ences for use in building detection using series of very-high-resolution space-borne stereo images. International Journal of Remote Sensing37(15), pp. 3455–3476.
San, D. K. and Turker, M., 2006. Automatic building detection and delineation from high resolution space images using model-based approach. In: Proceedings of the ISPRS Workshop on To-pographic Mapping from Space.
Shotton, J., Winn, J., Rother, C. and Criminisi, A., 2009. Tex-tonboost for image understanding: Multi-class object recognition and segmentation by jointly modeling texture, layout, and con-text.International Journal of Computer Vision81(1), pp. 2–23.
Sirmacek, B. and Unsalan, C., 2009. Urban-area and building de-tection using sift keypoints and graph theory.IEEE Transactions on Geoscience and Remote Sensing47(4), pp. 1156–1167.
Sirmacek, B., d’Angelo, P. and Reinartz, P., 2010. Detecting complex building shapes in panchromatic satellite images for dig-ital elevation model enhancement.
Sumer, E. and Turker, M., 2013. An adaptive fuzzy-genetic algo-rithm approach for building detection using high-resolution satel-lite images. Computers, Environment and Urban Systems39, pp. 48–62.