EXPLOITATION OF DIGITAL SURFACE MODELS GENERATED FROM
WORLDVIEW-2 DATA FOR SAR SIMULATION TECHNIQUES
R. Ilehaga,∗, S. Auerb, P. d’Angelob
a
Institute of Photogrammetry and Remote Sensing, Karlsruhe Institute of Technology (KIT), Englerstr. 7, 76131 Karlsruhe, Germany [email protected]
bRemote Sensing Technology Institute, German Aerospace Center (DLR), 82234 Oberpfaffenhofen, Germany
-(stefan.auer, pablo.angelo)@dlr.de
KEY WORDS:Synthetic Aperture Radar, Digital Surface Models, Simulation, Urban areas
ABSTRACT:
GeoRaySAR, an automated SAR simulator developed at DLR, identifies buildings in high resolution SAR data by utilizing geometric knowledge extracted from digital surface models (DSMs). Hitherto, the simulator has utilized DSMs generated from LiDAR data from airborne sensors with pre-filtered vegetation. Discarding the need for pre-optimized model input, DSMs generated from high resolution optical data (acquired with WorldView-2) are used for the extraction of building-related SAR image parts in this work. An automatic preprocessing of the DSMs has been developed for separating buildings from elevated vegetation (trees, bushes) and reducing the noise level. Based on that, automated simulations are triggered considering the properties of real SAR images.
Locations in three cities, Munich, London and Istanbul, were chosen as study areas to determine advantages and limitations related to WorldView-2 DSMs as input for GeoRaySAR. Beyond, the impact of the quality of the DSM in terms of building extraction is evaluated as well as evaluation of building DSM, a DSM only containing buildings. The results indicate that building extents can be detected with DSMs from optical satellite data with various success, dependent on the quality of the DSM as well as on the SAR imaging perspective.
1. INTRODUCTION
One of the strengths of using SAR images as source of infor-mation is related to near-real time applications in the context of unexpected events, e.g. earthquake, due to by the independence of weather conditions and the time of the day. However, the in-terpretation of scenes covering urban areas acquired with SAR is often a challenging task due to geometric distortion effects perti-nent to the imaging concept.
Various simulators have been developed to ease the interpretation of SAR images of urban areas, e.g. by taking into account the electromagnetic and geometrical properties of buildings (Guida et al., 2008) or by utilizing ray tracing (Hammer and Schulz, 2011). GeoRaySAR is a simulator of the latter type, being de-veloped at DLR, which enables the identification of buildings in high resolution SAR data. To this end, prior knowledge about the scene geometry has to be extracted for the automated predic-tion of building extents. The knowledge can be acquired from either 3D GIS models (Auer and Donaubauer, 2015) or from DSMs (Tao et al., 2014). In (Tao et al., 2014) has prior knowl-edge been derived from DSMs based on LiDAR data (airborne sensor) that only contained man-made structures (i.e. vegetation had been pre-filtered). However, more realistic scenarios would expect DSMs on the basis of satellite data without pre-filtered vegetation (e.g. with support of cadastre information).
As a part of GeoRaySAR, geometric knowledge is extracted from a DSM, which is decomposed to add a digital terrain model (DTM) and a normalized DSM (nDSM) including elevated scene objects. Using the height models, GeoRaySAR simulates separate layers representing different signal reflection types: single, double sig-nal reflections and a combination of both. For standard scenarios,
∗Corresponding author
optical data from satellites is easier to access, such as WorldView-2, compared to LiDAR data acquired from airborne sensors. Ac-quisition of optical data from satellites requires less planning, less man-power and is considerable cheaper than the acquisition of LiDAR data from airborne sensors. Therefore, extending the applicability of GeoRaySAR to use DSMs from high-resolution optical data is a crucial step toward realistic applications.
Studies on the generation of DSMs with the usage of optical stereo images acquired with space borne sensors are presented in e.g. (Zhang and Gr¨un, 2006) and (Hoja et al., 2005). These studies indicate that DSMs generated from space borne sensor can have a height accuracy between 1 to 3 m, depending on the structure of the study area. Based on image matching with em-phasis on tri-stereo data (Carl et al., 2013), DSMs have been gen-erated from high resolution WorldView-2 stereo images for ur-ban scenes, which resulted in few height outliers. (Carl et al., 2013) confirms that the geometric quality of DSMs generated from WorldView-2 data can be used for automated SAR image simulation and, based on that, the interpretation of urban scenes.
This paper presents an extended approach for interpretation of ur-ban areas with the usage of GeoRaySAR, using an automatic pre-processing chain. The main objective of the paper is to preprocess DSMs generated from WorldView-2, a high resolution optical satellite, for identification of buildings in SAR images (acquired with the satellite TerraSAR-X). These DSMs, in comparison to the previously used manually filtered DSMs, need to be prepro-cessed in terms of noise reduction and removal of vegetation. For evaluation of the preprocessing and determining the limitations of GeoRaySAR, study areas consisting of diverse types of buildings and densities are chosen.
are introduced in section 3, while results of the processing chain are shown and discussed in section 4, followed by the conclusion of the paper in section 5.
2. METHODOLOGY
GeoRaySAR requires as input one SAR image meta file, includ-ing the parameters related to the image acquisition, and one DSM. GeoRaySAR produces as output three layers which represent di-rect signal response, signal double reflection and the combination of both in one layer (high reflection levels are deactivated due to the limited level of detail of the DSM). The ray tracing proce-dure, which relies on triangulated surface models derived from the DSM (pixels), can be conducted for different input model de-rived from the DSM, which provides the opportunity to separate buildings and elevated vegetation.
The DSMs used in this study have been generated by utilizing the method described in (Krauß, 2014), a modified version of the semi global matching approach (SGM) (Hirschm¨uller, 2008). Since the main objective in this study is to predict building ex-tents, elevated vegetation is excluded from the input to GeoRaySAR. This was done with an automatic chain for processing the DSMs generated from optical images by SGM.
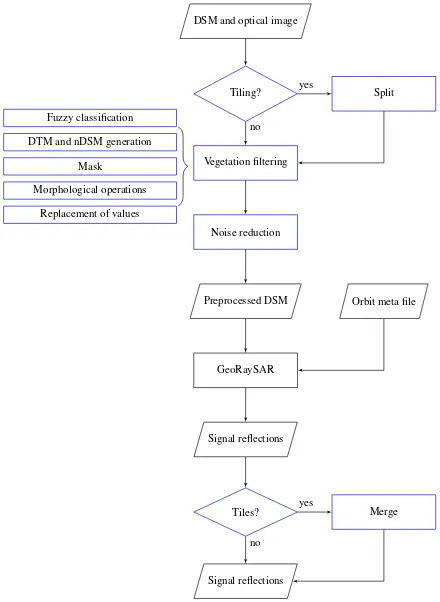
The automatic preprocessing of the DSM consists of two steps, elevated vegetation filtering and noise reduction, and requires an orthorectified optical image and a DSM as input. The DSM and the optical image, which is preferably from same sensor, have to overlap each other, i.e. they have to cover the same scene, share the same spatial resolution and size in terms of number of pixels. A tiling process has been developed as an additional step for the processing of extended scenes. In sum, the steps highlighted in blue color in Figure 1 have been developed in the presented work.
2.1 Preprocessing
Elevated vegetation is separated from buildings to predict build-ing extents in SAR images. The extent of elevated vegetation would be detected during the ray-tracing if left untouched in the DSM, since the GeoRaySAR simulates extents of all objects in the DSM. Hence, by filtering out the elevated vegetation, the DSM scene is cleared with only buildings and ground parts (non-vegetated, vegetated) remaining.
Identifying elevated vegetation is done by calculating the normal-ized difference vegetation index (NDVI) and utilizing a nDSM to detect vegetational growth taller than a height threshold (see chapters 2.1.2 and 2.1.3). Grass is not separated from the DSM as it is considered as part of the ground surface. To reduce the noise in the binary mask, morphological operations are applied (see chapter 2.1.4). Elevated vegetation is separated from build-ings in the DSM by using the binary mask and new height values are assigned to the affected pixels from the given DTM.
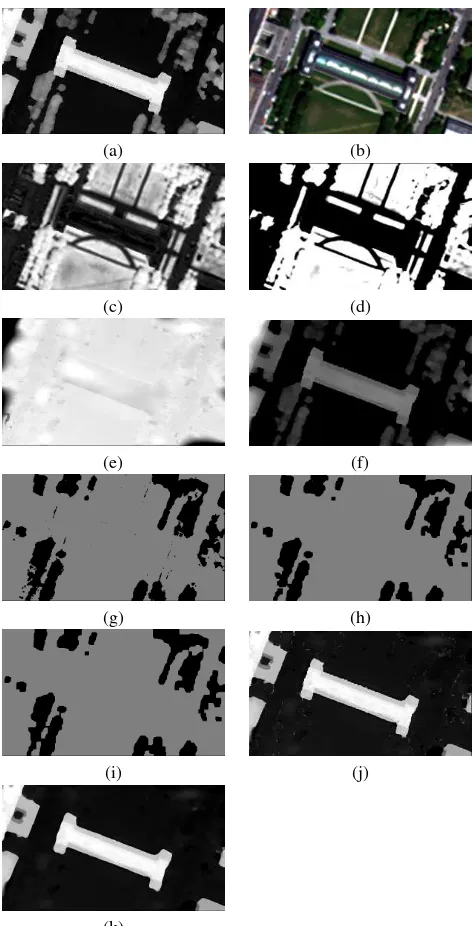
Detailed descriptions of the processing steps are presented in the following subsections (see Figure 2 for an overview, exemplify-ing the procedure for the Alte Pinakothek in Munich). The main objective is to connect geometric information (raw DSM) with the procedure of GeoRaySAR, while preparing the input model in an unsupervised manner.
Figure 1. Work flow of the simulation chain, with the preprocess-ing and the tilpreprocess-ing marked in blue.
2.1.1 Fuzzy Classification Using NDVI The well-known NDVI
is derived from combining the red and near infrared band, often used to detect healthy vegetation. The idea is adopted in this work by calculating the NDVI, by either using the combination of the red and the red-edge band or the red and the infra-red band (de-pending on the availability). The choice of the band combination can be changed depending on the chosen sensor. Equation 1 ex-presses the utilized band combination with RE being the red-edge band and R the red band.
N DV I= RE−R
RE+R (1)
Rule based fuzzy classification is utilized to classify the pixels into vegetation, using the same approach as in (Krauß et al., 2012); see Equation 2. Element x represents the NDVI value, c the lower threshold and d the upper threshold. The classification of vege-tation results in values ranging from 0 to 1, representing the cer-tainty that a pixel is vegetation or not. The thresholds used to classify vegetation are c = 0.2 and d = 0.4. These thresholds were chosen empirically after comparing classification results with the usage of different thresholds. A layer containing the probabil-ity of a pixel being vegetation or not is produced following this concept.
2.1.2 DTM and nDSM Generation To keep non-elevated
(a) (b)
(c) (d)
(e) (f)
(g) (h)
(i) (j)
(k)
Figure 2. Preprocessing steps, exemplified for Alte Pinakothek in Munich, Germany. A DSM generated from WorldView-2 data (a) and an optical image from WorldView-2 (b) are used as in-put to the preprocessing chain. The NDVI (c) is calculated to do the fuzzy classification (d). A DTM (e) and a nDSM (f) are generated. A binary mask (g) is determined to separate elevated vegetation. Noise in the mask is reduced by the morphological operators closing (h) and opening (i). Image (j) displays the re-placement of the height values and (k) the final DSM after noise reduction.
let grass remain in the DSM is to preserve ground information to enable the interpretation of ground parts. In this study grass was assumed to be vegetation with a maximum height of 20 cm. In contrast, elevated vegetation such as trees and bushes are ex-cluded from the DSM and stored in an individual nDSM model.
The method of (Arefi et al., 2011) is used to generate the DTM. Generation of the DTM was done by utilizing a gray-scale recon-struction, an iterative morphological transformation that classifies the pixels into ground or non-ground. Padding is added to ease
the identification of object boundaries close to the border of the image. The size of the padding is set to three pixels, assigned a value of the median DSM height in the full scene. To remove gaps in the resulting DTM, interpolation based on Delaunay tri-angulation is utilized, mentioned in (Arefi et al., 2011). After the removal of the padding pixels, the gaps in the DTM are filled with values derived from a multilevel B-Spline interpolation. By sub-tracting the interpolated DTM from the DSM, the nDSM is de-rived. Finally, non-zero elements of the nDSM (relative heights) are assigned with the original DSM heights (absolute heights).
2.1.3 Separation of Elevated Vegetation By combining the
information gained from the nDSM and the fuzzy classification, a binary mask is derived, assigning elevated vegetation with a pixel value of 0 and 1 otherwise. This is done by using the classifica-tion method described in (Krauß et al., 2012), but with a different minimum height. Pixels that have a certainty of 50% being veg-etation and are taller than the minimum height are classified as elevated vegetation, as seen in Equation 3. Pixels that are consid-ered being elevated vegetation (v in Equation 3) received a pixel value of 0.
Maskx= (
0 ifv≥50%andnDSM≥0.2m
1 ifv <50%andnDSM <0.2m (3)
2.1.4 Morphological Operations, Gap Filling and Noise
Re-duction For reducing the noise in the binary mask, two
mor-phological operations, closing and opening, were used. Closing consists of dilation, expanding the areas containing non-vegetation in this case, followed by erosion, contracting of the areas again. By performing closing, areas smaller than a fixed structure size are filled in with the pixel value 1. Opening consists of firstly exe-cuting erosion followed by dilation, which removes areas smaller than a fixed structure size. The noise in the binary mask is re-duced by performing closing and opening. To reduce the noise for larger areas, the window for morphological operations is set to nine times nine pixels.
DSM pixels with discarded elevated vegetation, i.e. pixels with a value of 0 in the binary mask, receive new height values from the corresponding DTM pixel. A median filter is used for noise reduction with a window size of nine times nine pixels. The de-cision for median filtering was driven by the need to retain the building shapes.
2.1.5 Building DSM Based on the pre-filtered DSM and DTM,
a building DSM is derived. The corresponding DSM pixels are identified by analyzing the difference between the preprocessed DSM and a DTM (value>0). The noise in the resulting binary mask is reduced by morphological operations (opening with 9x9 window, dilation with 3x3 window). The final mask is used to ex-tract the building-related pixels from the pre-filtered DSM. In the context of ray tracing, only the remaining DSM pixels are used for triangulation to describe the scene geometry. Accordingly, SAR signal responses are only derived for building bodies.
2.2 TILING
sampling of the local signal incidence angle. The splitting of the DSM is based on the distance along the longest axis, which re-duces the deviation from the true signal incidence angle. The threshold for splitting the DSM is set to 1200 m for the case studies presented below. Each tile is processed by the simula-tion chain, followed by the merging of the tiles to derive the full scene. The resulting tiles may vary in size due to a variation of maximum heights in the tiles. To cope with this, the maximum and minimum coordinates along the two image axes among the tiles are identified, followed by the calculation of the size for the merged image. Then, an empty image layer is created and the pixel values are retrieved from the simulated tiles. The maximum intensity value is chosen in overlapping areas to keep the empha-sis on the building appearance in the image.
The spatial distance is used for splitting, inherently sampling the signal incidence angle. If the tiling was based on the change of the incidence angle, one study area would be split into a different number of tiles depending on the sensor perspective. At steeper angles, the angle difference increases faster, i.e. SAR images taken at steeper angles would be split into more tiles. The lo-cal scenes would differ unnecessarily in that case, which would hamper the comparison of simulated scenes with remarkable in-cidence angle differences.
3. STUDY AREAS AND DATA
The study areas consist of selected locations in the cities of Mu-nich, London and Istanbul. The three cities contain a variation of built up areas, such as densely packed quarters, narrow streets surrounded by tall buildings and buildings of numerous sizes and types. This is of interest, since such a variation of study scenes has not been used as input in GeoRaySAR earlier.
Data from WorldView-2 is used for the separation of elevated vegetation and for the generation of the DSMs. The SAR images are acquired with TerraSAR-X, where the image meta files are used for extracting the sensor and image parameters. A DSM generated from LiDAR data for the scene of Munich is utilized for comparison with the preprocessed DSM based on WorldView-2, as seen in (Tao et al., 2014). The LiDAR data was acquired April 2003, with a vertical resolution of 0.1 m and a horizontal resolution of 1 m.
The images acquired from WorldView-2 were delivered with a resolution of 0.5 m for the panchromatic images and 2 m for the multi-spectral images. The DSMs had a resolution of 0.5 m and are generated prior to this study by using the modified version of SGM (Krauß, 2014), matching several panchromatic images captured at different viewing angles from the same orbit pass. Four images are used for DSM generation for Munich, five for London and three for Istanbul. The images were acquired 12th of July 2010 for Munich, 22nd of October 2011 for London and 15th of July 2015 for Istanbul. The optical images used for the fuzzy classification were orthorectified.
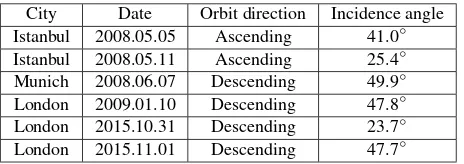
The TerraSAR-X images were captured in high resolution spot-light mode with a spatial resolution of 0.6 m in range and 1.1 m in azimuth (pixel spacing along both axes: 0.5 m). Table 1 provides an overview of information on the TerraSAR-X images.
Table 1. Details about used TerraSAR-X data
City Date Orbit direction Incidence angle Istanbul 2008.05.05 Ascending 41.0◦ Istanbul 2008.05.11 Ascending 25.4◦ Munich 2008.06.07 Descending 49.9◦ London 2009.01.10 Descending 47.8◦ London 2015.10.31 Descending 23.7◦ London 2015.11.01 Descending 47.7◦
4. RESULTS AND DISCUSSION
4.1 Signal reflections
Using the preprocessed DSMs and SAR image meta data as input, SAR image layers were generated. Figure 3 shows the resulting images for the urban scene in Munich, simulated with the DSM generated from LiDAR data and the DSM generated with optical data. The area covers the area of the Viktualienmarkt, located in central Munich, which contains smaller buildings, such as food stalls and shops, and bigger buildings in the surrounding area.
As seen in Figure 3a, the extent of smaller stalls and shops can be seen in the center of the image, which is more difficult to detect in Subfigure 3b. This is due to the quality of the DSM, since it is being generated from optical data and processed. However, the extent of the bigger buildings can be clearly seen in both simula-tion results.
Figure 4 shows the result for the site in the center of London, lo-cated closely to the subway station Southwark. In comparison to the scene in Munich, the area contains many residential buildings with rectangular shapes.
The simulated SAR images can be seen in Figures 4a and 4b, corresponding to the two TerraSAR-X acquisitions. The image pixels appear brighter in 4b compared to 4a. This is caused by the smaller signal incidence angle which leads to stronger diffuse signal responses from ground parts in comparison to the response of building walls, which is mapped to larger layover areas (inten-sity is scaled to 8-bit gray values). The steeper signal incidence angle also leads to overlay effects of nearby buildings, as changes in height are mapped to bigger range intervals.
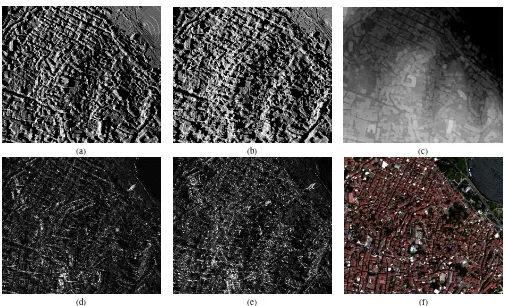
Figure 5 shows the simulation results and related satellite images for the selected site in Istanbul, which contains the north western parts of the district Fatih. In contrast to the sites in London and Munich, this site is densely packed with small buildings on a hill. Tiling was utilized for the scene of Istanbul, due to its size. This can be seen in the northeastern parts of Figure 5a, caused by a scaling difference in the local scenes.
(a) (b) (c)
Figure 3. Simulation for Viktualienmarkt in Munich, using the DSM generated from LiDAR data (a) and the preprocessed DSM generated from WorldView-2 data (b). Image (c) shows the corresponding TerraSAR-X image acquired on June 7th, 2008.
(a) (b) (c) (d)
Figure 4. Residential buildings around Southwark in London. SAR image simulated using the preprocessed DSM (a, b); images c) and d): related TerraSAR-X images acquired in January 2010 and October 2015.
(a) (b) (c)
(d) (e) (f)
(a) (b)
Figure 6. Frauenkirche in Munich. (a) displays the simulated SAR image using the preprocessed DSM; (b) shows the simu-lated building extent based on the building DSM as input, being overlaid on the simulated image.
4.2 Identification of Building Pixels
The site of Frauenkirche in Munich was chosen to display the building extent difference between the preprocessed DSM and the building DSM, seen in Figure 6.
Smaller red dots can be seen spread around the scene, which is most likely elevated vegetation that was not correctly separated during the preprocessing. A few pixels in the building DSM has not been successfully detected as objects above ground, visual-ized as bright grey located which breaks through the building DSM in red. This is an indication that objects were not com-pletely removed in the DTM, since the height difference between the DSM and the DTM was close to zero. However, most build-ing extents have been traced completely.
4.3 Impact of DSM Quality
A test site in the south of Barbican in London was chosen for the evaluation of the quality of the DSMs, which is based on three DSMs generated with a different number of WorldView-2 im-ages. One DSM was generated with two images, one with three and one with five. Figure 7 presents the SAR simulation results and the corresponding input DSMs.
The case study confirms that the simulation benefits from the in-crease of more images used for the generation of the DSM. The resulting SAR image is less noisy and reveals less gaps and errors for facade parts. More interestingly, however, the results indicate that DSMs based on two images lead to acceptable results, i.e., building extents are already described for most buildings. This is promising in the context of realistic scenarios where the avail-ability of satellite data sets is limited.
5. CONCLUSION AND OUTLOOK
It has been shown in this paper that DSMs derived from WorldView-2 data are of sufficient geometric quality for automated SAR sim-ulation in urban areas. For preparing the necessary input mod-els, a dedicated preprocessing chain has been developed which contains filtering, decomposition, and tiling steps. The presented case study results for Munich, London, and Istanbul indicate the capabilities and limits of the simulation method, the latter being primarily related to the input models and the availability of multi-spectral information for filtering.
Differences in the appearance of buildings have been compared for DSMs generated from LiDAR data (airborne sensor) and DSMs
(a) (b)
(c) (d)
(e) (f)
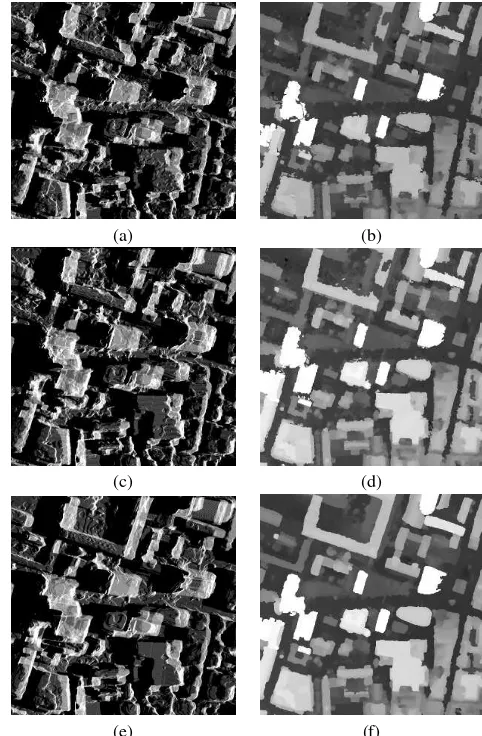
Figure 7. Impact of DSM quality on simulated SAR images; scene: Barbican, London. The DSMs have been generated from different sets of optical images; (a, c, e) simulated SAR images; (b, d, f) DSMs derived from 2, 3, and 5 WorldView-2 images; acquisition date of TerraSAR-X image: November 1st, 2015
generated from WorldView-2 data. The simulated images reveal a better description of small buildings for the LiDAR-based DSM whereas the appearance of buildings of larger scale is compara-ble. Hence, object-based SAR applications related to buildings or building-blocks are realistic, e.g., in the context of city moni-toring or change detection.
The impact of a signal incidence angle differences was exem-plified for urban scenes, showing better separability of building layover areas for steeper incidence angles. Hence, SAR data with bigger signal incidence angles are expected to be more suitable for dense urban scenes. Finally, DSMs generated from 2 or 3 WorldView-2 images are applicable for SAR simulation, even if the difference to results using DSMs from 5 WorldView-2 images is obvious (geometric completeness, noise level).
data import and naming convention). Hence, future studies with GeoRaySAR may extend simulations to further sensor data and expand the study areas to other complex areas sites.
REFERENCES
Arefi, H., dAngelo, P., Mayer, H. and Reinartz, P., 2011. Itera-tive approach for efficient digital terrain model production from CARTOSAT-1 stereo images.Journal of Applied Remote Sensing 5, pp. 1–19.
Auer, S. and Donaubauer, A., 2015. Buildings in high resolu-tion SAR images - identificaresolu-tion based on CityGML data.ISPRS Annals of the Photogrammetry, Remote Sensing and Spatial In-formation Sciencespp. 9–16.
Carl, S., B¨arisch, S., Lang, F., d’ Angelo, P., Arefi, H. and Reinartz, P., 2013. Operational generation of high resolution digital surface models from commercial tri-stereo satellite data. Photogrammetric Week 2013, Stuttgart, Germanypp. 261–269.
Guida, R., Iodice, A., Riccio, D. and Stilla, U., 2008. Model-based interpretation of high-resolution SAR images of buildings. IEEE Journal of Selected Topics in Applied Earth Observations and Remote Sensing1(2), pp. 107–109.
Hammer, H. and Schulz, K., 2011. SAR-simulation of large ur-ban scenes using an extended ray tracing approach. In:2011 Joint Urban Remote Sensing Event, pp. 289–292.
Hirschm¨uller, H., 2008. Stereo processing by semiglobal match-ing and mutual information.IEEE Transactions on Pattern Anal-ysis and Machine Intelligence30(2), pp. 328–341.
Hoja, D., Reinartz, P. and Lehner, M., 2005. DSM generation from high resolution satellite imagery using additional informa-tion contained in existing DSM. ISPRS Workshop 2005 Han-nover, Germany.
Krauß, T., 2014. Six years operational processing of satellite data using CATENA at DLR: Experiences and recommendations.KN Kartographische Nachrichten - Journal of Cartography and Ge-ographic Information64(2), pp. 74–80.
Krauß, T., Sirmacek, B., Arefi, H. and Reinartz, P., 2012. Fusing stereo and multispectral data from WorldView-2 for urban mod-eling. In:Algorithms and Technologies for Multispectral, Hyper-spectral, and Ultraspectral Imagery XVIII 2012, Baltimore, USA, pp. 1–15.
Tao, J., Auer, S., Palubinskas, G., Reinartz, P. and Bamler, R., 2014. Automatic SAR simulation technique for object identi-fication in complex urban scenarios. IEEE Journal of Selected Topics in Applied Earth Observations and Remote Sensing7(3), pp. 994–1003.