A COMBINED APPROACH WITH SMOS AND MODIS TO MONITOR
AGRICULTURAL DROUGHT
N. Sánchez, J. Martínez-Fernández, A. González-Zamora
CIALE, Universidad de Salamanca, Duero 12, 37185 Villamayor, Salamanca, Spain - (nilda, jmf, aglezzamora)@usal.es
Commission VIII, WG VIII/4
KEY WORDS: Agricultural drought, MODIS, SMOS, soil moisture.
ABSTRACT:
A synergistic fusion of the Soil Moisture and Ocean Salinity (SMOS) L2 soil moisture with the Moderate Resolution Imaging Spectroradiometer (MODIS)-derived land surface temperature (LST) and several water/vegetation indices for agricultural drought monitoring was tested. The rationale of the calculation is based on the inverse relationship between LST and vegetation condition, related in turn with the soil moisture content. All the products were time-integrated, including the lagged response of vegetation. The product aims to detect and characterize soil moisture drought conditions and, particularly, to identify potential short-term agricultural droughts among them. The new index, so-called the Soil Moisture Agricultural Drought Index (SMADI), was retrieved at 500 m spatial resolution at the Soil Moisture Measurement Stations Network of the University of Salamanca (REMEDHUS) area from 2010 to 2014 at 8-days temporal scale. SMADI was compared with other agricultural indices in REMEDHUS through statistical correlation, affording a good agreement with them, and depicting a suitable description of the drought conditions in this area during the study period.
1. INTRODUCTION
Drought is a normal, recurring feature of climate, and occurs in virtually all climatic regimes. It is a temporary anomaly, in contrast to aridity, which is a permanent feature of climate and is restricted to low rainfall areas (Wilhite, 2011). Despite the difficulty of a universal definition, an agricultural drought refers to soil water deficit affecting the crop yield, whereas a meteorological drought is characterized by a prolonged and abnormal deficiency of precipitation.
Drought indices are used for identifying, classifying and monitoring drought conditions. They allow quantitative assessment of intensity, duration and spatial extent of anomalous climatic conditions and therefore support decision-making systems (Sánchez et al., 2016). Well-known indices such as the Standardized Precipitation Index (McKee et al., 1993) are mostly precipitation-based, even though there are water budget indices such as the Palmer Drought Severity Index, (Palmer, 1965), soil moisture indices (Martínez-Fernández et al., 2015), and many other hydrological and aridity indices, all of them meant to indicate, from different points of view, water deficit for a given area.
The remote sensing-based indices have the advantage of their wide spatial distribution and coverage, as well as the temporal availability of data. Several agricultural drought indices based on remote sensed products have been proposed, many of them based on vegetation indices (Martínez-Fernández et al., 2016). Vegetative drought indices based on the Normalized Difference Vegetation Index (NDVI) have been widely and successfully used to identify and monitor areas affected by drought at regional and local scales (Bayarjargal et al., 2006; Bhuiyan et al., 2006; Hayes and Decker, 1998; Kogan, 1997; Tucker and Choudhury, 1987). However, in some cases, only vegetation data was not sufficient for accurate drought analysis. Therefore, thermal channels were studied to receive additional information about
drought (Kogan, 1995) through the Land Surface Temperature (LST). The vegetation temperature acts as a proxy of the plant stress caused by both scarce/excessive wetness. Furthermore, if LST-NDVI were jointly considered as a surface condition descriptor, surface properties such as soil water content and evapotranspiration may be inferred (Carlson, 2013). Agricultural drought indices based on soil moisture and evapotranspiration deficits should help effectively monitor agricultural drought (Sivakumar et al., 2011). There is a remarkable inverse relationship between LST and vegetation condition, which in turn is related with soil moisture content. The LST/NDVI slope has been used to assess information related to areal averaged soil moisture conditions (Goetz, 1997; Sandholt et al., 2002) and on climate and drought monitoring (Karnieli et al., 2010; McVicar and Bierwirth, 2001; Sánchez et al., 2016). The negative slope identified in site- and time- specific studies between both variables is the basis of several studies about climate and drought monitoring (Karnieli et al., 2010).
Drought Index (SMADI), including actual soil and temperature conditions together with the lagged response of the vegetation based on vegetation indices. Alternatively, normalized water indices based on the short-wave infrared MODIS bands were also tested as a vegetation water status indicator. In order to assess the results, two comparisons were made with other agricultural indices calculated at the Soil Moisture Measurement Stations Network of the University of Salamanca, REMEDHUS, where several drought indices have been previously tested (Martínez-Fernández et al., 2016; Martínez-(Martínez-Fernández et al., 2015; Sánchez et al., 2016; Scaini et al., 2015).
2. DATA AND METHODS 2.1 Imagery
The eight-day composite MYD09A1 surface reflectance product at 500 m and the 1 km resolution daily LST (product MYD11A1) were selected. LST day (1:30 P.M.) and LST night (1:30 A.M.) were considered separately. In order to spatially match both products, the LST at 1 km was assigned to the four pixels at the 500 m resolution. Regarding their different temporal interval, the daily MYD11A1 product was transformed into an eight-day product similar to the MYD09A1, using the average of the eight antecedent days. That calculation provided 46 composites for each year.
As a vegetation indicator in SMADI, four alternatives were tested. The rationale was in all cases a normalized index with the form (ρNIR-ρi)/(ρNIR+ρi), where ρi stands for the surface reflectance from bands 1, 5, 6 and 7 (648, 1240, 1640 and 2130 nm respectively) and ρNIR is the reflectance from band 2 (858 nm). Using band 1, the results is the well-known NDVI (Rouse et al., 1974), and using 5, 6 and 7 bands, the results are the so-called Normalized Difference Water Index (NDWI) (Gao, 1996).
For the soil moisture dataset, the SMOS Soil Moisture Level 2 User Data Product version 5.51 was used in this study, which is geolocated and projected into the Discrete Global Grid (DGG) with equally spaced nodes at ~15 km. Data was filtered (González-Zamora et al., 2015) and averaged into an eight antecedent-days composite, similarly to the LST product. Since the resulting SMOS surface soil moisture product is merged to the MODIS data, and they have different spatial resolution, each MODIS pixel at 500 m was allocated with its corresponding DGG.
2.2 Index fundamentals and calculation
Kogan (1990) developed the Vegetation Condition Index (VCI) as an indicator of environmental stress through the NDVI normalized with the maximum and minimum range for each pixel over the available imagery (1):
���= (�����−�������)
(�������−�������) (1)
where NDVIi is the eight day-smoothed NDVI, and NDVImin, NDVImax are the absolute five-year minimum and maximum NDVI respectively for each pixel. Note that also NDWI-1240, NDWI-1640 and NDWI-2130 were tested as an alternative of NDVI.
Kogan (1995) developed the Temperature Condition Index (TCI). Here we proposed a modified version of TCI (MTCI) for the whole period (2):
����= (����−������)
(������−������) (2)
where LSTi is the smoothed weekly temperature from satellite, and LSTmax and LSTmin the multi-year maximum and minimum, respectively.
SMCIi was defined similarly to the Soil Moisture Condition Index, similar to VCI and MTCI, i.e., a normalization of soil moisture values relative to the absolute maximum Surface Soil Moisture (SSMmax) and the absolute minimum (SSMmin) of the five-year series (3):
����= (������−����)
(������−������) (3)
Finally, the proposed agricultural drought index, SMADI, is based on the slope LST/NDVI, but using TCI and VCI instead of LST and NDVI, respectively (4), and the SMCI as a multiplicative factor. The normalization of these products avoids the site- and time-dependence of the series.
������=�������������+1� (4)
where i corresponds to a given eight-day period. Note that the VCI selected for a given i correspond to the ensuing eight-day period, in order to consider the time lag between the plant response and the soil moisture conditions. This lag is variable in the literature, varying between five to ten days (Li et al., 2014; Schnur et al., 2010). Here, a lag of eight days was considered, taking into account the time resolution of the MODIS-NDVI composite. A total of eight series of SMADI resulted from the different combinations of SMOS SMCI, MODIS MTCI day/night passes and the four VCIs resulting for the NDVI and the three NDWIs.
2.3 Testing at the REMEDHUS area
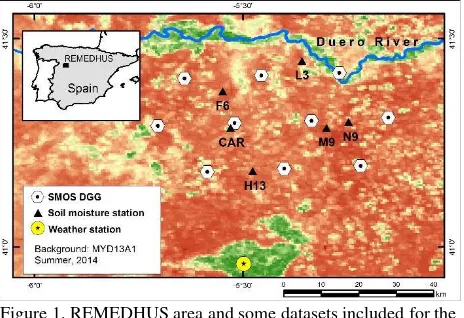
REMEDHUS is equipped with 20 soil moisture stations measuring at different soil depths, and four automatic weather stations. These stations are located within an area of 1300 km2 (41.1◦to 41.5◦N; 5.1◦to 5.7◦W) in a central semiarid sector of the Duero basin (Figure 1) in Spain. The topography of this area is gentle and the climate is continental semiarid Mediterranean. The main land use is rainfed cereals (Sánchez et al., 2012).
Figure 1. REMEDHUS area and some datasets included for the SMADI calculation. The image background is a MODIS-NDVI
product in August, 2014.
drought indicators were made using the REMEDHUS database. The chosen indices are totally independent from the remote sensing sources of SMADI. The Soil Water Deficit Index, SWDI (Martínez-Fernández et al., 2015) has shown good results to characterize the agricultural drought based on soil moisture series and basic soil water parameters (water content at field capacity and wilting point). For the comparisons, SWDI was calculated at eight-day rate at six REMEDHUS stations, and then area-averaged. Another agricultural drought index, the Crop Moisture Index (Palmer, 1968), was calculated based on the mean temperature, total precipitation and soil characteristics. While CMI needs long climatic series, the closest long-term weather station to REMEDHUS (Matacán, from the Spanish Meteorological Agency, AEMet) was used, which provided climatic series from more than 60 years (Figure 1). The assessment of SMADI was performed comparing the temporal evolution of each version of SMADI with SWDI at REMEDHUS (area-averaged) and with the CMI at the Matacán weather station (point-scale), using the Pearson correlation coefficient (R).
3. RESULTS AND DISCUSSION 3.1 MTCI, VCI and SMCI
The MTCI cycle showed a strong seasonality (Figure 2) and a very similar pattern between day and night passes, slightly variable for the night ones mostly during the cold periods. MTCI was higher in the summer, coinciding with hot and dry periods. There were not clear differences between the five years of study.
Figure 2. Temporal cycle of MTCI-day (a) and MTCI-night (b).
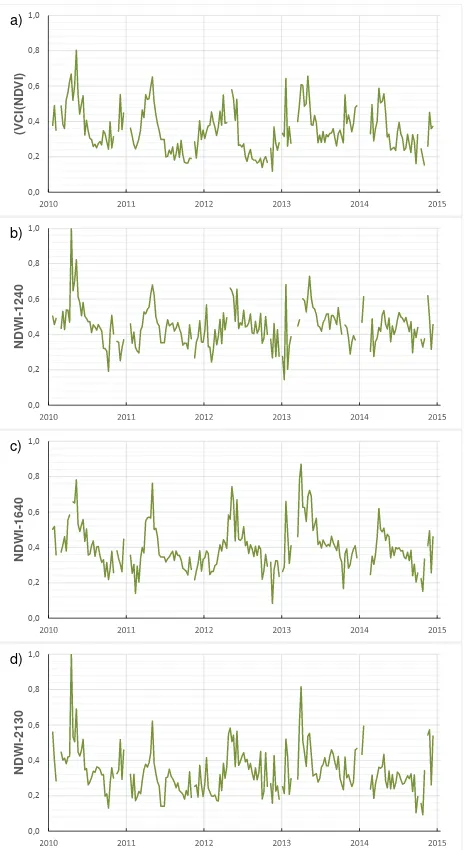
The four VCI versions (Figure 3) showed slightly differences between them, but it could be noticed a clearer seasonal pattern and a more stable curve for both the NDVI and NDWI-1640 versions of the VCI. Comparing the five years, it is difficult to track, as also occurred for the MTCI, different behaviours, but the VCI seemed slightly higher in 2010 and 2013. Note that the MTCI has maximum values during the growing season of the rainfed crops, i.e., late winter and spring.
Figure 3. Temporal cycle of VCI after the different alternatives NDVI (a), NDWI-1240 (b), NDWI-1640 (c) and NDWI-2130
(d).
The SMCI (Figure 4) showed higher values during the dry periods (summer season especially) and it is very influenced by the rainfall patterns, as expected. It should be highlighted that the SMCI was formulated in (4) as to afford higher values for dry conditions.
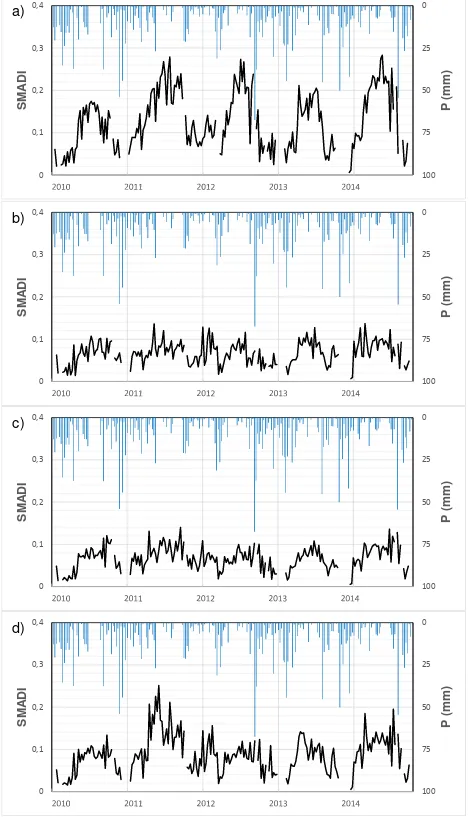
3.2 SMADI results and comparisons with SWDI and CMI SMADI (Figure 5, only the MTCI-day alternative was shown owing the similarity of the results with the MTCI-night) showed a dynamic range for the area of REMEDHUS from 0 to 0.3. The NDVI-derived SMADI shows the highest dynamic range, whereas NDWI-1240 and NDW-1640 the lesser (0 to 0.1). It can be suspected that these two alternatives lead to unrealistic values of SMADI owing their limited range. Indeed, if the annual cycles were compared, only NDVI and NDWI-2130 allow discriminating which years were the wettest (2010) and the driest (2011, 2012 and 2014, especially during the spring and summer). These results coincided with the overview of the European and Spanish drought observatories for this area and period (Sánchez et al., 2016).
Figure 5. SMADI results at REMEDHUS scale for (a) NDVI, (b) NDWI-1240, (c) NDWI-1640 and (d) NDWI-2130 versions.
Only MTCI-day alternative is shown.
The statistical comparison between SMADI and SWDI afforded statistically significant correlations ranging from -0.53 to -0.75 (Table 1). Note that the negative correlation is due to the different description of drought using SWDI (negative values indicate drought conditions) and SMADI (positive values indicate drought conditions). Figure 6 shows the time evolution of SWDI
vs. the SMADI-NDVI-LST day alternative (the case of highest correlations, similar to Figure 3a). SDWI showed a marked seasonality and reveal years 2011 and 2012 as the driest of the series.
R SMADI-NDVI SMADI-NDWI-1240 SMADI-NDWI-1640 SMADI-NDWI-2130
LST-day LST- night LST-day LST- night LST-day LST- night LST-day LST- night
SWDI -0.75 -0.72 -0.57 -0.53 -0.66 -0.60 -0.53 -0.53
CMI -0.71 -0.69 -0.44 -0.45 -0.33 -0.34 -0.36 -0.39
Table 1. Pearson coefficient (R) between SWDI, CMI and SMADI for the REMEDHUS area average. All the correlations
have a p-value<0.01.
Figure 6. Time evolution of SMADI (NDVI and LST day version) and SWDI at REMEDHUS.
As for the SWDI, CMI and SMADI showed a significant, inverse and good correlation, slightly smaller than for the SDWI, but equally showing the NDVI alternative as the best correlated (Table 1). The time evolution of CMI (Figure 7) pointed out only 2011 and 2012 as moderate dry years during the summer (CMI below -1).
Figure 7. Time evolution of SMADI (NDVI and LST day version) and CMI at REMEDHUS.
4. CONCLUSIONS
The proposed agricultural drought monitoring index SMADI merged the soil and temperature conditions while including the lagged response of vegetation. SMADI was based on MODIS LST and NDVI/NDWI, together with SMOS SSM, all of them normalized after the maximum and minimum values across the five years of the study. The results of SMADI afforded a good agreement with other agricultural indices in the area of REMEDHUS in Spain, such as the SWDI and CMI (R=-0.75 and -0.71 respectively). The assessment of drought conditions in the area along the period of study pointed out years 2011, 2012 and 2014 as the driest ones in the series, depicting a moderate drought during the spring-summer periods. Among the different alternatives of calculation, i.e., LST day/night and NDVI/NDWI, the NDVI seemed the best choice regarding the use of a vegetation proxy, whereas the use of day or night LST product provided similar results.
Further research should be done on the use of SMADI in other different climatic areas, as well as to determine the appropriate thresholds to best define drought conditions.
ACKNOWLEDGEMENTS
This study was supported by the Spanish Ministry of Economy and Competitiveness, MINECO (Project ESP2015-67549-C3-3) and the European Regional Development Fund, FEDER. Matacán data were provided by the Spanish Meteorological Agency, AEMet. SMOS data was provided by the European Space Agency (Project AO-3230). MODIS products were retrieved from the NASA EOSDIS Land Processes Distributed Active Archive Center (LP DAAC), USGS/Earth Resources Observation and Science (EROS) Center.
REFERENCES
Bayarjargal, Y., Karnieli, A., Bayasgalan, M., Khudulmur, S., Gandush, C., Tucker, C.J., 2006. A comparative study of NOAA–AVHRR derived drought indices using change vector analysis. Remote Sens. Environ., 105, pp. 9-22.
Bhuiyan, C., Singh, R.P., Kogan, F.N., 2006. Monitoring drought dynamics in the Aravalli region (India) using different indices based on ground and remote sensing data. Int. J. Appl. Earth Obs., 8, pp. 289-302.
Carlson, T., 2013. Triangle models and misconceptions. Int. J. Remote Sens. App., 3, pp. 155-158.
Chakrabarti, S., Bongiovanni, T., Judge, J., Zotarelli, L., Bayer, C., 2014. Assimilation of SMOS soil moisture for quantifying drought impacts on crop yield in agricultural regions. IEEE J. Sel. Top. Appl., 7, pp. 3867-3879.
Gao, B., 1996. NDWI-A Normalized Difference Water Index for remote sensing of vegetation liquid water from space. Remote Sens. Environ., 58, pp. 257-266.
Goetz, S.J., 1997. Multisensor analysis of NDVI, surface temperature and biophysical variables at a mixed grassland site. Int. J. Remote Sens., 18, pp. 71– 94.
González-Zamora, A., Sanchez, N., Martínez-Fernández, J., Gumuzzio, A., Piles, M., Olmedo, E., 2015. Long-term SMOS soil moisture products: a comprehensive evaluation across scales and methods in the Duero Basin (Spain). Phys. Chem. Earth, 83-84, pp. 123–136.
Hayes, M.J., Decker, W.L., 1998. Using satellite and real-time weather data to predict maize production. Int. J. Biometeorol., 42, pp. 10-15.
Karnieli, A., Agam, N., Pinker, R.T., Anderson, M., Imhoff, M.L., Gutman, G.G., Panov, N., Goldberg, A., 2010. Use of NDVI and land surface temperature for drought assessment: Merits and limitations. J. Clim., 23, pp. 618-633.
Kogan, F.N., 1990. Remote sensing of weather impacts on vegetation in nonhomogeneous areas. Int. J. Remote Sens., 11, pp. 1405−1419.
Kogan, F.N., 1995. Application of vegetation index and brightness temperature for drought detection. Adv. Space Res., 11, pp. 91−100.
Kogan, F.N., 1997. Global drought watch from space. B. Am. Meteorol. Soc., 78, pp. 621-636.
Li, R., Tsunekawa, A., Tsubo, M., 2014. Index-based assessment of agricultural drought in a semi-arid region of Inner Mongolia, China. Journal of Arid Land, 6, pp. 3-15.
Martínez-Fernández, J., González- Zamora, A., Sánchez, N., Gumuzzio, A., Herrero-Jiménez, C.M., 2016. Satellite soil moisture for agricultural drought monitoring: assessment of the SMOS derived SoilWater Deficit Index. Remote Sens. Environ., 177, pp. 277–286.
Martínez-Fernández, J., González-Zamora, A., Sánchez, N., Gumuzzio, A., 2015. A soil water based index as a suitable agricultural drought indicator. J. Hydrol., 522, pp. 265-273.
McKee, T.B., Doesken, N.J., Kleist, J., 1993. The relationship of drought frequency and duration of time scales, Eighth Conference on Applied Climatology. American Meteorological Society, Anaheim CA (USA), pp. 179-186.
McVicar, T.R., Bierwirth, P.N., 2001. Rapidly assessing 1997 drought in Papua New Guinea using composite AHVRR imagery. Int. J. Remote Sens., 22, pp. 2109-2128.
Palmer, W.C., 1965. Meteorological drought, in: Bureau, U.S.W. (Ed.). NOAA Library and Information Services Division 20852, Washington, D.C. (USA), p. 65.
Palmer, W.C., 1968. Keeping track of crop moisture conditions, nationwide: The new crop moisture index. Weatherwise, 21, pp. 156-161.
Rouse, J.W., Haas, R.H., Shell, J.A., Deering, D.W., Harlan, J.C., 1974. Monitoring the vernal advancement of retrogradation of natural vegetation. Final Report, Type III. NASA/GSFC, Greenbelt, MD, p. 371.
Sánchez, N., González-Zamora, Á., Piles, M., Martínez-Fernández, J., 2016. A new Soil Moisture Agricultural Drought Index (SMADI) integrating MODIS and SMOS products: a case of study over the Iberian Peninsula. Remote Sens., 8, pp. 287.
Sánchez, N., Martínez-Fernández, J., Scaini, A., Pérez-Gutiérrez, C., 2012. Validation of the SMOS L2 soil moisture data in the REMEDHUS network (Spain). IEEE Trans. Geosci. Remote Sens., 50, pp. 1602-1611.
Sandholt, I., Rasmussen, K., Andersen, J., 2002. A simple interpretation of the surface temperature/vegetation index space for assessment of surface moisture status. Remote Sens. Environ., 79, pp. 213-224.
Scaini, A., Sánchez, N., Vicente-Serrano, S.M., Martínez-Fernández, J., 2015. SMOS-derived soil moisture anomalies and drought indices: a comparative analysis using in situ measurements. Hydrol. Process., 29, pp. 373-383.
Schnur, M.T., Xie, H., Wang, X., 2010. Estimating root zone soil moisture at distant sites using MODIS NDVI and EVI in a semi-arid region of southwestern USA. Ecol. Inform., 5, pp. 400-409.
indices: summary and recommendations, in: Sivakumar, M.V.K., Motha, R.P., Wilhite, D.A., Wood, D.A. (Eds.), Agricultural drought indices. Proceedings of the WMO/UNISDR Expert Group Meeting on Agricultural Drought Indices. World Meteorological Organization, Geneva, Switzerland, pp. 172-197.
Sridhar, V., Hubbard, K.G., You, J., Hunt, E.D., 2008. Development of the soil moisture index to quantify agricultural drought and its user friendliness in severity-area duration assessment. J. Hydrometeorol, 9, pp. 660-676.
Tucker, C.J., Choudhury, B.J., 1987. Satellite remote sensing of drought conditions. Remote Sens. Environ., 23, pp. 243−251.