RELATIONSHIP BETWEEN HIMAWARI-8-DERIVED OVERSHOOTING TOPS AND
EXTREME WEATHER EVENTS IN SOUTHEAST ASIA
H. M. Park a, M. A. Kima, J. Ima *
a School of Urban and Environmental Engineering, Ulsan National Institute of Science and Technology (UNIST),
Ulsan, Republic of Korea - (hmpark, miakim, ersgis)@unist.ac.kr
Commission WG VII/4
KEY WORDS: Overshooting Tops, Precipitation, Infrared texture, Machine learning
ABSTRACT:
Severe weathers such as heavy rainfall, floods, strong wind, and lightning are closely related with the strong convection activities of atmosphere. Overshooting tops sometimes occur by deep convection above tropopause, penetrating into the lower stratosphere. Due to its high potential energy, the detection of OT is crucial to understand the climatic phenomena. Satellite images are useful to detect the dynamics of atmospheric conditions using cloud observation. This study used machine learning methods for extracting OTs. The reference cases were built using CloudSat, CALIPSO, and Numerical Weather Prediction (NWP) data with Himawari-8 imagery. As reference cases, 11 OT events were detected. The aim of this study is the investigation of relationship between OTs cases and the occurrences of heavy rainfall. For investigation of OT effects, TRMM daily rain rate data (mm/hr) were collected and averaged at 25 km intervals until 250km from the center of OT cases. As the result, precipitation rate clearly coincides with the distance from the center of OT occurrence.
* Corresponding author
1. INTRODUCTION
Strong convection of humid air makes thick and huge cloud unto the tropopause. Sometimes, deep convection penetrates into the lower stratosphere at the top layer of cumulonimbus, generating overshooting tops (OTs). Due to its mechanism of formation with high potential energy, OTs would be a key factor for explanation of extreme meteorological events such as heavy rainfall, strong wind, large hail and ground lightning (Bedka, 2010). The detection of OTs is crucial to predict the scale and location of severe weather conditions such as turbulences, lightning and thunderstorms. Spatial characteristics of OT occurrence were investigated using frequency analysis of OT location (Takahashi and Luo, 2014). The global warming may enhance the deep convective clouds and promote the severe weather issues as well. For these reasons, this study focused on investigating the relationship between the extreme weather conditions and OTs.
There are two widely used methods to detect OTs using multispectral images. One is a water vapour – infrared window channel brightness temperature difference (WV-IRW BTD) approach, which uses the difference between water vapour absorption at 6.2㎛ and brightness temperature at an infrared
channel about 10.4㎛ (Bedka, 2010). The other approach is an infrared window texture (IRW-texture) method based on the characteristics of OTs that appear as a group of pixels with low temperatures and it uses spatial gradients (i.e., texture) of brightness temperatures to identify pixel groups that are significantly colder than the surrounding anvil cloud pixels. The objectives of this study are 1) to detect OTs by using infrared satellite-based images with machine learning methods over the Southeast Asia region, and 2) to investigate the relationship
between OTs and the occurrences of lightning and heavy rainfall.
2. DATA AND METHODOLOGY
An infrared channel from Himawari-8 data of Japan Meteorological Agency (JMA) in August 2015 were used as an input image for OT detection. Machine learning techniques such as decision trees (DT) and random forest (RF) were used to construct OT detection models. CloudSat and the Cloud-Aerosol Lidar and Infrared Pathfinder Satellite Observations (CALIPSO), which measures OTs representing the vertical profiles of clouds (Mace et al., 2007), were used to find OT occurrence cases. Backscatter images with tropopause height of CALIPSO were examined based on visual inspection, and then vertical profiles of clouds from CloudSat data were used to confirm OTs. For OT and non-OT class regions, input variables were extracted from the infrared image including brightness temperature (TB), 10 minute before TB, local statistics such as mean and standard deviation at moving window size (MWS) of 5, 7, and 11, and the differences of TB from 10 min. before image at MWS of 1, 3, and 5.
The tropical rainfall measuring mission (TRMM), named 3b42v7, was chosen for investigation of the relationship between the heavy rainfall as a severe weather and the distances from the center of OT occurrence. TRMM measures the precipitation over tropical regions (from 60°S to 60°N) with spatial and temporal resolution of 25 km2 and daily, respectively (Alcala and Dessler, 2002). Rainfall values of TRMM daily rain rates (mm/hr) at a certain distance from the center of OT occurrence were averaged at 25 km intervals until 250km.
The International Archives of the Photogrammetry, Remote Sensing and Spatial Information Sciences, Volume XLI-B7, 2016 XXIII ISPRS Congress, 12–19 July 2016, Prague, Czech Republic
This contribution has been peer-reviewed.
3. RESULTS AND DISCUSSION
Test datasets were used to evaluate the performances of the three machine learning models for OT detection (Figure 1). As a result, both DT and models showed same performance to classify OT and nonOT classes with producer’s accuracy (PA; omission error) of 86.67% and 90% and user’s accuracy (UA; commission error) of 76.47% and 94.74%. Also, the DT and RF model showed same overall accuracy (OA) and kappa coefficient values. In overall, UA for OT class shows low values, meaning that the classification of OT class is not reliable for both models. It might be because there is no sufficient training dataset available.
Figure 1. Evaluation results including (a) producer’s accuracy, (b) user’s accuracy, and (c) overall accuracy and kappa coefficient with test datasets for decision trees and random forest.
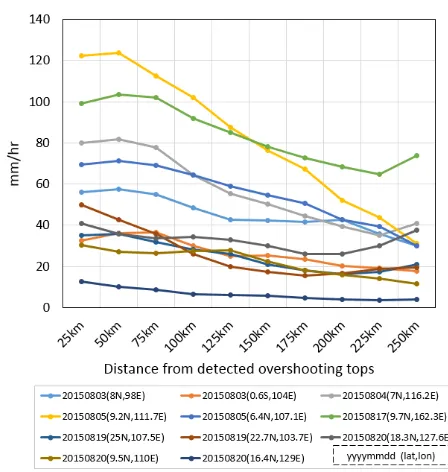
To investigate the relationship between OT occurrence and severe weather such as rainfall, OT cases identified by Himawari-8, CloudSat/CALIPSO, and NWP tropopause temperature with visual inspection over tropical Asia were used. A total of 11 OT cases were confirmed during August 2015. The information of locations and dates of OT cases is shown in Table 1. The changes in precipitation rates (mm/hr) with distance from the center of the OT cases were analysed (Figure 2). The radius was set from 25km to 250km with equal increasing ratio of 25km. As a result, the rainfall represented decreasing patterns with increasing distance from OTs for all the OT cases.
Table 1. Identified overshooting top cases by Himawari-8 images, CloudSat/CALIPSO data and NWP tropopause temperature with visual interpretation. from OTs was examined in August 2015 over southern-eastern Asia region. From 11 cases of detected OTs, the distance from OTs clearly corresponds to decrease of precipitation rates of TRMM 25km daily data. However, some cases showed that the trends are different from this tendency with increasing pattern with far distance. It may imply that rapid and accurate OT detection is crucial to represent the spatiotemporal variations of OT occurrences as occurred OTs can be moved with time. For further research, target duration will be expanded to annual level, and the validation of our established machine learning will be conducted over Asia region.
Figure 2. Precipitation distributions (mm/hr) at each radial distance from OTs based on TRMM 3b42.V7(25km, daily)
REFERENCES
Alcala, C. M., and Dessler, A. E., 2002. Observations of deep convection in the tropics using the Tropical Rainfall Measuring Mission (TRMM) precipitation radar. Journal of Geophysical Research: Atmospheres, 107(D24).
The International Archives of the Photogrammetry, Remote Sensing and Spatial Information Sciences, Volume XLI-B7, 2016 XXIII ISPRS Congress, 12–19 July 2016, Prague, Czech Republic
This contribution has been peer-reviewed.
Bedka, K., Brunner, J., Dworak, R., Feltz, W., Otkin, J., and Greenwald, T., 2010. Objective satellite-based detection of overshooting tops using infrared window channel brightness temperature gradients. Journal of Applied Meteorology and Climatology, 49(2), pp. 181-202.
Takahashi, H., and Luo, Z. J., 2014. Characterizing tropical overshooting deep convection from joint analysis of CloudSat and geostationary satellite observations. Journal of Geophysical Research: Atmospheres, 119(1), pp. 112-121.
Mace, G. G., Marchand, R., Zhang, Q., and Stephens, G., 2007. Global hydrometer occurrence as observed by CloudSat: Initial observations from summer 2006. Geophysical research letter, 34(9).
The International Archives of the Photogrammetry, Remote Sensing and Spatial Information Sciences, Volume XLI-B7, 2016 XXIII ISPRS Congress, 12–19 July 2016, Prague, Czech Republic
This contribution has been peer-reviewed.