INTEGRATING GEO-SPATIAL DATA FOR REGIONAL LANDSLIDE
SUSCEPTIBILITY MODELING IN CONSIDERATION OF RUN-OUT SIGNATURE
J. -S. Lai a, *, F. Tsai b, S. -H. Chiang c a
Dept. of Civil Engineering, National Central University, National Central University, No. 300, Zhong-Da Rd., Jhongli, Taoyuan, Taiwan 32001 – [email protected]
b
Center for Space and Remote Sensing Research, National Central University, No. 300, Zhong-Da Rd., Jhongli, Taoyuan, Taiwan 32001 - [email protected]
c
Center for Space and Remote Sensing Research, National Central University, No. 300, Zhong-Da Rd., Jhongli, Taoyuan, Taiwan 32001 - [email protected]
Commission VIII, WG VIII/1
KEY WORDS: Classification, Data Mining, Geo-Spatial Data, Landslide Susceptibility, Random Forests, Run-out, Typhoon
Morakot.
ABSTRACT:
This study implements a data mining-based algorithm, the random forests classifier, with geo-spatial data to construct a regional and rainfall-induced landslide susceptibility model. The developed model also takes account of landslide regions (source, non-occurrence and run-out signatures) from the original landslide inventory in order to increase the reliability of the susceptibility modelling. A total of ten causative factors were collected and used in this study, including aspect, curvature, elevation, slope, faults, geology, NDVI (Normalized Difference Vegetation Index), rivers, roads and soil data. Consequently, this study transforms the landslide inventory and vector-based causative factors into the pixel-based format in order to overlay with other raster data for constructing the random forests based model. This study also uses original and edited topographic data in the analysis to understand their impacts to the susceptibility modeling. Experimental results demonstrate that after identifying the run-out signatures, the overall accuracy and Kappa coefficient have been reached to be become more than 85 % and 0.8, respectively. In addition, correcting unreasonable topographic feature of the digital terrain model also produces more reliable modelling results.
1. INTRODUCTION
Typhoon Morakot made landfall in Taiwan on 8 August in 2009. The heavy rainfall induced catastrophic landslides as well as debris flows. The triggered hazards destroyed buildings, crops, civil infrastructures and other facilities, causing serious human casualties, properties and economic loss. Several studies have concentrated on detecting (e.g. Mondidi and Chang, 2014), characterizing (e.g. Tsai et al., 2010) and modelling (e.g. Chang et al., 2014) a catastrophic landslide event over Xiaolin (or Shiaolin, Hsiaolin) village and Kaoping watershed in southern Taiwan in order to prevent and mitigate similar disaster effects in the future.
Modelling landslide susceptibility is one of the fundamental and essential tasks in the related works. In this study, landslide susceptibility refers to the likelihood of landslide occurrence in an area with given local terrain attributes (Brabb, 1984) and the triggering factor (i.e. rainfall) is not taken into account (Dai et al., 2002). A review of the literature indicates that the continuing improvements in remote sensing and geographic information systems (GIS) have led to cooperate with statistical and data mining (or machine learning) models to evaluate the regional landslide susceptibility. In particular, GIS-based models with geo-spatial data (van Westen et al., 2008; Wang et al., 2005) and event-based landslide inventory (Guzzetti et al., 2012; Lee et al., 2008) have been emphasized and discussed in recent years. With increasing high spatial, spectral and temporal resolutions of remote sensing imageries, landslide areas can be
automatically or semi-automatically detected during a single triggering event using pixel-based (e.g. Mondidi and Chang, 2014) and object-oriented (e.g. Wang and Niu, 2009) strategies for generating landslide inventories. After that, event-based landslide susceptibility analysis can be conducted for further assessing landslide hazard, vulnerability and risk (Guzzetti et al., 2012).
There are three common features of typical natural terrain landslides from a geotechnical point of view. Source area is defined by a surface of rupture which comprises the main scarp and the scarp floor; landslide trail downslope of the source area is where landslide mass transport predominates, though erosion and deposition may also occur; depositions fan where the majority of the landslide mass is deposited (Dai and Lee, 2002). Another term, run-out, generally describes the downslope displacement of failed geo-materials from landslides (Mondini et al., 2011); it indicates the landslide trails and depositions in this study. In general, landslide area detected by automatic and semi-automatic algorithms from remotely sensed images might contain run-out area, unless removed by geologists or experts manually using stereo aerial photos or other auxiliary data. However, real landslides should exclude run-out area in a strict definition because the later are different mechanisms. It might reduce the reliability of a landslide susceptibility model constructed from impure training data.
The objective of this study is to implement a data mining based algorithm, the Random Forests (RF) classifier, with geo-spatial
* Corresponding author
data to construct a regional and rainfall-induced landslide susceptibility model, which takes account of landslide source, non-occurrence and run-out signatures according to a GIS-based landslide inventory of the study site generated after the Typhoon Morakot event.
2. STUDY AREA AND DATA
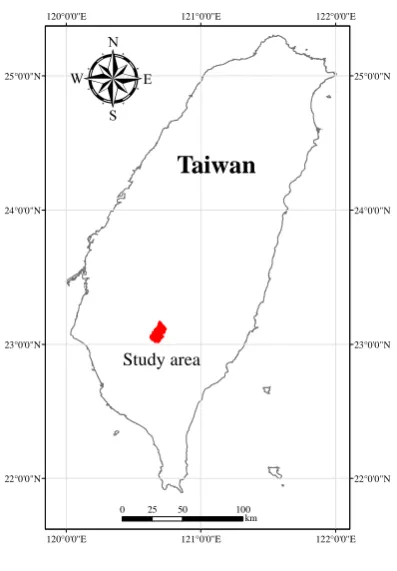
An area of 117 km2 of the Kaoping watershed in southern Taiwan is selected as the study site (Figure. 1). The elevation of the study site ranges from 258 to 1,666 m above sea level measured from DEM (Digital Elevation Model). In addition, the average slope and standard deviation are 25.84° and 11.98° respectively. According to the geological and soil maps published by the Central Geological Survey of Taiwan, there are three geological formations and four soil types covering the study area. The former contains Lushan, Sanhsia and Toukoshan formations. The four soil types include alluvium, colluviums, lithosol and loam soils.
Figure 1. Study site
A landslide inventory map generated after Typhoon Morakot was further interpreted manually to separate the source, run-out and channel classes according to stereo aerial photos and auxiliary data. This study also collected the faults, rivers, roads data and NDVI (Normalized Difference Vegetation Index) information derived from a pre-event Formosat-2 satellite image. Moreover, all line features and DEM are further analyzed to obtain the distances from each cell to the nearest line features (i.e. distance to fault, river and road) and other topographic data (i.e. aspect, curvature and slope). A total of ten causative factors are transferred into raster format as listed in Table 1. The grid size is 10 by 10 meters. In addition, the landslide inventory map is also converted into the grids format (10 by 10 meters) to match the corresponding causative factors for connecting environmental and landslide information to construct
susceptibility models. On the other hand, the edited DEM produced by Chiang et al. (2012) is also used to compare with the original DEM for examining the effect of topographic data.
Original data Used data (raster format) 10m-DEM (including Fault feature Distance to fault
Geology map Geology
River feature Distance to river
Road feature Distance to road
Satellite image NDVI
Soil map Soil
Table 1. The used landslide causative factors
3. METHODOLOGY
The Random Forests (RF) classifier (Breiman, 2001) is employed for constructing the landslide susceptibility model in this study. This is an extension of Decision Tree (DT) algorithm which is a classical and popular approach in the machine learning domain. The concept of both RF and DT classifiers is similar and both adopt the Information Gain (IG) measure to evaluate the degree of impurity of causative factors. The larger IG indicates that the corresponding causative factor should be selected in a higher priority to construct a conditional node and ignore this factor in next computation. After several iterations, a tree model, which comprises a sequence of "If-Then" rules, is extracted to classify other instances. The difference between the random forests and decision tree algorithm is that the former randomly separates training data into many subsets to build many trees (so called the forest) and optimize them.
In general, nominal (or discrete) and numeric (or continuous) data are two major geo-spatial data formats. For the nominal data, the information gain is computed by the entropy calculation as described in Eqs. (1)-(3), where E(A) indicates the entropy of all training data; m is the number of classes; n and N are subset and total amounts in the decision attribute (i.e. label or class), respectively; E'(a) and v represent the entropy and subset amounts individually of a specific causative factor; E(aj) is the entropy of the subset in a specific causative factor computed by Eq. (1); IG(a) indicates the information gain of a specific causative factor. For numeric data, the Gini index is utilized to calculate the information gain measure as described in Eqs. (4) and (5), where C represents a segmented point for a specific causative factor to divide numeric data into two parts; N1 and N2 are the numbers of a≦C and a>C, respectively. This study performs the RF classification as well as the accuracy
assessment using the WEKA software
(http://www.cs.waikato.ac.nz/ml/weka/) which is a free and open-source platform.
Two thirds of the samples are selected as training data to build the landslide susceptibility model and the remainders are reserved as check data to verify the model. After that, the classified results are quantitatively evaluated against the check data based on Overall Accuracy (OA), Kappa coefficient, Producer's Accuracy (PA) and User's Accuracy (PA) indexes computed from a confusion matrix. The landslide susceptibility map can be generated pixel by pixel according to the landslide’s probability obtained from the constructed model as long as the verification result is acceptable.
4. RESULTS
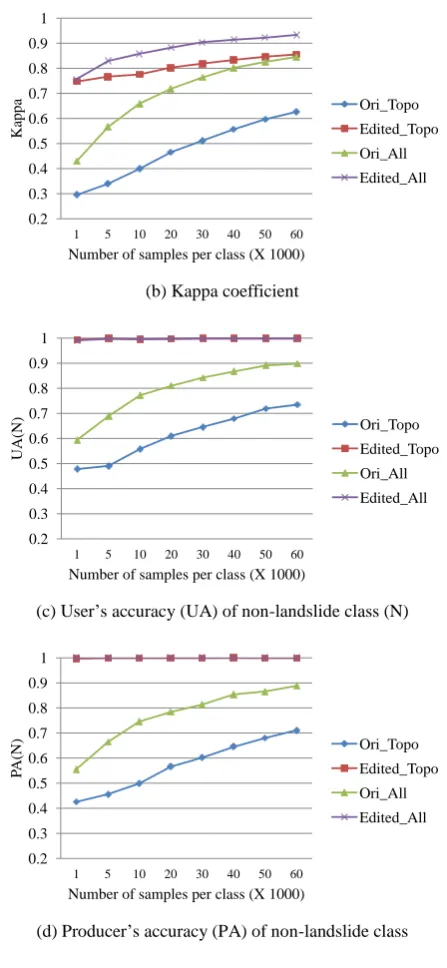
Based on the algorithm and procedure mentioned in the previous section, the constructed models are verified by the classification-based indexes derived from confusion matrices. Figure 2 shows the evaluations of landslide susceptibility models considering different numbers of samples, using original and edited DEM as well as topographic (i.e. aspect, curvature, elevation and slope) and all causative factors, respectively. It is obvious that the edited DEM provides great improvement of classification results, especially the non-landslide class (Figure 2a and 2b). In addition, using all landslide causative factors can reach higher accuracies than topographic data only. It is also noted that the performance difference between both is reduced while using the edited DEM and derived data, further demonstrating the effect of topographic data. Chiang et al. (2012) mentioned that the original DEM contained surface irregularities caused by isolated tree heights and discontinuous streams. These irregularities could affect calculations of slope gradient and upstream contributing area. Therefore, Chiang et al. (2012) manually edited the original DEM according to the hillslope and slope maps. It is clear that the results mentioned above comply with the opinion of Chiang et al. (2012) and also prove the significance of topographic data on landslide susceptibility modeling. Figure 2g and 2h also demonstrate that the run-out signature has an important impact in the models.
(a) Overall accuracy (OA)
(b) Kappa coefficient
(c) User’s accuracy (UA) of non-landslide class (N)
(d) Producer’s accuracy (PA) of non-landslide class
(e) User’s accuracy of landslide source class (L) 50
Number of samples per class (X 1000)
Ori_Topo
Number of samples per class (X 1000)
Ori_Topo
Number of samples per class (X 1000)
Ori_Topo
Number of samples per class (X 1000)
Ori_Topo
Number of samples per class (X 1000)
Ori_Topo
Edited_Topo
Ori_All
Edited_All
(f) Producer’s accuracy of landslide source class
(g) User’s accuracy of run-out class (R)
(h) Producer’s accuracy of run-out class Figure 2. Evaluations of classification-based landslide susceptibility models considering different number of samples,
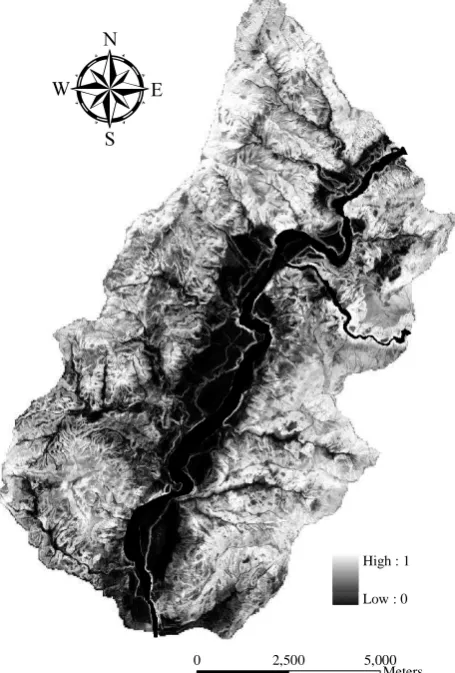
using original (Ori) and edited (Edited) DEM as well as topographic (Topo) and all (All) causative factors, respectively. To evaluate classifier’s performance, this study compares the best result of random forests with decision tree algorithm using all landslide causative factors. In addition, the topographic data derived from original and edited DEMs are also considered. Figure 3 shows that random forests algorithm outperforms the decision tree classifier. It is also noted that the performance difference between both algorithms is reduced while using the edited DEM and derived data, suggesting the significance of topographic data. The landslide susceptibility map produced from the developed model is shown in Figure 4. Based on this map, future researches may further include other information to achieve landslide hazard and risk assessment and management as well as to assist land planning and policy marking.
Figure 3. Comparing the best performance of Random Forests (RF) with Decision Tree (DT) using all landslide causative factors that the topographic data derived from original (Ori) and
edited (Edited) DEMs are considered, respectively.
Figure 4. The preliminary landslide susceptibility map
5. CONCLUSION
This study constructed a regional landslide susceptibility model using geo-spatial data in consideration of source, run-out and non-occurrence landslide classes. A random forests based model was developed and verified. Moreover, this study also considered and compared the effect of different numbers of samples as well as original and edited topographic data on regional landslide susceptibility modeling. To evaluate the classifier’s performance, Random Forests was also compared with a classical algorithm, decision tree.
Experimental results indicate that after identifying run-out signature from the landslide inventory, the overall accuracy and 0.2
Number of samples per class (X 1000)
Ori_Topo
Number of samples per class (X 1000)
Ori_Topo
Number of samples per class (X 1000)
Ori_Topo
Kappa coefficient are reached to be approximately more than 85 % and 0.8, respectively. Furthermore, topographic data are proved to be a significant factor on landslide susceptibility modeling. The results also demonstrate that random forests algorithm outperforms decision tree classifier. Finally, according to the modeling results, a preliminary landslide susceptibility map of the study site is produced. Future works could explore the effect of other sampling strategies, and extend the preliminary landslide susceptibility map for further landslide hazard and risk assessment management as well as land planning and policy-making.
REFERENCES
Brabb, E. E., 1984. Innovative approaches to landslide hazard mapping. The 4th International Symposium on Landslides, 16-21 September, Toronto, Canada, pp. 307-324.
Breiman, L., 2001. Random forests. Mach. Learn., 45, pp. 5-32, 2001.
Chang, K. -T., Chiang, S. -H., Chen, Y. -C., Mondini, A. C., 2014. Modeling the spatial occurrence of shallow landslides triggered by typhoons. Geomorphology, 208, pp. 137-148. Chiang, S. -H., Chang, K. -T., Mondini, A. C., Tsai, B. -W., Chen, C. -Y., 2012. Simulation of event-based landslides and debris flows at watershed level. Geomorphology, 138, pp. 306-318.
Dai, F. C., Lee, C. F., 2002. Landslide characteristics and slope instability modeling using GIS, Lantau Island, Hong Kong. Geomorphology, 42, pp. 213-228.
Dai, F. C., Lee, C. F., Ngai, Y. Y., 2002. Landslide risk assessment and management: an overview. Eng. Geol., 64, pp. 65-87.
Guzzetti, F., Mondini, A. C., Cardinali, M., Fiorucci, F., Santangelo, M., Chang, K. T., 2012. Landslide inventory maps: new tools for an old problem. Earth-Sci. Rev., 112, pp. 42-66. Lee, C. -T., Huang, C. -C., Lee, J. -F., Pan, K. -L., Lin, M. -L., Dong, J. J., 2008. Statistical approach to storm event-induced landslide susceptibility. Nat. Hazards Earth Syst. Sci., 8, pp. 941-960.
Mondini, A. C., Chang, K. -T., 2014. Combing spectral and geoenvironmental information for probabilistic event landslide mapping. Geomorphology, 213, pp. 183-189.
Mondini, A. C., Chang, K. -T., Yin, H. -Y., 2011. Combing multiple change detection indices for mapping landslides triggered by typhoons. Geomorphology, 134, pp. 440-451. Tsai, F., Hwang, J. -H., Chen, L. -C., Lin, T. -H., 2010. Post-disaster assessment of landslides in southern Taiwan after 2009 Typhoon Morakot using remote sensing and spatial analysis. Nat. Hazards Earth Syst. Sci., 10, pp. 2179-2190.
van Westen, C. J., Castellanos, E., Kuriakose, S. L., 2008. Spatial data for landslide susceptibility, hazard, and vulnerability assessment: an overview. Eng. Geol., 102, pp. 112-131.
Wang, H., Liu, Gangjun, Weiya, X., Wang, G., 2005. GIS-based landslide hazard assessment: an overview. Prog. Phys. Geog., 29(4), pp. 548-567.
Wang, X., Niu, R., 2010. Landslide intelligent prediction using object-oriented method. Soil Dyn. Earthq. Eng., 30, pp. 1478-1486.