RESPONSE OF RIPARIAN VEGETATION IN AUSTRALIA’S LARGEST RIVER BASIN
TO INTER AND INTRA-ANNUAL CLIMATE VARIABILITY AND FLOODING AS
QUANTIFIED WITH LANDSAT AND MODIS
M. Broich a *, M.G. Tulbure a
a
School of Biological, Earth and Environmental Science, University of New South Wales, Sydney, Australia – [email protected]
Commission TeS: WG VIII/7VI, WG VI/4
KEY WORDS: riparian vegetation, flooding, river basin, climate variability
ABSTRACT:
Australia is a continent subject to high rainfall variability, which has major influences on runoff and vegetation dynamics. However, the resulting spatial-temporal pattern of flooding and its influence on riparian vegetation has not been quantified in a spatially explicit way. Here we focused on the floodplains of the entire Murray-Darling Basin (MDB), an area that covers over 1M km^2, as a case study. The MDB is the country’s primary agricultural area with scarce water resources subject to competing demands and impacted by climate change and more recently by the Millennium Drought (1999-2009). Riparian vegetation in the MDB floodplain suffered extensive decline providing a dramatic degradation of riparian vegetation.
We quantified the spatial-temporal impact of rainfall, temperature and flooding patters on vegetation dynamics at the sub- continental to local scales and across inter to intra-annual time scales based on three decades of Landsat (25k images), Bureau of Meteorology data and one decade of MODIS data.
Vegetation response varied in space and time and with vegetation types, densities and location relative to areas frequently flooded. Vegetation degradation trends were observed over riparian forests and woodlands in areas where flooding regimes have changed to less frequent and smaller inundation extents. Conversely, herbaceous vegetation phenology followed primarily a ‘boom’ and ‘bust’ cycle, related to inter-annual rainfall variability. Spatial patters of vegetation degradation changed along the N-S rainfall gradient but flooding regimes and vegetation degradation patterns also varied at finer scale, highlighting the importance of a spatially explicit, internally consistent analysis and setting the stage for investigating further cross-scale relationships.
Results are of interest for land and water management decisions. The approach developed here can be applied to other areas globally such as the Nile river basin and Okavango River delta in Africa or the Mekong River Basin in Southeast Asia.
1. MANUSCRIPT
Australia is a continent subject to high rainfall variability, which has major influences on runoff and vegetation dynamics. However, the resulting spatial-temporal pattern of flooding and its influence on riparian vegetation has not been quantified in a spatially explicit way. Here we focused on the floodplains of the entire Murray-Darling Basin (MDB), an area that covers over 1M km^2, as a case study. The MDB is the country’s primary agricultural area with scarce water resources subject to competing demands and impacted by climate change and more recently by the Millennium Drought (1999-2009). Riparian vegetation in the MDB floodplain suffered extensive decline providing a dramatic degradation of riparian vegetation.
We quantified the spatial-temporal impact of rainfall,
temperature and flooding patters on vegetation dynamics at the sub- continental to local scales and across inter to intra-annual time scales based on three decades of Landsat (25k images), Bureau of Meteorology data and one decade of MODIS data.
Vegetation response varied in space and time and with vegetation types, densities and location relative to areas frequently flooded. Vegetation degradation trends were
observed over riparian forests and woodlands in areas where flooding regimes have changed to less frequent and smaller inundation extents. Conversely, herbaceous vegetation
phenology followed primarily a ‘boom’ and ‘bust’ cycle, related to inter-annual rainfall variability. Spatial patters of vegetation degradation changed along the N-S rainfall gradient but flooding regimes and vegetation degradation patterns also varied at finer scale, highlighting the importance of a spatially explicit, internally consistent analysis and setting the stage for investigating further cross-scale relationships.
Results are of interest for land and water management decisions. The approach developed here can be applied to other areas globally such as the Nile river basin and Okavango River delta in Africa or the Mekong River Basin in Southeast Asia.
The International Archives of the Photogrammetry, Remote Sensing and Spatial Information Sciences, Volume XLI-B8, 2016 XXIII ISPRS Congress, 12–19 July 2016, Prague, Czech Republic
This contribution has been peer-reviewed.
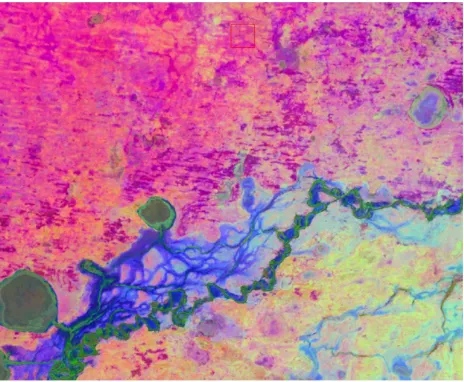
Figure 1. First three principle component of seasonal EVI standardized anomalies 1986-2011 on RGB showing contrasting vegetation response pattern over different dryland
areas and floodplain units and lakes
REFERENCES
Tulbure, M. G., M. Broich, S.V. Stehman, A. Kommareddy. (2016). Surface water extent dynamics from three decades of seasonally continuous Landsat time series at subcontinental scale in a semi-arid region. Remote Sensing of Environment.
Broich M., A. Huete, M. Paget, X. Ma, R. Devadas, N. Restrepo-Coupe, K. Davies, A. Held. (2015). A spatially explicit Land Surface Phenology data product for science, monitoring and natural resources management applications. Environmental Modelling & Software.
Broich M., A. Huete, M.G. Tulbure, X. Ma, Q. Xin, M. Paget, N. Restrepo-Coupe, K. Davies, R. Devadas, A. Held. Land surface phenological response to decadal climate variability across Australia using satellite remote sensing (2014). Biogeosciences Special Issue on Climate Extremes and Biogeochemical Cycles in the Terrestrial Biosphere: Impacts and Feedbacks Across Scales.
M.G. Tulbure and M. Broich. (2013). Spatiotemporal dynamic of surface water bodies using Landsat time-series data from 1999 to 2011. ISPRS Journal of Photogrammetry and Remote Sensing.
The International Archives of the Photogrammetry, Remote Sensing and Spatial Information Sciences, Volume XLI-B8, 2016 XXIII ISPRS Congress, 12–19 July 2016, Prague, Czech Republic
This contribution has been peer-reviewed.