MINERALOGICAL MAPPING IN THE PART OF A GOLD PROSPECT USING EO-1
HYPERION DATA
Vivek K. Sengara *, A. S. Venkateshb, P. K. Champaty Raya, Shovan Lal Chattoraja, Richa U Sharmaa
aIndian Institute of Remote Sensing, Dehradun - 248 001, India- (viveksengar) @iirs. gov. in bIndian School of Mines, Dhanbad, Jharkhand - 826004, India
Commission VI, WG VI/4
KEY WORDS: EO-1Hyperion data, Mineral end member extraction, SAM classification, Spectra matching.
ABSTRACT:
The satellite data obtained from various airborne as well as space-borne Hyperspectral sensors, often termed as imaging spectrometers, have great potential to map the mineral abundant regions. Narrow contiguous bands with high spectral resolution of imaging spectrometers provide continuous reflectance spectra for different Earth surface materials. Detailed analysis of resultant reflectance spectra, derived through processing of hyperspectral data, helps in identification of minerals on the basis of their reflectance characteristics. EO-1 Hyperion sensor contains 196 unique channels out of 242 bands (L1R product) covering 0.4-2.5 µm range has also been proved significant in the field of spaceborne mineral potential mapping.
Present study involves the processing of EO-1 Hyperion image to extract the mineral end members for a part of a gold prospect region. Mineral map has been generated using spectral angle mapper (SAM) method of image classification while spectral matching has been done using spectral analyst tool in ENVI. Resultant end members found in this study belong to the group of minerals constituting the rocks serving as host for the gold mineralisation in the study area.
1. INTRODUCTION
In Bhukia, Rajasthan, many ancient mines were earlier explored for base metals (Grover et al., 1993). Shallow depth (varying from 50m to 300m) of mineralization and presence of disseminated, veins and stockworks patterns of sulphide mineral assemblage suggest the epithermal origin of this prospect (Grover et al., 1994). Gossans, old workings, and mineral stains are the surficial manifestation of mineralisation beneath. In recent times Geological Survey of India (1993-2000), Hindustan Zinc limited (1998-2003), Indo Gold Limited (2005-2008) and Mineral Exploration Corporation Limited (2008) has actively explored this area in search of precious yellow metal. Advanced remote sensing techniques (e.g., multi and hyperspectral), have potential to discriminate the variety of materials present on the surface of the Earth. Rajasthan is sparsely vegetated due to arid or semi arid climatic conditions, inviting a wide range of remotely sensed datasets which is incorporated in mineral exploration practices. In this study EO-1 Hyperion image has been processed to map the altered minerals (e.g., clays and micas), which are abundantly present in Bhukia gold prospect region. The Hyperion sensor has potential to detect several minerals viz. clays (illte, montmorillonite, kaolinite and alunite), carbonates (calcite, dolomite), oxides (goethite, hematite and jarosite), chlorites etc (Magendrum and Sanjeevi, 2013). Hyperspectral data contains a complete spectral pattern for each pixel, which enables the user in material discrimination and classification at an enhanced scale (Zadeh et al., 2013). Most of the minerals show unique spectral signatures for particular wavelength regions, which are minutely analysed to distinguish among a variety of minerals (Hunt, 1977; Kruse et al., 2006).
* Corresponding author. (email: [email protected])
2. STUDY AREA
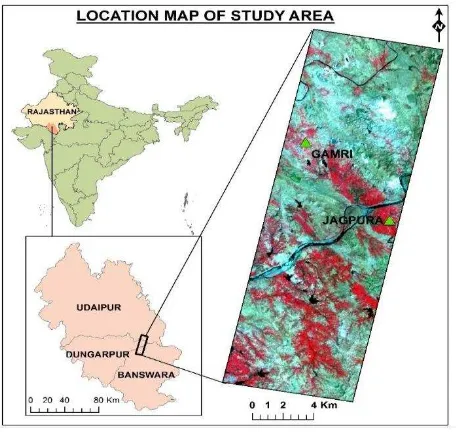
Study area is located around 40km Southeast of Salumber and 20km NW of Ghatol town, partly covering Udaipur, Dungarpur, and Banswara districts in Southeastern Rajasthan.
Figure 1. Location of study area displaying the Hyperion image taken for this study
Longitudes 73018’ 03.71”: 74019’ 31.38” and Latitude 23045’
01.17”: 24000’02.62” restrict the area of study, which falls in the The International Archives of the Photogrammetry, Remote Sensing and Spatial Information Sciences, Volume XLI-B7, 2016
XXIII ISPRS Congress, 12–19 July 2016, Prague, Czech Republic
This contribution has been peer-reviewed.
Survey of India toposheet No. 46 I/5. Location is easily accessible and well connected with district Head quarter Banswara (45 km South) and Udaipur (100 km Northwest).
2.1 Geological Setting
Southeastern Rajasthan is mainly occupied by the Aravalli Supergroup, chiefly comprising of metamorphosed and complexly folded rocks, unconformably resting over the Archean basement, the Banded Gneissic Complex (Heron, 1953). Contact between lowermost part of Aravalli Supergroup (Delwara Group) and BGC, hosts the gold-sulphide mineralization in this area (Deol et al., 2014) and is evident by primary gold occurrence with sulphides (Golani et al., 1999). Major lithounits exposed in this region are biotite-muscovite-quartz schist, dolomitic marble, keratophyre, quartzite, and amphibolite, intruded by a number of pegmatite and granitic bodies.
3. METHODOLOGY
Figure 2. Flowchart depicting the methodology adopted for this study
3.1 Data Used
The EO-1 Hyperion image (path/row: 147/43) acquired on March 08, 2013, was taken for this study. Processing was done using ENVI 5.0 while Arc Map 10.2.1 was used for creation of GIS layers and map composition. In laboratory, spectra of rock samples, collected from field, were generated using Analytical Spectral Device (ASD) fieldspec4 instrument and analysed in Spectral Analyst tool of ENVI. Lithology map of study area was compiled referring 1:50,000 scale Geological map issued by Geological Survey of India, Western region under Geological map series.
3.2 Data Processing
The level-1 radiometrically corrected Hyperion image was preprocessed to remove no data bands also, low value columns existing due to poor response of few detectors of hyperion sensor were corrected. Atmospheric correction of preprocessed image was done using Fast Line-of-Sight Analysis of Spectral Hypercubes (FLAASH) module. This tool was used to convert radiance in to apparent reflectance values, which also supresses atmosoheric effects partially. Minimum Noise Fraction (MNF) transformation was applied to determine the inherent data dimensionality and isolation of the noises, followed by Pixel Purity Index (PPI) and n-D visualisation to identify the purest pixels (classes) and end members extraction respectively. The
endmembers were matched with USGS spectral library (Clark et al., 2007). Finally, all the spectra were resampled to the wavelength scale of image for further analysis. Later on Spectral Angle Mapper algorithm (SAM) was used to classify the image.
4. RESULTS AND DISCUSSION
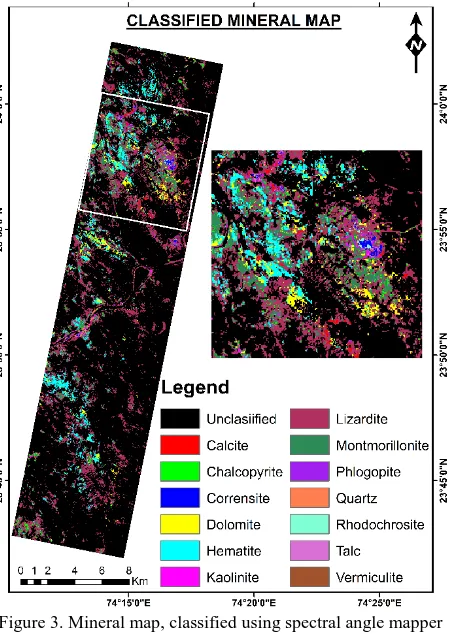
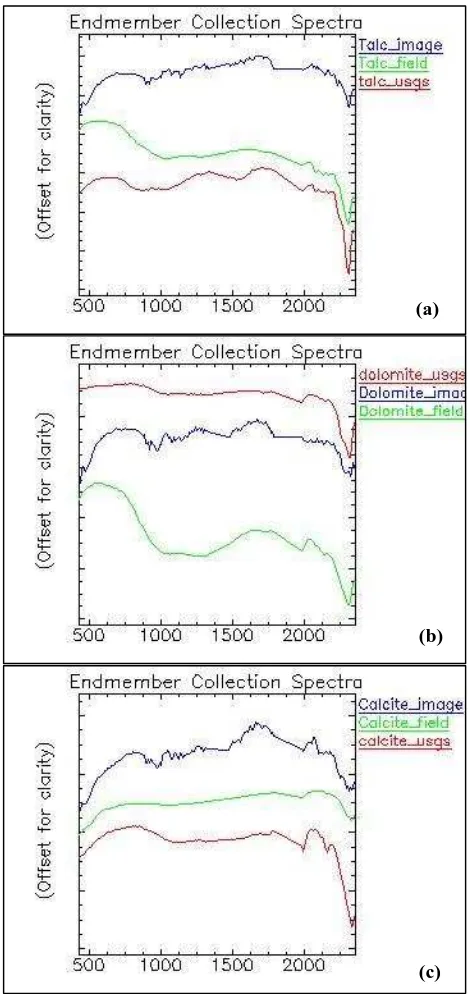
Thirteen end members viz. calcite, chalcopyrite, corrensite, dolomite, hematite, kolinite, lizardite, montmorillonite, phlogopite, quartz, rhodochrosite, talc and vermiculite were extracted through hyperion image processing (Figure 3) which depicts the presensce of hydrothermal alterations in the study area. In Figure 4 (a), (b) & (c) talc, dolomite and calcite rock types were validated by matching Image spectra with respect to field base spectra as well as USGS mineral library spectra. A good correlation has been seen among spectra obtained from different sources.
Figure 3. Mineral map, classified using spectral angle mapper (SAM) algorithm
The presence of significant amount of quartz and calcite mapped in the scene, may consider as the main gangue minerals occurring in Bhukia region, which are evident of the vein-type origin of this deposit. Small amount of chalcopyrite mapped in the study area is evident of the occurance of sulphides in this region. Sulphides are closely associated with this deposit as it hosts the primary gold. Apart from above mentioned minerals various clay minerals (e.g., kaolinite, corrensite, montmorillonite, vermiculite and lizardite) have also been mapped, which play important role in demarcation of zones of alterations developed around the ore body. Kaolinite seen in this area is a secondary clay mineral formed by hydrothermal alteration of alkali feldspars and is evident of acidic intrusion in the region. Phlogopite found in the study area belongs to the family of magnesian mica mineral which is mainly found in The International Archives of the Photogrammetry, Remote Sensing and Spatial Information Sciences, Volume XLI-B7, 2016
XXIII ISPRS Congress, 12–19 July 2016, Prague, Czech Republic
This contribution has been peer-reviewed.
metamorphosed magnesian limestones (e.g. dolomitic marbles). Which is one of the important host rock in this region.
Figure 4. Validation of end members (a) matched spectral signatures of dolomite (b) matched spectral signatures of talc (c)
matched spectral signatures of calcite.
Vermiculite seen in this area is a group of micaceous clay minerals occur as the hydrothermal altertion product of phlogopite and biotite. Corrensite is an alumiosilicate of Fe & Mg, found associated with talc, phlogopite and smectite group. Hematite seen in this area occurs as an oxidation product (e.g., gossans) in the hydrothermal alteration zones and is common in vein-type hydrothermal deposits.
In Bhukia area host rock alteration is characterised by developement of carbonates, amphiboles along with tourmalinisation, serecitisation and silicification (Grover et al., 1994). In this study considerable quantity of calcite and dolomite
has been mapped which strongly supports the alteration of host rocks in the region.
The Minerals mapped during this study are significant and well associated with the hydrothermal (vein-type) deposit of Bhukia prospect.
5. CONCLUSION
Hyperspectral data acquired by EO-1 hyperion sensor proved resourseful to carry out the mineral mapping as many significant altered minerals were identified in this area, which are of utmost importance to demarcate the hydrothermal alteration zones guiding to the target ore. The advancements of hyperspectral sensor techniques intensified the exploartion practices in a great way. Limited area coverage and non-availability of temporal data often limits the applicability of hyperion image in detailed mineralogical mapping.
REFERENCES
Clark, R. N., Swayze, G. A., Wise, R., Livo, E., Hoefen, T., Kokaly, R., and Sutley, S. J., 2007. USGS digital spectral library splib06a: U.S. Geological Survey, Digital Data Series 231.
Deol, S., Chattopadhyay, A., and Deb, M., 2014. Deformation and metamorphism of gold sulphide lodes in the Bhukia-Jagpura gold prospect, Rajasthan: Implications for ore genesis. Journal of Earth System Sciences 123, No. 1, pp. 1-13.
Geological Survey of India, 2001. Geology and mineral resources of Rajasthan, Miscellaneous Publication 30, part 12, 3rd revised edition, pp. 6-17.
Golani, P. R., Rajawat, R. S., Pant, N. C., and Rao, M. S., 1999. Mineralogy of gold and associated alloys in sulphides of Bhukia gold prospect in Southeastern Rajasthan, Western India. Journal of Geological Society of India 54, issue 2, pp. 121-128.
Grover, A. K., and Verma, R. G., 1993. Gold mineralisation in the precambrians (Bhukia Area) of Rajasthan- A new discovery, Jouranal of Geological Society of India 42, Issue 3, pp. 281-288
Grover, A. K., and Verma, R. G., 1994. Report on exploration of Bhukia gold prospect, Banswara district, Rajasthan.
Heron, A. M., 1953. The Geology of Central Rajputana, Mem. Geol. Surv. Ind. 79, pp 1-389.
Hunt, G. R. 1977. Spectral signatures of particulate minerals in the visible and near infrared. Geophysics 42, pp. 501-513.
Kruse, F. A., Perry, S. L., and Caballero, A., 2006. District level mineral survey using airborne Hyperspectral data, Los Menucos, Argentina. Annals of Geophysics 49, N. 1, pp. 83-92.
Magendran, T., and Sanjeevi, S., 2013. Hyperion image analysis and linear spectral unmixing to evaluate the grades of iron ores in the part of Noamundi, Eastern India. International Journal of Applied Earth Observation and Geoinformation 27, pp. 117-127.
Zadeh, M. H., Tangestani, M. H., Roldan, F. V., and Yusta, I., 2013. Sub-pixel mineral mapping of a porphyry copper belt using EO-1 Hyperion data. Advances in Space Research 53, pp. 440-451.
(a)
(b)
(c)
The International Archives of the Photogrammetry, Remote Sensing and Spatial Information Sciences, Volume XLI-B7, 2016 XXIII ISPRS Congress, 12–19 July 2016, Prague, Czech Republic
This contribution has been peer-reviewed.