EVALUATION OF VARIOUS SPECTRAL INPUTS FOR ESTIMATION OF FOREST
BIOCHEMICAL AND STRUCTURAL PROPERTIES FROM AIRBORNE IMAGING
SPECTROSCOPY DATA
L. Homolová a, *, R. Janoutová a, Z. Malenovský b a
Global Change Research Institute CAS, 603 00 Brno, Czech Republic - (homolova.l, janoutova.r)@czechglobe.cz bUniversities Space Research Association, NASA Goddard Space Flight Centre, Greenbelt, Maryland, U.S–
KEY WORDS: Airborne imaging spectroscopy, DART, Chlorophyll content, Continuum removal, Leaf area index, Forest, Support vector regression, Radiative transfer modelling
ABSTRACT:
In this study we evaluated various spectral inputs for retrieval of forest chlorophyll content (Cab) and leaf area index (LAI) from high spectral and spatial resolution airborne imaging spectroscopy data collected for two forest study sites in the Czech Republic (beech forest at Štítná nad Vláří and spruce forest at Bílý Kříž). The retrieval algorithm was based on a machine learning method – support vector regression (SVR). Performance of the four spectral inputs used to train SVR was evaluated: a) all available hyperspectral bands, b) continuum removal (CR) 645 – 710 nm, c) CR 705 – 780 nm, and d) CR 680 – 800 nm. Spectral inputs and corresponding SVR models were first assessed at the level of spectral databases simulated by combined leaf-canopy radiative transfer models PROSPECT and DART. At this stage, SVR models using all spectral inputs provided good performance (RMSE for Cab < 10 µg cm-2 and for LAI < 1.5), with consistently better performance for beech over spruce site. Since application of trained SVRs on airborne hyperspectral images of the spruce site produced unacceptably overestimated values, only the beech site results were analysed. The best performance for the Cab estimation was found for CR bands in range of 645 – 710 nm, whereas CR bands in range of 680 – 800 nm were the most suitable for LAI retrieval. The CR transformation reduced the across-track bidirectional reflectance effect present in airborne images due to large sensor field of view.
* Corresponding author
1. INTRODUCTION
Leaf chlorophyll content (Cab) and canopy leaf area index (LAI) are important plant functional traits that reflect on actual ecophyisiological and phenological status of vegetation and can be retrieved from remotely sensed reflectance (Darvishzadeh et al., 2008; le Maire et al, 2008; Sampson et al., 2003; Verrelst et al., 2012). Widely used empirical retrieval methods based on, for instance vegetation indices, are unstable when applied to another remote sensing (RS) images and/or vegetation types other than those originally established for (Colombo et al, 2003; Verrelst et al., 2010). Retrieval methods based on radiative transfer (RT) modelling (Jacquemoud et al., 2009) offer more flexible and universal solutions than empirical methods.
RT models simulate plant-light interactions and provide physical links between the simulated canopy reflectance (output) and vegetation biochemical and structural characteristics such as Cab and LAI (inputs). Various canopy RT models has been developed, ranging from simple one dimensional turbid medium models simulating spatially homogenous vegetation using just few input parameters (e.g. SAIL model, Verhoef and Bach, 2007) to three dimensional (3D) models suitable for complex structurally heterogeneous forest canopies, which require more detailed parameterization (e.g. DART model, Gastellu-Etchegorry et al., 2015). Complex, 3D canopy RT models are particularly useful for specific case studies and sensitivity analyses. Simulated spectral databases that cover broad range of combinations of the key input parameters can help to develop and test new and more robust
retrieval algorithms or to evaluate confounding effects of forest background and architecture on the estimated parameters (Malenovský et al., 2013). These retrieval algorithms can be based on minimization of a cost function (Rivera et al., 2013) or using advanced statistical methods of machine learning algorithms.
Use of the modern machine learning methods for retrieval of vegetation parameters has recently increased (Schlerf and Atzberg, 2006; Verrelst et al., 2012), mainly due to their ability to cope with strong nonlinearity and high dimensionality of their inputs. Once properly trained, typically with a spectral database simulated by a canopy radiative transfer model, they are efficient and fast to apply. The artificial neural network (ANN) belongs among the most popular learning methods used frequently in past for RS retrievals (Malenovský et al., 2013; Verger et al., 2008). One can argue that ANNs do not always offer the most flexible solution, because their training is time consuming and requires significant efforts for choosing the best performing network architecture. The training process also requires optimization of several functional parameters that may greatly influence robustness and accuracy of the final ANN model. More advanced machine learning methods, such as support vector regressions, promise more flexible performance, while maintaining their prediction accuracy (Durbha et al., 2007; Verrelst et al., 2012).
The main objective of this study is to evaluate performance of different spectral inputs entering the support vector regressions The International Archives of the Photogrammetry, Remote Sensing and Spatial Information Sciences, Volume XLI-B7, 2016
(SVR) trained to retrieve Cab and LAI of two contrasting forest canopies from airborne hyperspectral images.
2. MATERIAL AND METHODS
2.1 Study sites
Two stands contrasting in structure and age: a deciduous forest dominated by European beech (Fagus sylvatica) and a coniferous forest dominated by Norway spruce (Picea abies) were chosen as pilot study sites. Both sites are located in the Czech Republic and belong to the network of permanent ecosystem research stations maintained by the Global Change Research Institute (Academy of Sciences of the Czech Republic). Basic site and forest stand characteristics are summarized in Table 1. Altitude (m a.s.l.) 520-620 850-980
Mean slope (°) 10 12.5
Slope orientation W S
Stand age (years) 110 35
Stand density (trees/ha) 280 1500
Mean tree height (m) 33 15
Mean DBH (cm) 36 17
Mean LAI (-) 6 10
Canopy cover (%) 90 – 95 85 – 90 Table 1. Basic research site and forest stand characteristics. Stand parameters describe the forest status in the vegetation season of 2012. Abbreviations: DBH – diameter at the breast
height, LAI – leaf area index.
2.2 Airborne imaging spectroscopy data and field data
Airborne imaging spectroscopy (known also as hyperspectral) data were acquired during the growing season peak of 2006 for the spruce site and of 2013 for the beech site. High spectral and spatial resolution images of both sites were acquired in the spectral range between 400 and 1000 nm using the AISA Eagle imaging spectroradiometer (Specim, Ltd., Finland), with spatial resolution of 2 m for the beech and 0.4 m for the spruce site. Images of the beech site contained 130 bands with the spectral sampling of about 4 nm and of the spruce site 65 bands with the spectral sampling of approximately 9 nm.
Airborne hyperspectral images were corrected for radiometric, geometric and atmospheric confounding effects. Radiometric corrections were performed using the factory calibration coefficients in the CaliGeo software (developed by Specim Inc.), running in the ENVI/IDL programming environment. Geometric corrections were performed using the Parge software (Schläpfer and Richter 2002). The achieved positional accuracy was evaluated using a set of ground control points. It was found to be about 2-3 pixels in case of the spruce site, and one pixel in case of the beech site. Finally, atmospheric corrections were performed in the ATCOR-4 software (Richter and Schläpfer 2002).
Complementary field data describing the forest biochemistry and structure were acquired simultaneously with the airborne data acquisitions. Leaf Cab and basic tree parameters, such as tree height, diameter at the breast height, crown dimensions and LAI, were measured at each site.
Leaf samples for destructive Cab determination were collected from sunlit and shaded branches. 17 trees distributed within four subplots according to the local stand conditions were sampled at the beech site. At the spruce site, we sampled nine trees distributed along an East-West oriented transect. Leaf Cab was extracted in laboratory according to standard procedures of Porra et al. (1989) and Wellburn (1994). For each sample tree we computed an average crown Cab from sunlit and shaded leaf samples. This crown representing Cab values were used in validation of Cab retrievals from AISA images. Crown Cab at the beech site varied between 25.6 and 40.6 µg cm-2 and at the spruce site between 34.1 and 45.7 µg cm-2.
LAI at the beech site was measured by the Plant Canopy Analyzer LAI-2200 (Li-Cor Biosciences, Inc., Lincoln, Nebraska, USA) in two 60 m long transects. Measurements were taken every 5 m, but grouped and processed for distance of each 20 m (FV2200 v2.1.1 software provided by Li-Cor). Resulting values represented so-called plant area index (PAI or effective LAI), which were corrected for the effect of woody elements (Weiss et al, 2004). Final LAI was calculated as LAI = PAI – WAI, where WAI = 1.4 is the woody area index experimentally measured during the leaf-off condition (unpublished data). The in-situ beech LAI data resulted in six validation points with LAI varying between 4.9 and 6.2.
LAI at the spruce site was measured and processed similarly as at the beech site. LAI was measured using an older version of Plant Canopy Analyzer LAI-2000 in a regular grid of 6 x 6 points spaced by 10 m and processed in the C2000 software (predecessor of FV2200). In case of coniferous canopies, measured PAI had to be corrected for the effect of needle clumping at the shoot level and for the effect of woody elements (for more details see Homolová et al., 2007). The in-situ spruce LAI measurements produced nine validation points with LAI varying between 6.8 and 8.5.
2.3 DART radiative transfer modelling
Spectral databases of top-of-canopy bidirectional reflectance factor were simulated using the canopy 3D radiative transfer model DART v.5.5.1 (Gastellu-Etchegorry et al., 2015) coupled with the leaf radiative transfer model PROSPECT v.4 for the beech site (Feret et al, 2008) and v.3.01S, adjusted for Norway spruce needles (Malenovský et al., 2006).
The basic tree alometric parameters, such as tree height, trunk and crown dimensions, 3D foliage and branch architecture, as well as leaf biochemical and leaf structural properties, which were used to build forest mock-ups (Figure 1), were derived from available field measurements characterising the two study sites. The required DART input parameters are summarized in Table 2. The DART simulated spectral database contains 61 700 beech canopy simulations and 115 200 spruce simulations.
The spectral databases were simulated with the spectral resolution of 1 nm and for further analysis resampled to the same spectral resolution of the AISA spectral bands using the Gaussian convolution.
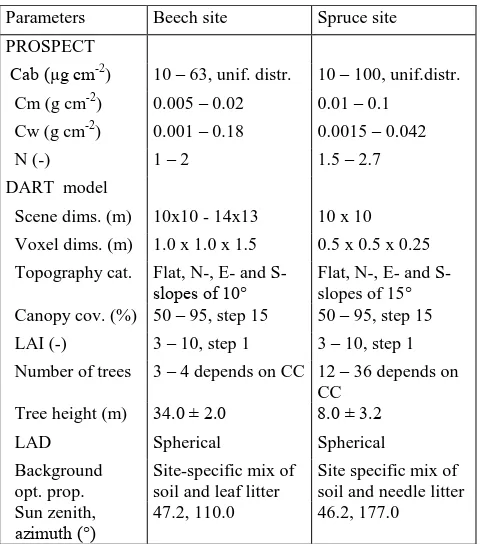
Parameters Beech site Spruce site
Table 2. Basic input parameters for the PROSPECT and DART models used to simulate beech and spruce spectral databases.
Figure 1. Simplified visualization of the DART scenes for the beech (a) and spruce (b) forest stands. Green represents voxels with foliage only, whereas brown colour indicates voxels with
mixed foliage and woody components.
2.4 Support vector regression
Retrievals of both forest parameters of interest (Cab and LAI) were carried out using the epsilon-SVR learning machine with the nonlinear Gaussian radial basis function (RBF) kernel, obtained as the C++ Library of Support Vector Machines (LIBSVM, Chang and Lin, 2011) and compiled under Matlab 2013b. The input spectral database was divided into training and testing subsets that contained both the inputs (spectral or continuum removed reflectance bands) and desired outputs (Cab and LAI). The training dataset was used to define decision rules allowing prediction of output vegetation parameters from known spectral inputs, whereas the testing set was presented to the trained SVR model to check its efficiency and accuracy. To find the optimal regression model and avoid the model overfitting, we applied a dual optimisation
grid-search combined with a 5-fold cross-validation identifying the best values for the cost parameter C and the width parameter γ of the RBF kernel. The final SVR models were then re-trained with the most optimal C and γ parameters.
2.5 Continuum removal and set-up of retrieval scenarios
We considered two types of spectral inputs for the SVR-based retrievals of Cab and LAI: all available hyperspectral bands and continuum-removed bands. The reflectance continuum removal (CR) was tested for three spectral ranges including the red-edge and near infra-red (NIR) regions. The evaluated spectral inputs were:
a) all hyperspectral bands between 400 and 1000 nm, b) CR reflectance of 645 – 710 nm,
c) CR reflectance of 705 – 780 nm, and d) CR reflectance of 680 – 800 nm.
Continuum removal transformation has been previously applied to enhance and to normalize specific absorption features of the vegetation foliar biochemical components (Kokaly and Clark, 1999), including chlorophyll and xanthophyll pigments (Malenovský et al., 2013; Kováč et al., 2013). The CR spectral intervals in our study were selected to capture either changes in the shape of the reflectance signature caused by varying red light absorption of chlorophylls or to capture systematic reflectance changes caused by differences in near infrared photon scattering and absorbance due to varying canopy structure, particularly LAI. The CR transformation was computed as:
CRj∈[λ1,λ2] = |(ρj/ρji) – 1| (1)
where ρj is the measured reflectance of a band j,
ρji is the reflectance of the same band linearly
interpolated within the pre-defined interval between the λ1 and λ2 wavelengths.
3. RESULTS AND DISCUSSION
3.1 SVR training and testing using simulated spectral databases
Performance of SVR and the impact of different SVR spectral inputs on retrievals of forest canopy Cab and LAI were first assessed using the testing parts of DART simulated spectral databases. Results for the four retrieval scenarios (a, b, c and d) were evaluated with statistic indicators, i.e. by computing root mean square error (RMSE) and coefficient of determination of a linear regression established between observed and predicted values. The results show (Table 3) the highest achieved retrieval accuracy for the scenario testing all available hyperspectral bands (a). Although CR transformations (b-d) also provided overall acceptable estimates, the results indicate that their retrieval accuracy depends on the position of defined CR spectral range. As one could expect, CR regions expanding into the red wavelengths (i.e. CR 645-710 and 680-780), where chlorophyll a and b molecules absorb most of the incident light, are more relevant for Cab retrieval than CR 705-800. Contrary, CR ranges expanding into the near infrared wavelengths around 800 nm proved to be more important for LAI retrievals.
For all tested scenarios we consistently observed higher retrieval accuracy for the deciduous beech forest site than for the coniferous spruce forest. This consistency might suggest (b)
some systematic inadequacy of the current spruce forest representation in the DART model, most likely related to multiple scattering within and among the spruce needle shoots, resulting in inaccurate simulation of the canopy reflectance. Another explanation of better SVR estimates in case of the beech study site is the dynamic range (total variability) of estimated traits. The chlorophyll content interval of beech crowns was much narrower (10 – 60 µg cm-2) than in case of spruces (10 – 100 µg cm-2), which could positively affect the training and the overall SVR performance, because high Cab values are inducing smaller reflectance changes compared to lower Cab contents, while increasing significantly degrees of freedom of the SVR training rules.
SVR spectral inputs Cab (µg cm-2) LAI (m2 m-2)
RMSE r2 RMSE r2
a) Hyperspectral bands
Beech 1.03 0.99 0.39 0.97
Spruce 3.62 0.98 0.74 0.90
b) CR 645 – 710 nm
Beech 1.46 0.99 1.00 0.81
Spruce 4.94 0.96 1.16 0.51
c) CR 705 – 780 nm
Beech 4.86 0.88 0.61 0.97
Spruce 9.43 0.87 1.23 0.72
d) CR 680 – 800 nm
Beech 2.13 0.98 0.41 0.97
Spruce 7.38 0.92 0.79 0.88
Table 3. Performance of SVR machines for retrievals of chlorophyll content (Cab) and leaf area index (LAI) using different spectral inputs (scenarios a-d) obtained from the
DART-simulated reflectance look-up tables.
3.2 SVR application on airborne hyperspectral images
SVR models trained on the DART simulated spectral databases of different spectral inputs were applied on the subsets of AISA hyperspectral images. The accuracy of estimated Cab and LAI maps was assessed through comparison with in-situ measured tree crown Cab and LAI plots. The results for the beech site are summarized in Table 4 and the maps of estimated Cab and LAI are shown in Figure 2. The results from the spruce site showed unreasonable values for both traits, most likely due to an incompatibility between the airborne image spatial resolution (reflectance of pixels with size of 0.4 m) and the DART simulated spectral database (reflectance of the entire simulated canopy). Therefore, the results obtained from airborne hyperspectral images at the spruce forest site were not analysed and only the results for the beech site are further discussed.
The best SVR model for Cab estimation, i.e. model with the lowest RMSE computed between estimated and in-situ measured values, was found to be the one using CR bands in the range between 645 and 710 nm (scenario b, Figure 2a), whereas the best LAI estimating SVR model was found to be based on CR bands between 680 and 800 nm (scenario d, Figure 2b).
Additionally, we observed that the CR transformation helped to reduce the across-track bidirectional reflectance (BRDF) effects
present in the AISA image mosaic between the adjacent flight lines due to large sensor field of view. Although BRDF influence is still visible throughout the estimated LAI map (Figure 2b) ,it is not as strong as observed in the map produced with all available hyperspectral bands (scenario a, cf. Figure 2b and c), and even less detectable in the estimated Cab map (Figure 2a).
Application of SVRs on the real hyperspectral data showed, in general, worse performance than when applied on DART simulated spectral databases (cf. Tables 3 and 4). This could be explained by the fact that the SVR models were established on noise-free spectral databases and they could not cope so well with the real hyperspectral data that inherently contain various types of noise. Therefore, it is advisable to train the SVR machines on spectral databases containing artificially added noise (e.g. spectroradiometer noise and/or residual noise of the image atmospheric corrections).
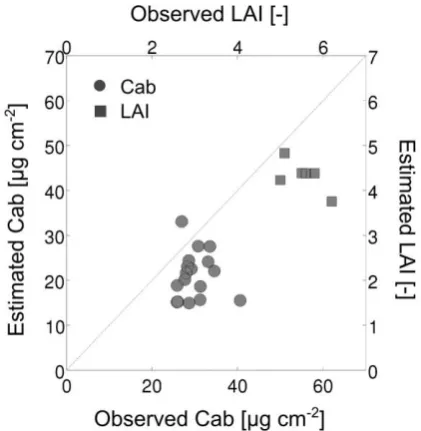
Regardless the spectral input scenario, all results exhibited low coefficients of determination (r2) computed for linear regression between the estimated and in-situ measured vegetation traits. This was caused by too low variability in measured ground truth values resulting in all validation points to be clumped together around a common similar value (Figure 3). The measured mean Cab value at the beech site was around 30 µg cm-2 with rather small variability (standard deviation std. = 4 µg cm-2) and the mean LAI value was equal to 5.5 ± 0.4 m2 m-2 (std.) For future assessments of the remote sensing-based retrieval methods would be necessary to expand the validation datasets towards broader ranges such a way that all possible values of investigated traits are covered. A potential solution is to test the retrieval methods at several study areas that differ in site conditions or on multiple acquisitions of a single site collected in a course of entire vegetation season, when Cab and LAI evolve with progressing phenological phases of vegetation.
SVR input settings Cab (µg cm-2) LAI (m2 m-2)
RMSE r2 RMSE r2
a) Hyperspectral bands 17.8 0.07 1.4 0.33 b) CR 645–710 nm 10.9 0.2 6.0 0.1 c) CR 705–780 nm 16.4 0.12 3.1 0.19 d) CR 680–800 nm 19.3 0.02 1.4 0.47
Table 4. Performance of SVR machines for retrievals of chlorophyll content (Cab) and leaf area index (LAI) of the beech forest site from airborne hyperspectral images (AISA).
4. CONCLUSIONS
In this study we tested the machine learning approaches, namely support vector regressions, for the quantitative estimation of forest biochemical (chlorophyll content) and structural (leaf area index) properties using various spectral inputs derived from hyperspectral data of two contrasting forest stands: broadleaf, European beech and coniferous, Norway spruce forest. We applied and evaluated four different spectral inputs; full hyperspectral set-up (all available spectral bands)
Figure 2. Estimated maps of leaf chlorophyll content using the continuum removal between 645 and 710 nm (a), leaf area index using the continuum removal between 680 and 800 nm (b), and leaf area index using all hyperspectral bands (c) as spectral inputs
into the support vector regression estimating algorithm.
Figure 3. Comparison of estimated chlorophyll content (Cab) and leaf area index (LAI) with the ground measurements collected at the beech research site. The best SVR model for Cab estimation was based on CR 645-710 nm (RMSE = 10.9 µg cm-2) and for LAI estimation on CR 680-800 nm (RMSE = 1.4).
The results complement the maps in Figure 2ab.
and three spectral band subsets standardized using the continuum removal transformation. The assessment of the four spectral inputs at the level of spectral data simulated with combined PROSPECT and DART radiative transfer modelling showed good and promising performance. In general, SVRs trained with the full set of simulated hyperspectral bands produced the most accurate results, but similar accuracies were obtained also for CR reflectance between 645 and 710 nm (Cab estimation), and for CR reflectance between 680 and 800 nm (LAI estimation).
Application of the SVR models on airborne hyperspectral images and consequent validation against the field measurements produced less accurate results. The results at the beech forest site provided meaningful patterns, values of both parameters were within the expected range, with the best accuracies for Cab estimates around 10 µg cm-2 and for LAI estimates around 1.4. Results for the spruce site showed unreasonable predictions for both tested parameters and were, therefore, excluded from further assessment.
SVR training and application was found to be fast and robust when compared to our previous experience with other machine learning method, specifically ANN (Malenovský et al., 2013). Retrievals based on continuum removal gained similar or even better accuracy than retrievals based on all available hyperspectral information content. Especially interesting and useful feature of the reflectance CR transformation is it ability to reduce the negative across-track BRDF artefacts present due to the specific illumination geometry and a wide sensor field of view in images of airborne flight lines.
ACKNOWLEDGEMENTS
This work was supported by the ESA grant “Red Edge Positioning (REP) techniques for Earth observation optical missions” (AO/1-7600/13/NL/LvH) and by the Ministry of Education, Youth and Sports of the Czech Republic within the National Sustainability Program I (NPU I), grant number LO1415. Computational resources required to simulate spectral databases were provided by the CESNET (LM2015042) and the CERIT Scientific Cloud (LM2015085), both supported by the programme "Projects of Large Research, Development, and Innovations. We would like to thank the RedEdge project team, mainly to J.-P. Gastellu-Etchegorry and L. Landier for their support with DART modelling. The CESBIO Laboratory and the University of Paul Sabatier in Toulouse (France) are acknowledged for free license of the DART model, and J.-B. Féret for providing the PROSPECT model code.
REFERENCES
Chang, C. C. and Lin, C. J. 2011. LIBSVM a library for support vector machines. CM Transactions on Intelligent Systems and Technology, 2(3), pp. 1-27.
Colombo, R, Bellingeri, D., Fasolini, D., Marino, C.M. 2003. Retrieval of leaf area index in different vegetation types using high resolution satellite data. Remote Sensing of Environment, 86, pp. 120–131.
Darvishzadeh, R., Skidmore, A., Schlerf, M., Atzberger, C. 2008. Inversion of a radiative transfer model for estimating vegetation LAI and chlorophyll in a heterogeneous grassland. Remote Sensing of Environment 112, pp. 2592–2604.
Durbha, S. S., King, R. L., Younan, N. H. 2007. Support vector machines regression for retrieval of leaf rea index from multiangle imaging spectroradiometer. Remote Sensing of Environment, 107, pp. 348–361.
Feret, J.-B., Francois, C., Asner, G. P. 2008. PROSPECT-4 and 5: Advances in the leaf optical properties model separating photosynthetic pigments. Remote Sensing of Environment, 112, pp. 3030–3043.
Gastellu-Etchegorry J.P., Yin T., Lauret N., Cajgfinger T., Gregoire T., et al. 2015. Discrete anisotropic radiative transfer (DART 5) for modelling airborne and satellite spectroradiometer and LIDAR acquisitions of natural and urban landscapes. Remote Sensing, 7, pp. 1667-1701.
Homolová, L., Malenovský, Z., Hanuš, J., Tomášková, I., Dvořáková, M., Pokorný, R. 2007. Comparison of different ground techniques to map leaf area index of Norway spruce forest canopy In Schaepman et al., ISPRS proceedings on physical measurements and signatures in remote sensing, XXXVI/7-C50, pp. P95.
Jacquemoud, S., Verhoef, W., Baret, F, et al. 2009. PROSPECT + SAIL models: A review of use for vegetation characterization. Remote Sensing of Environment, 113, pp. S56–S66.
Kokaly, R. F. and Clark, R. N. 1999. Spectroscopic determination of leaf biochemistry using band-depth analysis of absorption features and stepwise multiple linear regression. Remote Sensing of Environment, 67, pp. 267–287.
Kováč, D., Malenovský, Z., Urban, O., Špunda, V., Kalina, J., Ač, A., Kaplan, V., Hanuš, J. 2013. Response of green reflectance continuum removal index to xanthophyll deepoxidation cycle in Norway spruce needles. Journal of Experimental Botany, 64, pp. 1817-1827.
le Maire, G., François, C., Soudani, K., et al. 2008. Calibration and validation of hyperspectral indices for the estimation of broadleaved forest leaf chlorophyll content, leaf mass per area, leaf area index and leaf canopy biomass. Remote Sensing of Environment, 112(10), pp. 3846–3864.
Malenovský, Z., Albrechtová, J., Lhotáková, Z., Zurita-Milla, R., Clevers, J. G. P. W., Schaepman, M. E., Cudlín, P. 2006. Applicability of the PROSPECT model for Norway spruce needles. International Journal of Remote Sensing, 27, pp. 5315–5340.
Malenovský, Z., Homolová, L., Zurita-Milla, R., et al. 2013. Retrieval of spruce leaf chlorophyll content from airborne image data using continuum removal and radiative transfer. Remote Sensing of Environment, 131, pp. 85–102.
Porra, R. J., Thompson, W. A., Kriedemann, P. E. 1989. Determination of accurate extinction coefficients and simultaneous equations for assaying chlorophylls a and b extracted with four different solvents: verification of the concentration of chlorophyll standards by atomic absorption spectroscopy. Biochemica and Biophysica Acta , 975, pp. 384-394.
Wellburn, A. R. 1994. The spectral determination of chlorophyll a and chlorophyll b, as well as total carotenoids, using various solvents with spectrophotometers of different resolution. Journal of Plant Physiology, 144, pp. 307-313.
Richter, R. and Schläpfer, D. 2002. Geo-atmospheric processing of airborne imaging spectrometry data. Part 2: Atmospheric/topographic correction. International Journal of Remote Sensing, 23, pp. 2631–2649.
Rivera, J.P., Verrelst, J., Leonenko, G., Moreno, J. 2013. Multiple cost functions and regularization options for improved retrieval of leaf chlorophyll content and LAI through inversion of the PROSAIL model. Remote Sensing, 5, pp. 3280–3304.
Sampson, P. H., Zarco-Tejada, P. J., Mohammed, G. H., Miller, J. R., Noland, T. L. 2003. Hyperspectral remote sensing of forest condition: Estimating chlorophyll content in tolerant hardwoods. Forest Science, 49(3), pp. 381–391.
Schläpfer, D. and Richter, R. 2002. Geo-atmospheric processing of airborne imaging spectrometry data. Part 1: Parametric orthorectification. International Journal of Remote Sensing, 23, pp. 2609–2630.
Schlerf, M. and Atzberger, C. 2006. Inversion of a forest reflectance model to estimate structural canopy variables from hyperspectral remote sensing data. Remote Sensing of Environment, 100, pp. 281–294.
Verger, A., Baret, F., Weiss, M. 2008. Performances of neural networks for deriving LAI estimates from existing CYCLOPES and MODIS products. Remote Sensing of Environment,112(6), pp. 2789–2803.
Verhoef, W. and Bach, H. 2007. Coupled soil-leaf-canopy and atmosphere radiative transfier modeling to simulate hyperspectral multi-angular surface reflectance and TOA radiance data. Remote Sensing of Environment 109, pp. 166– 182.
Verrelst, J., Schaepman, M. E., Malenovský, Z., Clevers, J. G. P. W. 2010. Effects of woody elements on simulated canopy reflectance: Implications for forest chlorophyll content retrieval. Remote Sensing of Environment, 114(3), pp. 647–656.
Verrelst, J., Muñoz, J., Alonso, L., et al. 2012. Machine learning regression algorithms for biophysical parameter retrieval: Opportunities for Sentinel-2 and -3. Remote Sensing of Environment, 118, pp. 127–139.