CLOUD DETECTION OF OPTICAL SATELLITE IMAGES USING SUPPORT VECTOR
MACHINE
Kuan-Yi Lee a, *, Chao-Hung Lin b
a Dept. of Geomatics, National Cheng Kung University, No.1, University Road, Tainan City 701, Taiwan (R.O.C.) – [email protected] b Dept. of Geomatics, National Cheng Kung University, No.1, University Road, Tainan City 701, Taiwan (R.O.C.) –
Commission VII, WG VII/4
KEY WORDS: Cloud Detection, Classification, Support Vector Machine
ABSTRACT:
Cloud covers are generally present in optical remote-sensing images, which limit the usage of acquired images and increase the difficulty of data analysis, such as image compositing, correction of atmosphere effects, calculations of vegetation induces, land cover classification, and land cover change detection. In previous studies, thresholding is a common and useful method in cloud detection. However, a selected threshold is usually suitable for certain cases or local study areas, and it may be failed in other cases. In other words, thresholding-based methods are data-sensitive. Besides, there are many exceptions to control, and the environment is changed dynamically. Using the same threshold value on various data is not effective. In this study, a threshold-free method based on Support Vector Machine (SVM) is proposed, which can avoid the abovementioned problems. A statistical model is adopted to detect clouds instead of a subjective thresholding-based method, which is the main idea of this study.
The features used in a classifier is the key to a successful classification. As a result, Automatic Cloud Cover Assessment (ACCA) algorithm, which is based on physical characteristics of clouds, is used to distinguish the clouds and other objects. In the same way, the algorithm called Fmask (Zhu et al., 2012) uses a lot of thresholds and criteria to screen clouds, cloud shadows, and snow. Therefore, the algorithm of feature extraction is based on the ACCA algorithm and Fmask. Spatial and temporal information are also important for satellite images. Consequently, co-occurrence matrix and temporal variance with uniformity of the major principal axis are used in proposed method. We aim to classify images into three groups: cloud, non-cloud and the others. In experiments, images acquired by the Landsat 7 Enhanced Thematic Mapper Plus (ETM+) and images containing the landscapes of agriculture, snow area, and island are tested. Experiment results demonstrate the detection accuracy of the proposed method is better than related methods.
1. INTRODUCTION
Passive remote sensing sensors used for Earth observations are primarily limited by their sensitivity to clouds and weather conditions. Thus, the availability of accurate cloud masks is important in related research topics. Clouds in optical images seem identifiable as they are generally bright in images. However, the variety of reflectance and temperatures of the Earth’s surface make the related thresholding-based approaches difficult to accurately identify clouds from images. The automatic and accurate generation of cloud masks remains a challenging and important issue in the remote sensing community.
Following the categories of cloud detection methods in (Lin et al., 2015), the previous methods are classified into two categories, namely, date and multi-temporal methods. While single-date methods utilize spectral and contextual information in cloud detection with the available spectral bands and sensors, multi-temporal methods (Du et al., 2002; Canty et al., 2008) take fully use of both the spectral information and spatial-temporal information in cloud detection. Thresholding on thermal bands is the most common approach (Ackerman et al., 1998; Irish et al., 2006; Hagolle et al., 2010; Oreopoulos et al., 2011; Zhu and Woodcock, 2012; Jin et al., 2013). A temperature threshold is specified to separate cloud and clear-sky pixels based on the fact that clouds are bright in the thermal bands. For example, Irish et al. (2000) proposed an automatic cloud cover assessment (ACCA) for images acquired by the Landsat-7 Enhanced Thematic Mapper Plus (ETM+) sensor. Their method uses available bands to establish a set of threshold-based filters. Several reflectance ratios on bands 2 to 6 are used to partition the pixels into clouds,
non-clouds, and ambiguous pixels. The ambiguous pixels are further re-examined solely by thresholding the thermal band. Oreopoulos et al. (2011) proposed adaptations of ACCA to process images obtained from the MODIS sensors. Although ACCA can effectively detect clouds, this algorithm may fail to distinguish snow from clouds in high-latitude areas (Zhu and Woodcock, 2012). To resolve this problem, Choi and Bindschadler (2004) developed a method to determine the optimal threshold of the normalized difference snow index (NDSI) by iteratively matching clouds and cloud shadow edges. Zhu and Woodcock (2012) utilized top of atmosphere (ToA) reflectance and temperatures in cloud and cloud shadow detection.
Thermal bands are effective for cloud detection; however, the payload of several Earth observation sensors with high spatial resolution does not include thermal channels. Therefore, several methods that utilize multiple sensors and contextual information have been proposed. Sedano et al. (2011) proposed a multi-sensor method, which relies on complementary information provided by a second sensor with a high revisit period. In addition, several studies adopted advanced algorithms, such as Markov random field (Hégarat-Mascle and André, 2009) and tasseled cap transformation (Li and Tang, 2013), to detect clouds using the spatial correlation and contextual information of an image.
threshold-free detection method based on object classifier with various spectral and spatial features is proposed.
2. METHODOLOGY
This paper introduces a cloud detection method based on image classification. In this section, SVM classification is briefly introduced in Sections 2.1, and the proposed approaches on the spatial-spectral features are then described in Section 2.2.
2.1 SVM classification
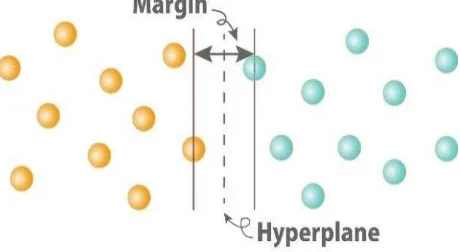
SVMs were originally designed for two-class linear classifications. The basic idea is to determine the maximal margin of the input samples, where margin means the minimal distance from the separating hyperplane to the closest samples of classes. The middle of the margin is the optimal separating hyperplane, and the samples closest to the hyperplane are called support vectors, as shown in Figure 1. Given that the determined hyperplane cannot separate the samples well, the linear SVM is extended to a non-linear SVM by transforming the problem into a feature space using a set of nonlinear basis functions, where the samples are separated as clearly as possible. In doing so, the algorithm avoids the process of determining the optimal separating hyperplane in the feature space. A kernel representation is used instead, in which the solution is written as a weighted sum of the values of a kernel function evaluated at the support vectors. In addition, only a few training samples are required in the SVM algorithm. These properties make SVMs suited to high-dimensional classification problems in the field of remote sensing.
Figure 1. Illustration of SVM classification.
Given a set of training pixels � = {� , � }�= , where � is the training sample, � is the corresponding class label, and n represents the number of pixels. The decision function can be found by solving the following optimization equation:
controls the trade-off between the training error and the margin, and �(� , � ) is the transformation kernel function. The effectiveness of SVM is dependent on the margin parameter C, the selection of the kernel function, and the parameters in the kernel function. The design and selection of a kernel is difficult without sufficient priori knowledge of the classified targets in thepoint clouds (Mallet et al., 2011). Therefore, the Gaussian kernel that contains only one parameter is adopted, that is,
2
The best combination of the parameters C and k is generally decided through cross validation, that is, the parameters with the best cross-validation accuracy are selected. The final SVM model is trained on a training dataset by using the selected parameters. The model is then used in testing and classifying image pixels.
The SVM classifier assigns a label to each pixel based on its feature representation. The features are computed from the spectral bands. In this study, not only the spectral features but also texture features in principal images are used. These two kinds of features are described in the following section.
2.2 Spectral features
Inspirited by the thresholding-based methods, ACCA (Irish et al., 2000) and Fmask (Zhu et al., 2012), several spectral bands and band radios that defined according to physical characteristics of clouds are adopted as features to group the objects of cloud, cloud shadow, and the others. These features are described as follows.
Brightness feature. Clouds are generally bright in optical images. Therefore, the pixel brightness is introduced in the feature space to separate bright and non-bright pixels. By using the brightness or called intensity in color image processing, the brightness feature is defined as the average of the pixel values in blue, green, and red bands, that is,
( � � � + �� � � + � � )⁄ , (4)
where � � , �� �, and � represent the blue, green, and red bands, respectively, in an image; I denotes the input image.
Snow feature. To separate snow from cloud, the commonly-used index called normalized show difference index (NSDI) is adopted. The NSDI is defined as
( �� � � − �� � ) (⁄ �� � � + �� � ) (5)
where �� denotes the shortwave infrared (SWIR) bands.
Temperature feature. The thermal infrared band, denoted as � , is used as temperature feature to extract cold clouds.
Cold land surface feature. This feature is to extract possible the reflectance of green leaves is relatively high because that few energy is absorbed. In contrast, the reflectance of � is relatively low because the chlorophyll in green leaves absorbs energy.
2.3 Texture features
The spectral features can well represent the radiation of individual objects such as ground objects and thick cloud. However, the spectral features are difficult to identify composite objects such as the composition of transparent thin cloud and ground objects. Therefore, texture features are introduced in the classifier. The previous method adopted several texture indexes such as correlation, contrast, uniformity, homogeneity, and entropy of co-occurrence matrix to extract various textures from each bands. However, the similar spectral bands, such as the groups of visible bands and infrared bands, links to highly dependent features. A classifier with several highly dependent features decrease the classification accuracy and increase the computational cost.
In this study, to solve this problem, a hotelling transformation is applied to the spectral bands. The two major principal components, denoted as �� and �� , correspond to the two largest eigenvalues are used in texture feature extraction. In the co-occurrence matrix, denoted as G, the position operator Q is defined as “one pixel immediately to the right”. The size of G, that is, the number of possible reflectance is set to K× � (� =
in the experiments). The search window size is � × �, and it is set to 9 × 9 . The uniformity is used as texture feature, which is defined as
∑ ∑� ⁄�
= �
= (7)
Figure 2. Hotelling transformation results correspond to the two largest eigenvalues.
Figure 3. Co-occurrence matrix results correspond to the two largest eigenvalues.
3. EXPERIMENTAL RESULTS
3.1 Study area
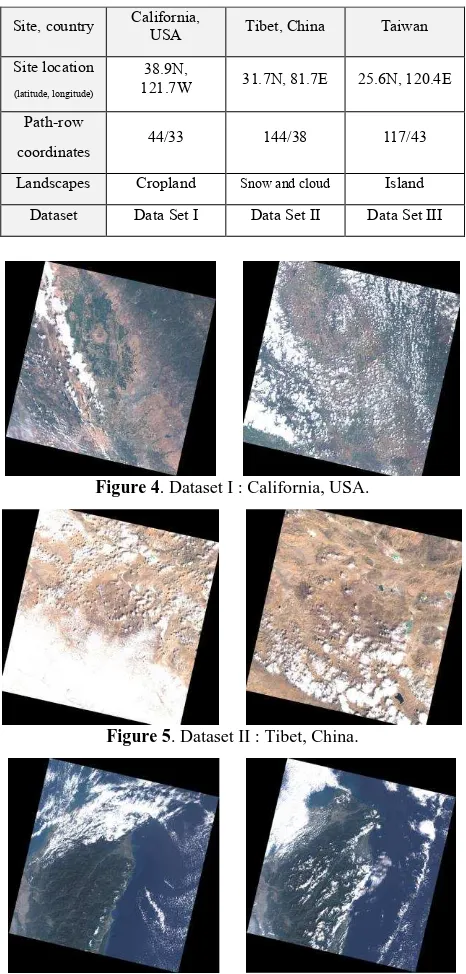
In the experiments, Landsat 8 OLI/TIRS images that contain various landscapes are used to test the feasibility and performance of the proposed method. Three study sites, namely, California, Tibet and Taiwan, were selected. The California Landsat acquisitions with agricultural landscape and a few cloud covers are suitable for quantitative analyses. The Taiwan Landsat acquisitions that contain approximately 25% cloud cover and the
Tibet Landsat acquisitions that contain approximately 10% snow and 15% cloud cover are used for method evaluation.
Table 1. Landsat 8 acquisitions for the study sites.
Figure 4. Dataset I : California, USA.
Figure 5. Dataset II : Tibet, China.
Figure 6. Dataset III : Taiwan.
3.2 Experimental Results
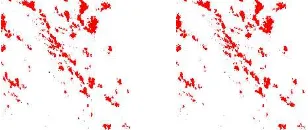
The proposed method was compared with recent thresholding-based cloud detection method, Fmask algorithm with default parameter setting. The visual results show in Figures 7 indicate that both the proposed method and Fmask have good detection result in Dataset I. However, Fmask have incorrect masking in Dataset II which contains snow and cloud.
To reduce the processing time, we just used a part of the Landsat images of the dataset. The images size are × pixels. Although there are not the whole images, the three groups, which have clouds, non-clouds and the others, can still be seen in the images.
Site, country California, USA Tibet, China Taiwan
Site location (latitude, longitude)
38.9N,
121.7W 31.7N, 81.7E 25.6N, 120.4E
Path-row
coordinates 44/33 144/38 117/43
Landscapes Cropland Snow and cloud Island
Date Dataset I : California, USA (contain cropland changes) Dataset II : Tibet, China (contain snow and clouds)
2013/08/06 2014/05/05 2015/03/18 2015/10/12
Original image
Proposed method
Fmask
Ground truth
Figure 7. Cloud detection results in dataset I and dataset II.
3.3 Comparison of texture features
This comparison aims to know the importance of the hotelling transform. Hotelling transform mainly extract the significant detail of 10 bands. It means that hotelling transform can extract the detail of 10 bands, except panchromatic band, and rank by their eigenvalues. In proposed method we used the two largest eigenvalues, because they contain the greater part of the texture details. Therefore, we used co-occurrence matrix to capture the texture of 10 bands to compare with hotelling transform. In the other words, it is the comparison between a method which have 2 features with hotelling transform and a method which have 10 features without hotelling transform. All of them used co-occurrence matrix to get the texture feature. As the result, a method of accuracy with hoteling transform is slightly better than a method without hotelling transform.
Figure 8. Comparison results in dataset I. Left: with hotellling transform. Right: without hoteling transform.
Table 2. Comparison of texture features in dataset I. Precision (P), recall (R), F-measure (F), and accuracy (A) are used to compare our method and Fmask. The method with the best performance is marked in bold.
Dataset I : California, USA (contains cropland changes)
Date With hotelling transform
Without hotelling transform P
(%) (%)R (%)F (%)A (%)P (%)R (%)F (%)A
2013/
08/06 98.34 80.52 88.54 96.90 94.48 88.64 91.47 96.38
Table 3. Comparison of texture features in dataset II.
Dataset II : Tibet, China (contains snow and clouds)
Date With hotelling transform
Without hotelling transform P
(%) (%)R (%)F (%)A (%)P (%)R (%)F (%)A
2015/
Table 4. Comparison of texture features in dataset III.
3.4 Evaluation of cloud detection
Several sub-images in Dataset I and II were tested. Quantitative analyses that compare the cloud detection results from our method and Fmask with manually digitized ground truths were conducted. In this experiment, the detection accuracy and F-measure were used to evaluate the detection performance. F-measure is a combination of precision and recall. Precision is defined as ��= �� �� + �⁄ , which is a measure of detection exactness, and recall is formulated as ��= �� �� + �⁄ , which can measure detection completeness. The ��, �, and � notations represent true positive, false positive and false negative, respectively. The F-measure expressed as ��=
����⁄(��+ ��) is viewed as a harmonic mean of the precision and recall. Accuracy is defined as =
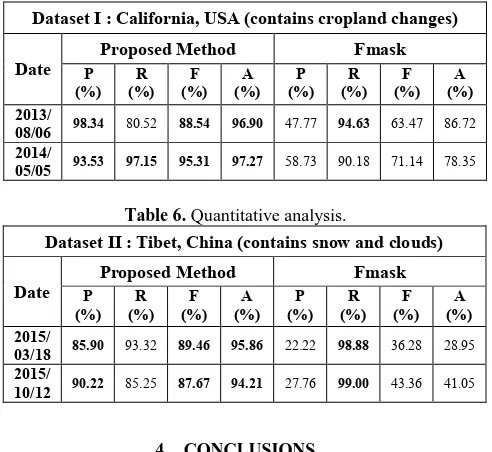
�� + �� ⁄ �� + �� + � + � , where �� denotes the true negative. The results in Tables 5 and 6 show that the F-measure and detection accuracy of our method are 87 % to 95% and 94% to 97 %, respectively, and that of Fmask are 36% to 71% and 28% to 86%, respectively, because of the setting of thresholds. Without the parameter turning, the proposed method outperform Fmask with default parameter setting.
Table 5. Quantitative analysis. Precision (P), recall (R), F-measure (F), and accuracy (A) are used to compare our method and Fmask. The method with the best performance is marked in bold.
Table 6. Quantitative analysis.
Dataset II : Tibet, China (contains snow and clouds)
Date PProposed Method Fmask
(%) (%)R (%)F (%)A (%)P (%)R (%)F (%)A
2015/
03/18 85.90 93.32 89.46 95.86 22.22 98.88 36.28 28.95
2015/
10/12 90.22 85.25 87.67 94.21 27.76 99.00 43.36 41.05
4. CONCLUSIONS
This paper addresses the issue of cloud detection. The main goal is to propose a threshold-free method. Our method is based on SVM classifier with the features of brightness, snow, temperature, cold land surface, vegetation, and texture. From visual comparison, the proposed features provided a better description of clouds and shadows. In addition, the quantitative experiment show the classification accuracy of the proposed method is 94% to 97%. The results demonstrate the superiority
of the proposed threshold-free method to the threshold-based Fmask method with default threshold values.
References
Ackerman, S.A., Strabala, K.I., Menzel, W.P., Frey, R.A., Moeller, C.C., & Gumley, L.E. (1998). Discriminating clear sky from clouds with MODIS. Journal of Geophysical Research D: Atmospheres, 103 (D24), 32141–32157.
Choi, H., & Bindschadler, R. (2004). Cloud detection in Landsat imagery of ice sheets using shadow matching technique and automatic normalized difference snow index threshold value decision. Remote Sensing of Environment, 91, 237–242.
Du, Y., Teillet, P. M., & Cihlar, J. (2002). Radiometric Normalization of Multitemporal High-Resolution Satellite with Quality Control for Lnad Cover Change Detection. Remote Sensing of Environment, 82, 123-134.
Canty, M. J., Nielsen, A. A. & Schmidt, M. (2008). Automatic radiometric normalization of multitemporal satellite imagery. Remote Sensing of Environment, 91, 441−451.
Hagolle, O., Huc, M., Pascual, D. V., & Dedieu, G. (2010). A Multi-Temporal Method for Cloud Detection, Applied to Formosat-2, Venµs, Landsat and Sentinel-2 Images. Remote Sensing of Environment, 114, 1747-55.
Irish, R. (2000). Landsat-7 Automatic Cloud Cover Assessment Algorithms for Multispectral, Hyperspectral, and Ultraspectral Imagery. The International Society for Optical Engineering, 4049, 348–355.
Hégarat-Mascle, S., & André, C. (2009). Use of Markov Random Fields for Automatic Cloud/Shadow Detection on High Resolution Optical Images. ISPRS Journal of Photogrammetry and Remote Sensing, 64, 351-66.
Jin, S., Homer, C., Yang, L., Xian, G., Fry, J., Danielson, P., & Townsend, P. A. (2013). Automated Cloud and Shadow Detection and Filling Using Two-Date Landsat Imagery in the USA. International Journal of Remote Sensing, 34, 1540-60.
Li, Dacheng, & Tang, Ping. (2013). A Sensor Specified Method Based on Spectral Transformation for Masking Cloud in Landsat Data. IEEE Journal of Selected Topics in Applied Earth Observations and Remote Sensing, 6(3), 1619-27.
Lin, Chao-Hung, Lin, Bo-Yi, Lee, Kuan-Yi, and Chen, Yi-Chen (2015). Radiometric Normalization and Cloud Detection of Optical Satellite Images Using Invariant Pixels. ISPRS Journal of Photogrammetry and Remote Sensing, 106, 107-117.
Mallet, C., Bretar, F., Roux, M., Soergel, U., Heipke, C., 2011. Relevance assessment of full-waveform lidar data for urban area classification. ISPRS Journal of Photogrammetry and Remote Sensing 66 (6), S71-S84.
Oreopoulos, L., Wilson, M., & Várnai, T. (2011). Implementation on Landsat data of a simple cloud mask algorithm developed for MODIS land bands. IEEE Transactions on Geoscience and Remote Sensing, 8(4), 597–601.
Sedano, F., Kempeneers, P., Strobl, P., Kucera, J., Vogt, P., Seebach, L., & San-Miguel-Ayanz, J. (2011). A Cloud Mask Methodology for High Resolution Remote Sensing Data Combining Information from High and Medium Resolution Optical Sensors. ISPRS Journal of Photogrammetry and Remote Sensing, 66(5), 588-96.
Zhu, Z., & Woodcock, C. E. (2012). Object-based cloud and cloud shadow detection in Landsat imagery. Remote Sensing of Environment, 118, 83–94.
Dataset III : Taiwan (contains island)
Date With hotelling transform
11/29 99.44 69.42 81.76 93.49 99.38 69.92 82.08 93.59
Dataset I : California, USA (contains cropland changes)
Date P Proposed Method Fmask
(%) (%)R (%)F (%)A (%)P (%)R (%)F (%)A
2013/
08/06 98.34 80.52 88.54 96.90 47.77 94.63 63.47 86.72
2014/