A GEO-VISUAL ANALYTICS APPROACH TO BIOLOGICAL SHEPHERDING:
MODELLING ANIMAL MOVEMENTS AND IMPACTS
K. K. Benke a,*, F. Sheth a, K. Betteridge b, C. J. Pettit c and J.-P. Aurambout a
a
Department of Primary Industries – Parkville Centre, Future Farming Systems Research Division, PO Box 4166, Parkville, Victoria, 3052, Victoria, Australia - (kurt.benke, falak.sheth, jeanphilippe.aurambout)@dpi.vic.gov.au b
AgResearch Grasslands, Private Bag 11008, Palmerston Nth 4442, New Zealand - [email protected] c
AURIN, Faculty of Architecture, Building and Planning, University of Melbourne, Parkville, Victoria, 3010, Australia - [email protected]
Commission II, WG II/6
KEY WORDS: Geo-visual analytics, biological shepherding, nitrogen emissions, spatial analysis, agent-oriented modelling
ABSTRACT:
The lamb industry in Victoria is a significant component of the state economy with annual exports in the vicinity of $1 billion. GPS and visualisation tools can be used to monitor grazing animal movements at the farm scale and observe interactions with the environment. Modelling the spatial-temporal movements of grazing animals in response to environmental conditions provides input for the design of paddocks with the aim of improving management procedures, animal performance and animal welfare. The term ‘biological shepherding’ is associated with the re-design of environmental conditions and the analysis of responses from grazing animals. The combination of biological shepherding with geo-visual analytics (geo-spatial data analysis with visualisation) provides a framework for improving landscape design and supports research in grazing behaviour in variable landscapes, heat stress avoidance behaviour during summer months, and modelling excreta distributions (with respect to nitrogen emissions and nitrogen return for fertilising the paddock). Nitrogen losses due to excreta are mainly in the form of gaseous emissions to the atmosphere and leaching into the groundwater. In this study, background and context are provided in the case of biological shepherding and tracking animal movements. Examples are provided of recent applications in regional Australia and New Zealand. Based on experimental data and computer simulation, and using data visualisation and feature extraction, it was demonstrated that livestock excreta are not always randomly located, but concentrated around localised gathering points, sometimes separated by the nature of the excretion. Farmers require information on the nitrogen losses in order to reduce emissions to meet local and international nitrogen leaching and greenhouse gas targets and to improve the efficiency of nutrient management.
1. INTRODUCTION
Tracking and analysing the movement of animals in their environment could potentially have a number of positive impacts, including better landscape design, leading to improved environmental outcomes and farming practices. In particular, there are possible economic advantages (improved product quality, higher stocking rates and profit per farm), environmental impacts (improved soil condition and management of nitrogen emissions), and animal welfare issues (lowered mortality, reduced stress and improved health). Correlation of animal movements with local environmental conditions would also provide opportunity for landscape design and optimisation.
Lamb production can be compromised by adverse effects due to interactions between the sheep and the local environment arising from weather conditions, climate change, pasture type and location, urinary and faecal excreta and soil quality. Losses in farm production can result from heat stress in summer, cold stress in winter and nutritional deficiencies from poor pasture choice. Excreta of grazing ruminants, whilst adding to greenhouse gas (GHG) emissions, can lead to critical source areas (CSAs) that emit a disproportionate amount of nitrogen (N) to the environment, especially as leached N can contaminate groundwater (Betteridge et al, 2010). Preferential grazing on different parts of large paddocks can be affected by various
factors, such as aspect, elevation, time of day, pasture mass and quality variation, shade, shelter, watering and supplementary feeding sites. Victorian lamb exports were valued at $869 million p.a. in 2009-10, and accounted for 40% of Australian total lamb exports (ABS, 2010). A potential 10% decline in lamb production due to heat stress would be equivalent to $87 million (see analysis for the dairy industry by Mayer et al, 1999). There is therefore a case for tracking and analysing the behaviour of grazing animals and their interactions with the local environment, in order to identify opportunities to improve conditions through redesign of the paddock.
The aims of this study were to (a) describe the use of geo-visual analytics for data display and information extraction in the context of biological shepherding, and (b) to describe illustrative examples of spatial analysis in the area of biological shepherding relating to livestock gathering points that lead to CSAs and nitrogen emissions.
2. TRACKING ANIMAL MOVEMENTS
In the case of tracking moving groups of animals, such as a flock of sheep or a herd of cows, the observed patterns of change in location may be regarded as spatio-temporal expressions of behaviour in response to favourable environmental conditions, including food availability (Gudmundsson et al, 2008). It would be a reasonable
proposition that certain behaviour patterns could be analysed by algorithms and modelled as trajectories with well-defined spatial foot-prints dependent on daily and seasonal factors. These influencing factors could include heat stress from temperature and humidity, food availability and quality, shade and water supply, wind shelter, as well as psychological issues involving herding instincts, social interactions and self preservation from predators. Animal movements may be influenced directly by ‘biological shepherding’ in the form of paddock design involving the nature and location of the food supply, and topographical features, such as trees providing shelter from the weather and the location of fences. The term ‘biological shepherding’ is associated with the re-design of environmental conditions and the analysis of responses from grazing animals. In one study of sheep grazing in the southern highlands of Western Australia, the effect of temperature was investigated and it was reported that variations in average daily temperature accounted for 29% of the variation in distance covered (FA, 2008). It was concluded that sheep will restrict or adjust travel range on hot days to conserve energy and reduce heat stress and, more importantly, the experimental data provided statistics to quantify this behaviour. Tracking animal movements may also reveal information on the dietary preferences of sheep and how these may vary seasonally.
In recent years, advances in technology have made it possible to track individual animals in a manner that allows for the analysis of flock behaviour over space and time. Gudmundsson et al (2008), noted that the combination of an orthogonal temporal axis with two spatial dimensions, together with a global positioning system (GPS), or other tracking technologies, such as video, or a wireless local area network, provide potentially very effective tools for analysis of 3D movement patterns. Data analysis may reveal significant information about the flock as a whole. This could include bottlenecks and frequently-used corridors, which show indications of flock behaviour or random grazing (Djordjevic et al, 2008). In addition, monitoring may show evidence of flocking size (number), meeting places, or periodic patterns and frequented locations, as shown schematically in Figure 1 (see Kreveld et al, 2007; Benkert et al, 2008; Djordjevic et al, 2008; Gudmundsson et al, 2008).
Figure 1. Examples of animal movements, showing schematic movement patterns representing categories, such as ‘meeting places’ and ‘frequent locations’.
In many applications, the terms ‘meeting places’ and ‘frequent locations’ can be replaced by ‘gathering areas’. In the case of gathering areas, the regions involved may include urination and
defecation sites and the requirement of determining approximate areas of coverage using the GPS (Figure 2). This could support a strategy designed to reduce environmental pollution arising from N emissions from grazing livestock.
Figure 2. An example of a GPS collar for tracking animal movements (the AgTrax II unit was supplied by Alana Ecology, United Kingdom).
The behaviour of individual animals, whether they are leaders or followers, may also be monitored and logged for analysis (Laube and Dennis, 2006; Anderson et al, 2008; Betteridge et al, 2010). The issue of single file movement and its detection, in a computational context, has been studied by Buchin et al (2008). Visual animation may provide information on the spatial-temporal dynamics relating to the movements of individuals and groups, including speed and direction (Andrienko and Andrienko, 2003). The nature and evolutionary behaviour of group patterns and their movements can be highlighted by adding animation in the form of movie-like sequences. Emergent patterns provide clues on group direction, leadership and destination. It may even be possible to detect evidence of social interactions or social structure and its changing nature with time, using agent-based models to correlate positions in space and time, but at a cost in resources as every animal may need to be monitored to identify the leader.
Although there are many possible advantages of this type of data analysis, there has been very little consideration given to the quality of data presentation. In order to relieve information overload, as an inevitable consequence of the huge sampling rates involved, improvements in data display and analysis are required to enhance user-perception of the information. One approach is the use of geo-visual analytics for visual perception of meaningful spatial patterns that may be less apparent in large numerical arrays and databases, such as textures, trends or clustering (Benke et al, 1988). Geo-visual analytics also involves the multi-dimensional plotting and animation of colour-encoded data and statistical analysis which can be viewed both graphically and spatially using geographical information systems (GIS) and digital globes. Spatial data mining is aimed at finding patterns in landscapes and geography over space and time using spatial viewers, such as Google Earth. The huge increase in geographically referenced data requires a blend of information technology (IT), digital mapping and remote sensing. A feature of data mining is the automatic search for hidden patterns in large multi-dimensional databases (Kantardzie, 2003). A variety of data mining techniques can be
Periodic patterns
Frequent Locations Meeting Places
Flocking
used in combination with the spatial data to quantify processed information -- in a process of guided discovery in the pursuit of new knowledge (Mucherino et al, 2009). This combination of advanced graphics and statistics may include cluster analysis, time-series analysis and digital image processing (including thresholding, segmentation and classification).
In the case of biological shepherding, the type of knowledge sought by the analyst could include the pattern of tracks produced by the grazing animals, their flocking sites and frequent locations, especially in times of environmental stress. Gathering sites, in particular, may reveal localised areas of excretion events leading to N leaching and nitrous oxide emissions under certain conditions (e.g. compacted and wet soil).
The mapping and analysis of the various animal behaviour patterns, in response to environmental conditions, provides information for landscape design and optimisation, and could be used to identify feeding preferences. Tracking sheep movements and gathering points provides quantitative information that may be useful to guide paddock design. Optimisation of landscape design requires cost-benefit analysis. For example, key factors in landscape design could include
(a) location of trees for protection from wind and solar radiation (b) orientation of hedgerows for wind protection in winter (c) shade-cloth area and location
(d) location of water sources
There are also geometrical design variables to consider, such as paddock slope, perimeter and shape. All these factors need to be subject to farm economics assessment, as part of the cost-base.
3. SPATIAL ANALYSIS
3.1 Animal Movements and Clustering
Data gathering is based on GPS tracking in space and time. The GPS coordinates can be correlated with environmental data, such as temperature, humidity, solar radiation, wind, mortality, reproduction rates, locations for feeding, drinking and excretion and landscape features. The data set is then stored as a relational database and processed using visual analytics and data mining. Agent-based models of sheep can be combined with simulation techniques for predictive modelling (Mucherino et al, 2009). Spatial movement is often represented by simple rules based on Newtonian kinematics. A feasible linear movement in a sub-trajectory may be represented by a change in the so-called four-vector representing its spatial-temporal location, i.e.
R
≡
(
x
,
y
,
z
,
t
)
. Total distance travelled is the sum of the sum of all the sub-trajectory displacements. This information can be used to provide kinematic data, such as speed and geographic locations, at various times for each animal, while constrained within its spatio-temporal footprint. The approach may be repeated using averages to model the entire flock – allowing monitoring of group behaviour.For example, the hypothetical centre-of-mass, C, along a set of points in a one-dimensional sub-trajectory is given by
coordinate and
ℜ
represents the set of real numbers. Note that C is effectively a weighted average. If the points are spread out over a plane, the position of the centre-of-mass as a function of time, t, is described by the vector, r, coordinates (Johnson, 2007). In the case of spatially-variant excreta for sheep or cows, geo-visualisation of the data set (x, y, z, t), at a given point in time provides a global picture revealing clustering effects or trends not readily apparent in localised numerical analysis (Mucherino et al, 2009).3.2 Examples of Geo-Visualisation Tools
Examples of visualisation for planning and analysis in natural resource management have been described in the past by Cartwright et al (2004), Dataviz (2010), Benke and Pelizaro (2010) and Benke et al (2011). A visual analytics capability has been established at the National Visualization and Analytics Centre (NVAC) - http://nvac.pnl.gov/ and is concerned with applying scientific and geographical analytics techniques to meta-analysis of trends in behaviour. An international community of practice around the subject of visual analytics has been established through the International Cartographic Association Commission on Geo-Visualization (http://geoanalytics.net/ica/). The Signature Analyst software (SPADAC Inc.) is one example that functions as a stand-alone client or as an extension to ESRI ArcGIS desktop products. ArcGIS provides a variety of capabilities in GIS, cartography and visualisation to enable high-quality map production. Signature Analyst extends ArcGIS by providing advanced
spatial statistics and modelling. The package Treemap (Tessera
DataVisualisation) can be used to visually discover correlations and outliers between soil, land and climatic variables in datasets (Bederson et al, 2002). The software packages cited in this section represent only a small subset of those available.
4. SIMULATION EXPERIMENTS
4.1 Agent-Oriented Modelling
A preliminary experiment in tracking shows animal movements in Figure 3, where seven sheep were tracked in 7 sec time steps using AgTrax II GPS units with a view to discovering feeding preferences between ryegrass and plantain pastures (in a pilot study recently instigated by the Department of Primary Industries (DPI) at Hamilton, Victoria). The GPS data plus Google Earth imagery in Figures 3 and 4 reveals that different sheep are subject to different behaviour patterns, with respect to animal movements, including both solitary exploration and local clustering.
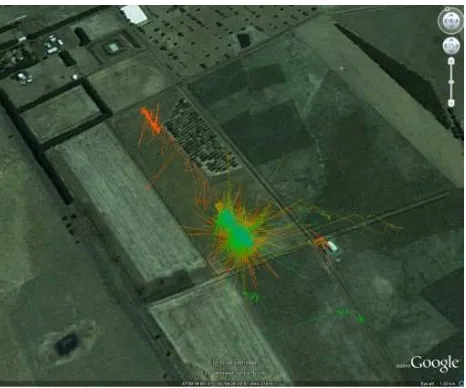
Figure 3. Raw data for sheep positions over time in a 14 ha paddock using GPS collars and Google Earth as context. Each colour corresponds to an animal and location.
Figure 4. Linear connections between the discrete positions as in Figure 3 (previous vs current), reveal clustering and outliers.
Figure 5. Screen image of preferred feeding sites from a prototype agent-based model using NetLogo software.
Additional information required for modelling the determinants of sheep behaviour can be acquired from spatial data layers (e.g. land use, soil, slope, aspect) and observation and monitoring of sheep attributes (breed, weight, age, sex). Novel visual analytics and data mining techniques are useful for detection of trends, clusters and behavioural patterns in animal interaction and movement across a paddock. Multi-agent simulation using an agent-based model (ABM) is possible combining autonomous agents, decision-making rules, an interaction framework and data from the surrounding environment as described schematically in the Appendix (see also Brown et al, 2005; Mucherino et al, 2009). An agent-based model of sheep behaviour can be calibrated using visual analytic techniques in order to predict behaviour under different conditions, e.g. sheep population density, and paddock shape and size. Such an approach may also provide new insights into sheep behaviour, e.g. time of the day that sheep seek shade for protection from solar radiation?
Figure 5 is a screenshot of a prototype ABM, developed using the open source NetLogo software (described by Wilensky, 1999) and data derived from the DPI farm at Hamilton. The image shows cumulative time spent at particular locations. Data were extracted from GPS outputs for eight sheep over a period of approximately 24 hours at a 7 sec time interval. Green represents at least 1 time step, cyan more than 10 time steps, yellow more than 50, and red more than 100 time steps (red therefore shows preferred feeding areas). This output can therefore be used to identify areas that could be interpreted as preferred locations. Such data can be used to test and validate the behaviour of the ABM model and identify landscape features of interest to the sheep, such as shade.
4.2 Animal Nitrogen Emissions
In the case of gathering areas for excretion by sheep and cows, there is a distinction between urination sites and defecation sites (Betteridge, 2010a). By knowing their relative areas and locations, the estimated mass of excreta can be used to support computer models for the prediction of CSAs and, therefore, nitrogen (N) emissions. This would contribute to a mitigation strategy related to N emissions arising from grazing livestock, especially if mitigations are targeted at CSAs (Betteridge et al 2011). The N losses are mainly in the form of gaseous losses to the atmosphere and leaching into the groundwater (Betteridge et al 2010a). Farmers require information on N losses in order to reduce emissions to meet local and international N leaching and greenhouse gas target levels.
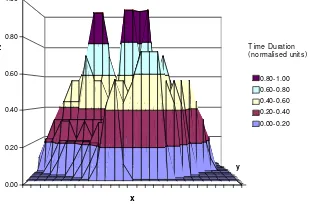
Using data from southern Hawkes Bay, New Zealand, Figure 6(a) shows a 2-D plot of urination and defecation events, normalised by time, for monitored cows in a paddock in steep hill country (Betteridge et al, 2010a; Betteridge, 2010b). A sampling grid for the 0.5 ha paddock was used based on GPS data for urine sensor output and defecation data. The data set was acquired by post-grazing mapping of faeces by GPS of 15 cows grazing the paddock over three days (each cell contains normalised data for time duration, representing cumulative time spent in each grid). Bright orange areas represent urination “hotspots”. The contour at the base plane represents the perimeter of the paddock boundary fence.
The time duration-normalised urine and faecal data is plotted in Figure 6(a) and is shown as an isometric projection in Figure 6(b). The relative prominence of the two dominant peaks rising over the background is more apparent in the case of Figure 6(b).
The twin peaks represent gathering sites for cows (narrow peak for urination and broad peak for defecation).
Figure 6(c) shows side elevation of the urine and faeces peaks in Figure 6(b), showing the degree of separation -- with plateaus revealing some indication of relative areas. The area enclosed by the contour represents nearly 50% of the rectangular grid. This area is the fenced area of the paddock and about 30% of this area contains the excretion patches within grid cells. The patch for defecation was at least 15% larger than that used for urination. This exercise demonstrates the power of visual analytics – as trends and clusters not apparent in the numerical data arrays can be more easily detected. In Figure 6(d), the transect represented by the diagonal line shows the difference between the estimated positions of the centre-of-mass positions for each gathering area, A and B (urine and faeces, respectively).
The information in Figures 6(a)-6(d) shows that, in this hill country environment, the locations of natural bodily functions were not randomly distributed, but subject to highly localised gathering points, with different sized areas involved. The areas involved provide inputs for a model-based approach for estimating nitrogen emissions due to urination (Betteridge, 2010a). gathering sites of cows. Bright orange areas represent gathering points for urination.
Figure 6(b). Isometric projection of time duration data with twin dominant peaks representing gathering sites for cows and areas of high excretion frequency and nitrogen emissions.
5. SUMMARY AND CONCLUSION
In addition to exploratory data analysis, the use of geo-visual analytics provides a means of coping with the real problem of
information overload by providing a decision support aid for human perceptions of important features in the data. It was demonstrated that information processing may expose grouping, or clustering effects, not easily gleaned from numerous data tables, and allows for instant viewing of trend data. The use of geo-visual analytics was also applied to a problem relevant to rural production systems. An issue confronting farmers is that the daily load of natural excreta of livestock adds to the nitrogen emissions affecting the local environment (Betteridge et al 2010a). Farmers in New Zealand require information on nitrogen losses in order to reduce emissions to meet local and international standards. Geo-visual analytics can provide information on animal behaviour and data for models estimating the quantity of nitrogen emissions involved. Analysis by data visualisation and feature extraction showed that urine and faecal excreta were not randomly distributed and, where gathering areas exist, can represent regions of high negative environmental impact. But where behaviour can be predicted, or known through local knowledge, targeting and mitigation may become a cost effective strategy. Modelling animal behaviour may be facilitated if the geo-visual analytics is incorporated into the framework of an agent-oriented model. Tracking and analysing animal movements in the environment supports landscape design and farming practices with possible economic impacts (product quality, stock numbers and profit),
1 3 thresholded (t = 0.80) and binarised to separate the peaks from the background. The transect (yellow line) shows the difference between the estimated centre-of-mass positions for each gathering area, A and B.
environmental impacts (soil quality and management of nitrogen emissions) and animal welfare (including longevity).
6. REFERENCES
ABS, 2010. Australian Bureau of Statistics, Data for 2007/08.
www.abs.gov.au. (Dec. 2010).
Andersson, M., Gudmundsson, J., Laube, P. and Wolle, T., 2008. Reporting Leaders and Followers among Trajectories of Moving Point Objects. GeoInformatica, 12, pp. 497-528.
Andrienko, N.V. and Andrienko, G.I., 2003. Interactive maps for visual data exploration. International J. of Geographical Information Science, 13, pp. 355-374.
Bederson, B.B., Shneiderman, B. and Wattenberg, M., 2002. Ordered and Quantum Treemaps: Making Effective Use of 2D Space to Display Hierarchies. ACM Trans Graphics, 21, pp. 833-854.
Benke, K.K., Skinner, D.R. and Woodruff, C.J., 1988. Convolution Operators as a Basis for Objective Correlates of Texture Perception. IEEE Trans. Sys., Man and Cybern., 18:158-163.
Benke, K.K. and Pelizaro, C., 2010. A spatial-statistical approach to the visualisation of uncertainty in land suitability analysis. Journal of Spatial Science, 55, pp. 257-272.
Benke, K.K., Pettit, C.J. and Lowell, K.E., 2011. Visualisation of spatial uncertainty in hydrological modelling. Journal of Spatial Science, 56, pp. 73-88.
Benkert, M., Gudmundsson, J., Hübner, F. and Wolle, T., 2008. Comput. Geometry - Theory and Applications, 41, pp. 11-125.
Betteridge, K., Costall, D., Balladur, S., Upsdell, M., Umemura, K., 2010a. Urine distribution and grazing behaviour of female sheep and cattle grazing a steep New Zealand hill pasture. Animal Production Science, 50, pp. 624-629.
Betteridge, K., 2010b. Seminar on logging and data distribution of animal urination and defecation at Lake Taupo, New Zealand. Presented at DPI Ellinbank, Victoria, Aust.(8 July).
Betteridge, K., Li, F., Costall, D., Roberts, A., Catto, W., Richardson, A., Gates, J., 2011. Targeting DCD at critical source areas as a nitrogen mitigation strategy for hill country farmers. In: Adding to the knowledge base for the nutrient manager. (Eds L.D. Currie and C.L. Christensen).
http://flrc.massey.ac.nz/publications.html. Occasional Report No. 24. Fertilizer and Lime Research Centre, Massey University, Palmerston North, New Zealand. [13 pages].
Brown, D. G., Riolo, R., Robinson, D. T., North, M., Rand, W., 2005. Spatial process and data models: Toward integration of agent-based models and GIS. J. Geog. Sys. 7(1), pp. 25-47.
Buchin, K., Buchin, M. and Gudmundsson, J., 2008. Detecting Single File Movement. Proc 16th ACM GIS, pp. 288-297.
Cartwright, W., Miller, S. and Pettit, C., 2004. Geographic Visualisation: Past, Present and Future Development. Journal of Spatial Science, 49, pp. 25-36.
Dataviz. 2010. Improving Visualisation for the Public Sector, Communities and Local Government, OCSI,
http://www.improving-visualisation.org/visuals. May 2010.
Djordjevic, B., Gudmundsson, J., Pham, A. and Wolle, T. 2008. Detecting Regular Visit Patterns. Proc. 16th ESA, pp. 344-355.
FA, 2008. “Temperature has big impact on grazing patterns, Farming Ahead”, November 2008, No.202,
www.farmingahead.com.au. (Dec. 2010)
Gudmundsson, J., Laube, P. and Wolle, T., (2008). Movement Patterns in Spatio-Temporal Data, In: Encycl. of GIS, Eds. Shekhar, S. and Xiong, H., Springer, NY.
Johnson, R. A. (2007). Advanced Euclid. Geom., Dover, UK.
Kantardzie, M. 2003. Data Mining: Concepts, Models, Methods, and Algorithms. IEEE Press, NY.
Kreveld, M. van, Speckmann, B. and Gudmundsson, J., 2007. Efficient detection of Motion Patterns in Spatio-Temporal data Sets. GeoInformatica, 11(2), 195-215.
Laube, P. and Dennis, T., 2006. Exploratory Analysis of Movement Trajectories. GeoCart 2006, National Cartographic Conference, 4th – 6th September, 2006, Auckland, NZ.
Mayer, D.G., Davison, T.M., McGowan, M.R., Young, B.A., Matschoss, A.L. Goodwin, P.J., Johnson, N.N. and Gaughan, J.B., 1999. Extent and Economic Effect of Heat Loads on Dairy Cattle Production in Australia. Aust. Vet. J., 77, pp. 804-808.
Mucherino, A., Papajoirgji, P. and Pardalos, P. 2009. Data Mining in Agriculture, Springer, Berlin.
Wilensky, U., 1999. NetLogo. (Center for Connected Learning and Computer-Based Modeling, Northwestern University. Evanston, IL (USA).
7. ACKNOWLEDGEMENTS
The authors thank Matthew Robertson and Joe Jacobs from DPI for advice.
APPENDIX
Schematic diagram of an Agent Based Model (ABM) for simulating space-time behaviour of grazing animals.
Meteorological Data
Remote Sensing (GPS, Satellite,
UAV)
Land Data
MULTI-AGENT MODEL
(Main Program)
Behaviour Rules (Animal)
Output Data
Plots, Maps, Statistics
Risk Assessment and Uncertainty
Performance Indicators
Simulation
Start
Inputs Algorithms