DEFORMATION MONITORING OF RETROFITTED SHORT CONCRETE COLUMNS
WITH LASER SENSOR
E. Ö. Avsar a, *, M. F. Celik a, E. Binbir a, A. E. Arslan a, D. Çokkeçeci a, D. Z. Seker a, S. Pala a
a ITU, Civil Engineering Faculty, 34469 Maslak Istanbul, Turkey - (avsarem, arslanad, seker, pala)@itu.edu.tr,
[email protected], [email protected], [email protected]
Commission V, WG V/5
KEY WORDS: Concrete Column, Laser Sensor, Deformation, Monitoring
ABSTRACT:
This paper presents one of the applications of monitoring mechanical tests carried out in Construction Materials Laboratory of Istanbul Technical University. In Turkey, as in many countries, large amount of existing buildings exposed to seismic hazard, therefore various analytical and experimental studies are being conducted to contribute to the solution of the problem. One of the new generation retrofitting techniques is to strength the structural members by using Fiber Reinforcing Polymer (FRP). This study summarize the results of monitoring of deformations short concrete column samples under the incremental compression load. In this study, result of two rectangular short columns are given. One of them was tested as a reference sample, the other sample were tested after strengthening by PET reinforced polymer composite materials. Besides conventional displacement and strain measurement systems, laser scanning method was used to get three dimensional deformed shape of sample at each selected steps.
* Corresponding author
1. INTRODUCTION
Since earthquake is one of the common problems of humanity; applications of structural strengthening maintains its importance in the scientific studies. In Turkey, as in many countries, large amount of existing buildings exposed to seismic hazard, therefore various analytical and experimental studies are being conducted to contribute to the solution of the problem. Considering the amount of hazardous buildings and infrastructure which have insufficient seismic safety; it is obvious that source and time are so limited for reconstruction. Therefore, some of them should be retrofitted by using conventional and new generation methods. Besides of increasing load carrying capacity, increasing deformation capacity of structure is very important to keep the integrity of structure. This means, if total collapse of building can be prevented, people can be survived during a catastrophic earthquake.
One of the new generation retrofitting techniques is to strength the structural members by using Fiber Reinforcing Polymer (FRP). FRP are used in many different field such as marine, automotive, transportation, wind energy, construction and architectural applications. Especially, around 15-20 years ago FRP was started to use in civil engineering field to increase load carrying and deformation capacities.
The solid materials are exhibited lateral expansion depending on axial shortening due to applied unidirectional axial loads. If lateral expansion was restrained in any way, load carrying and/or deformation capacity can be increase and the failure can be delayed depend on some parameters such as shape. In this study, PET fabric polymer composite was used for this purpose as a strengthening material.
For strengthening process, PET fabric which was wetted by epoxy matrix was wrapped to lateral surface of a rectangular sample. A composite material can be obtained after the curing process of epoxy.
This study summarize the results of monitoring of deformations short concrete column samples under the incremental compression load. The tests conduct based on displacement controlled to observe the behaviour of the sample under the incremental loads. Since the tests are consecutively implemented for the sample which have been strengthened by different applications of FRP, a local network was established at the test zone. Terrestrial laser scanner was set at different locations to obtain the 3D geometric data of any sample according to local coordinate system.
In this study, result of two rectangular short columns are given. One of them was tested as a reference sample, the other sample were tested after strengthening by PET reinforced polymer composite materials. Besides conventional displacement and strain measurement systems, laser scanning method was used to get three dimensional deformed shape of sample at each selected steps.
2. DATA ACQUISITION AND PROCESS
intervals are generated to examine regional deformations on both sides.
2.1 Data Acquisition
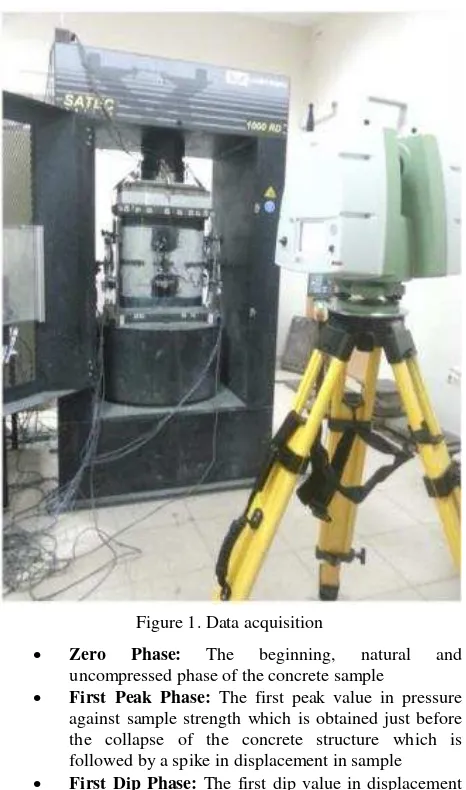
To obtain the point cloud data of the samples, the samples are scanned with Leica C10 Terrestrial Laser Scanner. The Leica C-10 is a fast mid-range laser scanner works with the basic distance measurement principle of “time of flight”. A laser beam is sent to the object while instantaneously recording the departure and reacquisition times of the beam and the horizontal and vertical angles of the optical system during the aforementioned instant. The determined distance along with the horizontal angle in the local coordinate system of the instrument and the vertical angle are combined with the distances and then converted to coordinates (X, Y and Z). This data is then stored with the intensity which is directly related to the incidence angle of the beam to the surface and returning signal strength.
The tests on concrete samples are carried out with a satec 1000rd Hydraulic Compression Tester (Figure 1). The structure of instrument required that two setups (front and back of the instrument, hence the concrete sample) for each significant phase of the testing process which are:
Figure 1. Data acquisition
Zero Phase: The beginning, natural and uncompressed phase of the concrete sample
First Peak Phase: The first peak value in pressure against sample strength which is obtained just before the collapse of the concrete structure which is followed by a spike in displacement in sample First Dip Phase: The first dip value in displacement strength of the reinforcement material (PET, Aramid etc.) which is followed by an increase in displacement up to the point of total collapse of the sample. Final (Second Dip) Phase: The ending phase of the from two sides of the sample had to be registered in a common coordinate system. For registration Leica Cyclone software is used in order to determine the transformation parameters and apply them to the point clouds in order to register two sides every sample to the same coordinate system. This allows us to obtain a 3 dimensional point cloud of the sample (Figure 2).
After registration the point clouds of samples are “cleaned” in a way to leave the samples only without the data from the room
In order to be able to perform a volume computation on a point cloud using cyclone, a mesh needs to be created first to form a solid shape. Mesh is a series of adjacent triangles that are created using the points in a point cloud, vertices, polylines, or any combinations of the three as vertices. For each adjacent trio of points in a cloud, a triangle is created. In cyclone interface there are three options to create a mesh:
rectangular prisms. The basic volume calculation method is to calculate the volume of a given surface from a reference plane. The volume is calculated either above or below the reference plane. The definition of reference plane in Cyclone is completely user interacted and supervised so that user can set the origin of the reference plane. Therefore, users can determine the height of the plane. This allowed us to calculate the volumes of the shapes that are created by TIN algorithms by defining a reference plane for the sample model. If the TIN is used both – the volume below and above the reference plane – is calculated. The result is given as “Cut Volume” and “Fill Volume” (Pflipsen, 2006).
2.4 Cross-Section
The second parameter that is imperative along the volume change of the sample is the lateral expansion since it is crucial for modelling the behaviour of both the concrete sample and the reinforcement materials under load and against displacement. To provide a sufficient baseline for this sort of modelling cross sections along the three dimensional models have been created with 5 cm intervals (Figure 3).
Figure 3. Reference (left) and sample C306P (right)
3. CONCLUSION
The graphs of two samples that shows their behaviours under incremental axial loads are given below (Figure 4 and 5). Both the behaviours of C30_6P and C30 reference samples were observed at total 7 phases during test.
The first phase has been set as just before starting the test, in other words preloading situation, for both samples.
The second phase has been set as almost the half of the estimated peak stress in linear–elastic region for C30_6P sample.
The third phase of C30_6P has been set as the first peak stress. This peak is mostly related with behaviour of concrete.
The fourth phase of C30_6P has been set as after observing the second peak stress.
The fifth phase of C30_6P has been set as after observing great strain.
The sixth phase of C30_6P has been set as just after the biggest and last peak stress. Unfortunately, since it is difficult to catch last stress peak the sixth phase cannot be arranged just before the last stress peak. On the other hand it includes high risk for scanning devices since the sample was expected to suddenly explode at the last peak stress.
The last phase has been set as just after finishing the test for the both samples.
The second, third, fourth and fifth phase of C30 reference samples were placed between zero to peak stress. The concrete behaviour under compressive stress has only one peak, since it breaks apart and has no reinforcement material to cause a second peak on the stress graph. It is very difficult to catch the peak stress. The stress on concrete samples decreases sharply just after the peak.
The sixth phase of C30 reference samples has been set as right after the peak stress.
Figure 4. The relationship between compressive stress and strain for C30_6P sample with 7 scanning phase
Figure 5. The relationship between compressive stress and strain for C30 reference sample with 7 scanning phase
The deformation capability of samples can be seen on Figure 4 and Figure 5. The deformation can be observed by using scanning result as visually and numerically (Figure 6).
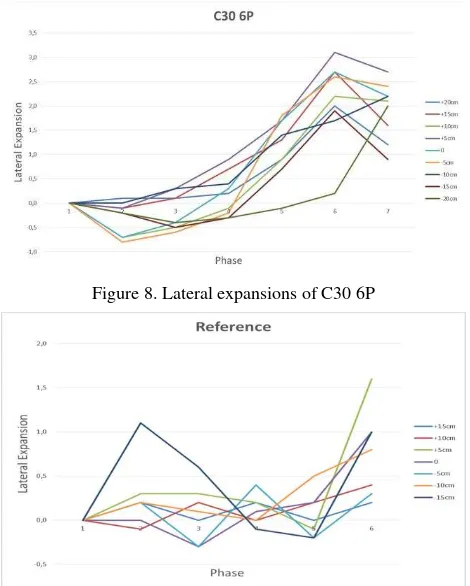
As mentioned before in order to provide a reference a non-reinforced sample has been put under the testing process and results are compared with the reinforced sample. The lateral expansion values at the centrelines of the sections at every phase are examined (Figure 7).
Figure 7. Cross sections
Lateral expansions obtained for both reference and C30 6P samples’ are shown in graph 8 and graph 9.
Figure 8. Lateral expansions of C30 6P
Figure 9. Lateral expansions of reference
C30_6P
Displacement (mm) Pressure (kN)
Conventional Laser
Scanning
C30-6P Back
C30-6P Front
0.00 0.00 0 0
1.97 2.00 1001 912
3.91 4.00 1950 2259
6.62 7.00 2351 2053
18.14 18.00 2060 2351
35.50 35.00 1937 1817
Table 1. Shortening of C30 6P
The shortening of the samples under load were also determined according to gathered data. A conventional system also
monitored the shortening to give an accuracy for the laser scanner data (Table 1, Figure 10).
Figure 10. Shortening of C30 6P according to pressure
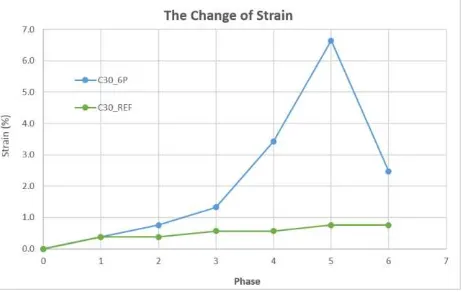
The strain levels at the second scanning phase, alias Phase 1, are very close for both samples (Figure 6). Because stress levels are not so different and there is no any contribution of retrofitting yet in this linear-elastic region for C30_6P sample.
In this study, the strain means the ratio of shortening to the first height of sample. When the locations of the scanning stations are considered, about 0.8 % shortening can be obtained up to failure for the reference sample and about 6.6 % shortening can be obtained up to failure for C30_6P sample. This result shows that the retrofitting increased about 8 times the deformation capacity of sample.
Moreover if the phase 5, alias unloading scanning phase, and the phase 6, alias the scanning phase after removing all load, are compared for both samples, the changing of elastic and plastic deformation behaviours of the samples can be observed. While the deformation of C30_REF remains the same, some part of the deformation of C30_6P decreased back thanks to retrofitting between the last two phases.
The changings of volume which is depend on the vertical shortening and lateral expansion of the samples can be seen in Figure 11.
Figure 11. Change of volume for both samples
for C30_REF. In general, the changing of volume was gradually increased for C30_6P.
In conclusion, the retrofitting of the sample with PET, (and with other possibly promising materials such as aramid, carbon fibre, fibre glass for the future works) proven that the sample, although below the conventional column standards, have shown improved elastic abilities compared to its conventional counterpart which is a promising result for further expansion of the research. There is also a fact that after the comparison of the results from the Satec 1000rd Hydraulic Compression Tester interface and Leica C-10 Laser Scanner results in displacement and lateral expansion values, Laser scanning proves that to be a very effective method in order to visualise and geometrically evaluate the parametric data from Satec 1000rd.
REFERENCES
Benli, G. And Özer, D. G. (n.d.). Use of laser scanning for cultural heritage documentation, International Journal Of Electronics; Mechanical And Mechatronics Engineering, 3(1), 447-454
Boehler, W., Bordas, V., and Marbs, A. Investigating laser scanner accuracy, XIXth CIPA Symposium, 30 September–4 October 2003, Antalya, Turkey, 2003.
Fraunhofer Institute for Factory Operation and Automation IFF. (2015). Laser Scanning Guidelines for Plant and Industry Preparation and Execution of Laser Scanning Projects for Industrial Plant Design and Documentation. Magdeburg: Prof. Michael Schenk
National Oceanic and Atmospheric Administration. (2012). An Introduction to Lidar Technology, Data, and Applications.
Retrieved from
https://coast.noaa.gov/digitalcoast/_/pdf/lidar101.pdf
Pflipsen, B. (2006). Volume computation: A comparison of total station versus laser scanner and different software. Unpublished master’s thesis. Retrieved from http://www.divaportal.org/smash/record.jsf?pid=diva2%3A120 447&dswid=4837
Reshetyuk, Y., Horemuz, M. and Sjöberg, L. E., (2005). Determination of the optimal diameter forspherical targetsused in 3D laser scanning, Survey Review, 38, 297