Mimi Halimin +62-21-515-1140 [email protected] To subscribe to our Daily Focus, please contact us at [email protected]
Monthly domestic cement consumption
Source: ASI, Daewoo Securities Research
June 15, 2016
Cement: Positive catalyst needed
Domestic May cement consumption: +6% YoY, +13% MoM
Konsumsi semen nasional untuk bulan Mei +6,2% YoY menjadi 5.1mn ton. Kenaikan yang signifikan di bulan Mei sejalan dengan tren tahun sebelumnya yang menunjukkan konsumsi semen yang lebih tinggi pada bulan Mei. Secara kumulatif, konsumsi semen domestik selama 5M16 naik 3,9% YoY.
SMGR - Positive signs from volume but ASP is still weak
SMGR mencatat volume penjualan domestik 2.1mn ton pada Mei 2016 (+6,7% YoY atau +7,3% MoM). Kumulatif 5M16, SMGR mencatat 10.0mn ton atau tumbuh 1,0% YoY. Kami melihat bahwa persaingan di produsen semen tetap sengit ditambah dengan lebih tingginya pertumbuhan dari semen curah menjadikan ASP tertekan. SMGR hanya mencatat domestik ASP (excl. TLCC) IDR808,752 di Mei 2016 (-0.1% MoM atau -7,4% YoY).
INTP - Competition remains fierce and INTP is losing its market share
Banyaknya pemain semen baru yang terletak di daerah Jawa Barat membuat INTP menderita banyak dari kompetisi ini. INTP mencatat 1.4mn ton volume penjualan domestik Mei 2016 (-5,2% YoY atau +17,2% MoM). Meskipun penjualan Mei jauh lebih tinggi dari penjualan bulan April, INTP hanya membukukan 6.5mn ton volume penjualan domestik di 5M16 atau masih turun 3,2% YoY. Persaingan yang ketat ini menyebabkan tren pangsa pasar INTP menurun. Kami berpikir bahwa INTP akan bertarung untuk mendapatkan pangsa pasar kembali, sehingga kami menduga INTP akan ikut dalam perang harga.
Secara keseluruhan, kami melihat peningkatan penjualan volume semen pada bulan Mei adalah sesuai siklus. Kami kembali memberikan rekomendasi Underweight untuk sektor semen karena kami belum melihat adanya peningkatan yang signifikan dalam penjualan semen domestik hingga Mei.
Market Index
Last Trade Chg (%) MoM YoY
JCI 4,821.6 0.3 1.0 -0.6
MSCI Indonesia 22.7 0.0 2.3 -3.8
MSCI EM 803.1 -0.8 1.7 -16.6
HANG SENG 20,387.5 -0.6 4.0 -23.6
KOSPI 1,972.0 -0.5 0.3 -3.4
FTSE 5,923.5 -2.1 -1.5 -9.9
DJIA 17,674.8 -0.3 1.1 -0.3
NASDAQ 4,843.6 -0.1 2.8 -3.6
Valuation
2016F P/E (x) P/B (x) ROE (%)
JCI 15.3 2.3 18.4
Key Rates
Last Trade Chg (bps) MoM YoY
Policy Rate 6.75 0 0 -75
3yr 7.28 -4 -35 -108
10yr 7.65 1 -7 -101
FX
Last Trade Chg (%) MoM YoY
USD/IDR 13,393.00 0.7 -0.1 -0.2
USD/KRW 1,173.23 0.0 -0.5 5.0
USD/JPY 106.11 -0.1 -2.7 -14.0
USD/CNY 6.60 0.4 1.0 6.1
Commodities
Last Trade Chg (%) MoM YoY
WTI 48.5 -0.8 3.4 -22.3
Gold 1,285.7 0.1 0.9 8.4
Coal 39.5 -0.3 -9.5 -5.8
Palm Oil 662.5 0.0 -0.4 1.5
Rubber 114.8 0.0 -15.2 -16.2
Nickel 8,885.0 -0.1 2.8 -31.4
Copper 4,510.5 -1.0 -2.5 -22.4
Tin 16,950.0 -0.1 1.9 14.7
JCI Index VS MSCI Emerging Markets
650 800 950 1,100
3,500 4,500 5,500
04/13 01/14 10/14 07/15 04/16
(pt) JCI MSCI EM (pt)
5.2
4.5 4.8
4.6 5.1
3.0 3.5 4.0 4.5 5.0 5.5 6.0 6.5 7.0
January March May July September November
2016 2015 2014
(mn tons)
Local flashes
UNVR: Unilever Indonesia bagikan dividen total Rp5,84 triliun. PT Unilever Indonesia Tbk. membagikan dividen total sebesar Rp5,84 triliun atau setara Rp766 per saham untuk tahun buku 2015. "Dividen naik Rp14 per saham bila dibandingkan dengan dividen tahun buku 2014," kata Direktur sekaligus Sekretaris Perusahaan Unilever Indonesia Sancoyo Antarikso. Sebelumnya, UNVR telah membagikan dividen interim Rp342 per saham atau Rp2,6 triliun pada Desember tahun lalu. Adapun sisanya Rp424 per saham atau setara Rp3,23 triliun akan dibagikan sebelum 15 Juli tahun ini. (Bisnis Indonesia)
TBIG: Tower Bersama yakin raup pendapatan Rp1,2 triliun di semester I. PT Tower Bersama Infrastructure Tbk (TBIG) yakin kinerja keuangan tahun ini bisa tumbuh positif.
Bahkan perseroan yakin bisa meraup pendapatan di semester I-2016 mencapai Rp1,2 triliun. Direktur Keuangan TBIG Helmy Yusman Santoso mengaku, pihaknya yakin target tersebut bisa tercapai lantaran hingga kuartal I-2016 pendapatan perseroan sudah mencapai Rp901 miliar. (Okezone)
AALI: Astra Agro siapkan Rp 500 miliar bangun pabrik. Tidak banyak ekspansi yang bakal dilakukan oleh PT Astra Agro Lestari Tbk (AALI) sepanjang tahun ini. Anak usaha PT Astra International Tbk (ASII) ini hanya berencana menambah satu pabrik di wilayah Sulawesi. "Kami siapkan sekitar Rp 500 miliar untuk pabrik ini," ujar Direktur AALI Rudy.
Proses pembangunannya akan segera dilakukan tahun ini. Diharapkan, tahun depan, pabrik ini bisa mulai beroperasi. (Kontan)
POWR: Cikarang Listrindo gandeng GE garap PLTG US$ 800 juta. PT Cikarang Listrindo Tbk (POWR), emiten kelima yang mencatatkan sahamnya di Bursa Efek Indonesia (BEI) pada tahun ini, tengah mengerjakan beberapa proyek pembangkit listrik.
Salah satunya proyek Pembangkit Listrik Tenaga Gas (PLTG) di kawasan industri Megalopolis Manunggal, Cikarang, Jawa Barat. Direktur Keuangan Cikarang Listrindo Christanto Pranata mengatakan, kapasitas pembangkit listrik ini mencapai 1.100 Mega Watt (MW) sampai dengan 1.400 MW. Perseroan sudah menggandeng General Electric (GE) untuk menggarap proyek senilai US$ 800 juta itu. (Kontan)
PTBA: Bukit Asam incar 5.000 MW proyek kelistrikan pemerintah. PT Bukit Asam (Persero) Tbk membidik porsi 15% dari program kelistrikan pemerintah sebesar 35.000 megawatt (MW). Direktur Utama PT Bukit Asam (Persero) Arviyan Arifin mengatakan, perusahaan membidik 5.000 MW atau sekitar 15% dari tender-tender pemerintah yang sedang bergulir. Salah satunya melalui anak perusahaan PT Huadian Bukit Asam Power telah memenagkan tender PLTU Sumsel 8 dengan kapasitas 2x 620 Megawatt. (Kontan) BHIT: MNC bidik proyek PLTU Sumsel 6. MNC Grup melalui induk perusahaan investasi, PT MNC Investama Tbk(BHIT) membidik proyek pembangkit listrik mulut tambang (mine mouth) di Sumatera Selatan (Sumsel). Wakil Direktur Utama BHIT Darma Putra mengatakan, kondisi batubara yang tengah lesu mendorong perseroan mencari proyek investasi lain yang lebih menjanjikan, salah satunya adalah proyek power plant. Dalam waktu dekat, BHIT berencana mengikuti tender Pembangkit Listrik Tenaga Uap (PLTU) Sumsel 6 berkapasitas 2 x 300 Mega Watt (MW). (Kontan)
DKFT: Central Omega kembali bangun pabrik smelter Rp4,55 triliun. Emiten pertambangan PT Central Omega Resources Tbk. berekspansi dengan memperluas pabrik pemurnian dengan kapasitas produksi hingga 300.000 ton nikel senilai US$350 juta setara dengan Rp4,55 triliun. Kiki Hamidjaja, Direktur Utama Central Omega Resources, mengatakan perluasan pabrik smeltertahap II akan dilakukan mulai kuartal II/2018. Pembangunan pabrik smelter tahap I diproyeksi rampung akhir tahun ini dan mulai berproduksi pada 2017. (Bisnis Indonesia)
3
Technical analysis
Tasrul +62-21-515-1140 [email protected]
Jakarta Composite Index (JCI) – Consolidation
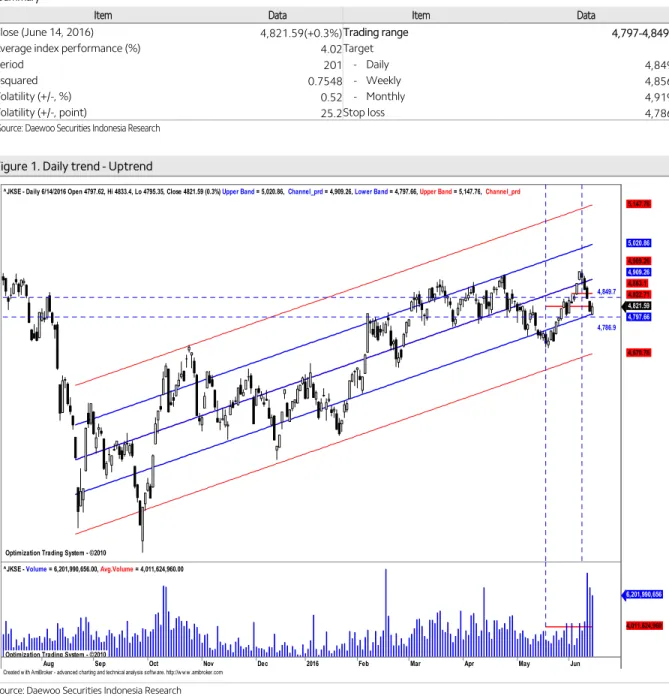
IHSG akan coba bertahan di atas lower band pada uptrend channel.
IHSG saat masih dalam pola uptrend yang relatif valid yang dimulai sejak selama 201 hari terakhir dengan r-squared = 0.7548 dan bergerak dalam rentang +/- 1.16 std.deviasi dari center line. Peluang IHSG bergerak di luar pergerakan normalnya sekitar 24.52 % atau sekitar 49 bar chart. Volatilitas normal pergerakan IHSG saat ini sebesar +/-0.52%
atau sekitar +/-25.2 point. Saat ini IHSG akan coba bertahan diatas lower band pada uptrend channel untuk mampu naik minimal ke level 4,849 sebagaimana terlihat pada Figure 1.
Summary
Item Data Item Data
Close (June 14, 2016) 4,821.59(+0.3%)Trading range 4,797-4,849
Average index performance (%) 4.02Target
Period 201 - Daily 4,849
r-squared 0.7548 - Weekly 4,856
Volatility (+/-, %) 0.52 - Monthly 4,919
Volatility (+/-, point) 25.2Stop loss 4,786
Source: Daewoo Securities Indonesia Research
Figure 1. Daily trend - Uptrend
Source: Daewoo Securities Indonesia Research
Created w ith AmiBroker - advanced charting and technical analysis softw are. http://w w w .amibroker.com Optimization Trading System - ©2010
Optimization Trading System - ©2010 Optimization Trading System - ©2010 Optimization Trading System - ©2010
4,849.7
4,786.9
^JKSE - Daily 6/14/2016 Open 4797.62, Hi 4833.4, Lo 4795.35, Close 4821.59 (0.3%) Upper Band = 5,020.86, Channel_prd = 4,909.26, Lower Band = 4,797.66, Upper Band = 5,147.76, Channel_prd
4,821.59 4,797.66
4,670.76 4,822.71 4,863.1 4,909.26 4,909.26 5,020.86 5,147.76
Aug Sep Oct Nov Dec 2016 Feb Mar Apr May Jun
Optimization Trading System - ©2010
^JKSE - Volume = 6,201,990,656.00, Avg.Volume = 4,011,624,960.00
6,201,990,656
4,011,624,960
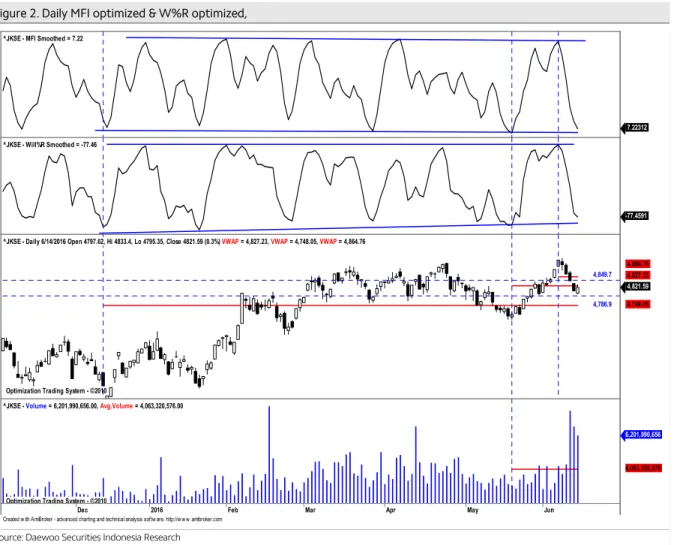
Aliran dana keluar mulai tertahan dengan volatilitas cenderung turun terbatas.
Pada Figure 2, terlihat dari hasil optimalisasi terakhir, indikator MFI Optimized dan indikator W%R Optimized saat ini cenderung turun menguji support trendline dengan volume naik signifikan dan tembus rata-rata. Hal ini mengindikasikan masih terlihatnya potensi koreksi lebih lanjut namun sudah mulai terbatas. Resistance terdekat di 4,849 dan support di 4,797. Stop loss level di 4,786.
Figure 2. Daily MFI optimized & W%R optimized,
Source: Daewoo Securities Indonesia Research
Created w ith AmiBroker - advanced charting and technical analysis softw are. http://w w w .amibroker.com
^JKSE - MFI Smoothed = 7.22
7.22312
^JKSE - Will%R Smoothed = -77.46
-77.4591
Optimization Trading System - ©2010 Optimization Trading System - ©2010 Optimization Trading System - ©2010
4,849.7
4,786.9
^JKSE - Daily 6/14/2016 Open 4797.62, Hi 4833.4, Lo 4795.35, Close 4821.59 (0.3%) VWAP = 4,827.23, VWAP = 4,748.05, VWAP = 4,864.76
4,821.59 4,748.05 4,827.23 4,864.76
Dec 2016 Feb Mar Apr May Jun
Optimization Trading System - ©2010
^JKSE - Volume = 6,201,990,656.00, Avg.Volume = 4,063,320,576.00
6,201,990,656
4,063,320,576
5 IHSG akan coba bertahan sekitar rata-rata masing-masing periode.
IHSG saat ini akan mencoba mendekati resistance normal rata-rata periode daily (resistance 2). Sementara itu untuk periode weekly dan monthly masih berada sedikit di bawah rata-rata. Tanda-tanda bottom reversal diperkirakan mulai terlihat, jika hari ini IHSG mampu bertahan diatas rata-rata periode weekly , yakni sekitar level 4,823, sebagaimana terlihat pada Figure 3,4 dan 5.
Figure 3. Daily, target : 4,849 Figure 4. Weekly, target : 4,856 Figure 5. Monthly,target : 4,919
x
Source: Daewoo Securities Indonesia Research Source: Daewoo Securities Indonesia Research Source: Daewoo Securities Indonesia Research
Created w ith AmiBroker - advanced charting and technical analysis softw are. http://w w w .amibroker.com
^JKSE - Daily 6/14/2016 Open 4797.62, Hi 4833.4, Lo 4795.35,
4,821.59 4,811.99 4,799.39 4,786.79 4,774.19 4,761.59 4,824.59 4,837.19 4,849.79 4,862.39
Apr May Jun
Optimization Trading System - ©2010
^JKSE - Volume = 6,201,990,656.00, Avg.Volume = 4,063,320,576.00 6,201,990,656
4,063,320,576
Created w ith AmiBroker - advanced charting and technical analysis softw are. http://w w w .amibroker.com
^JKSE - Weekly 6/14/2016 Open 4838.02, Hi 4838.02, Lo
4,821.59 4,789.84 4,756.44 4,723.03 4,689.63 4,823.25 4,856.65 4,890.05 4,923.46 4,956.86
Oct 2016 Apr
Optimization Trading System - ©2010
^JKSE - Volume = 12,957,971,456.00, Avg.Volume = 17,274,497,024.00
12,957,971,456 17,274,497,024
Created w ith AmiBroker - advanced charting and technical analysis sof tw are. http://w w w .amibroker.com
^JKSE - Monthly 6/14/2016 Open 4801.85, Hi 4940.1, Lo
4,821.59 4,760.19 4,680.65 4,601.11 4,521.57 4,839.72 4,919.26 4,998.8 5,078.33 5,157.87
2014 2015 2016
Optimization Trading System - ©2010
^JKSE - Volume = 45,946,044,416.00, Avg.Volume = 67,747,483,648.00
45,946,044,416 67,747,483,648
Stocks on our focus list
Charoen Pokphand Indonesia (CPIN)-Trading Buy
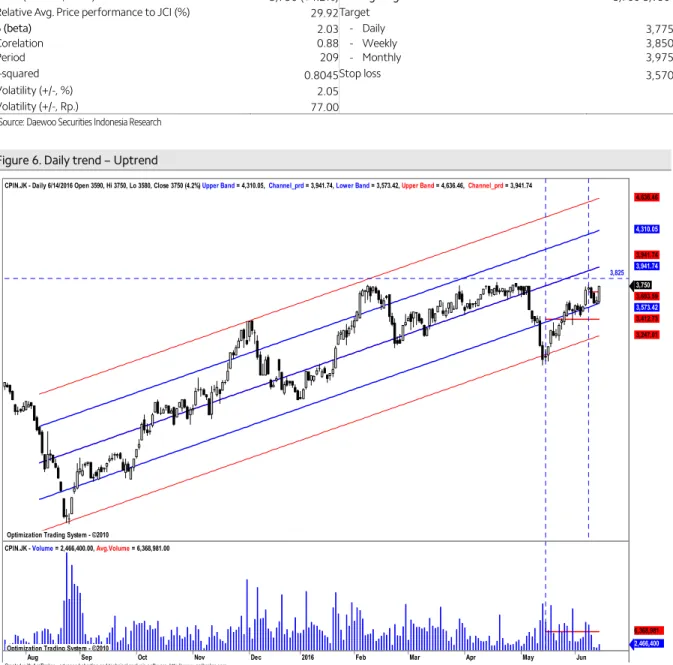
Harga akan coba naik mendekati centerline pada uptrend channel.
Secara umum harga saham ini juga masih bergerak dalam pola uptrend yang masih relatif valid (r-squared = 0.8045) selama 209 hari terakhir dan bergerak dalam rentang +/- 1.3 std.deviasi dari center line. Peluang harga keluar dari pergerakan normalnya sekitar 19.5 % (sekitar41 bar chart ). Volatilitas normal pergerakan harga saham ini sepanjang uptrend channel sebesar +/-2.05 % atau sekitar +/- 77 (potensi naik dan turun secara normal maksimum/minimum sebesar 75-80 rupiah) dari level penutupan kemarin. Saat ini harga akan coba naik mendekati centerline pada uptrend channel,sebagaimana terlihat pada Figure 6.
Summary
Item Data Item Data
Close (June 14, 2016) 3,750 (+4.2%)Trading range 3,700-3,950
Relative Avg. Price performance to JCI (%) 29.92Target
β (beta) 2.03 - Daily 3,775
Corelation 0.88 - Weekly 3,850
Period 209 - Monthly 3,975
r-squared 0.8045 Stop loss 3,570
Volatility (+/-, %) 2.05
Volatility (+/-, Rp.) 77.00
Source: Daewoo Securities Indonesia Research
Figure 6. Daily trend – Uptrend
Source: Daewoo Securities Indonesia Research
Created w ith AmiBroker - advanced charting and technical analysis softw are. http://w w w .amibroker.com Optimization Trading System - ©2010
Optimization Trading System - ©2010 Optimization Trading System - ©2010 Optimization Trading System - ©2010
3,825 CPIN.JK - Daily 6/14/2016 Open 3590, Hi 3750, Lo 3580, Close 3750 (4.2%) Upper Band = 4,310.05, Channel_prd = 3,941.74, Lower Band = 3,573.42, Upper Band = 4,636.46, Channel_prd = 3,941.74
3,750 3,693.59 3,573.42 3,412.73 3,247.01 3,941.74 3,941.74 4,310.05 4,636.46
Aug Sep Oct Nov Dec 2016 Feb Mar Apr May Jun
Optimization Trading System - ©2010
CPIN.JK - Volume = 2,466,400.00, Avg.Volume = 6,368,981.00
2,466,400 6,368,981
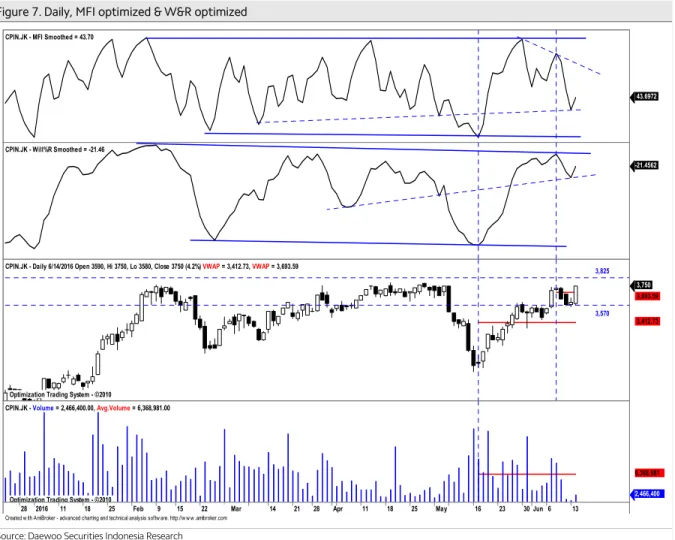
7 Aliran dana masuk dengan volatilitas kenaikan harga masih terlihat.
Pada Figure 7, terlihat dari hasil optimalisasi dari indikator MFI Optimized dan indikator W%R Optimized masih cenderung naik lebih lanjut namun masih kurang dukungan volume yang masih di bawah rata-rata. Level 3,825 adalah resistance terdekat. Support terdekat saat ini di 3,570 yang sekaligus sebagai stop loss level.
Figure 7. Daily, MFI optimized & W&R optimized
Source: Daewoo Securities Indonesia Research
Created w ith AmiBroker - advanced charting and technical analysis softw are. http://w w w .amibroker.com CPIN.JK - MFI Smoothed = 43.70
43.6972
CPIN.JK - Will%R Smoothed = -21.46
-21.4562
Optimization Trading System - ©2010 Optimization Trading System - ©2010
3,825
3,570 CPIN.JK - Daily 6/14/2016 Open 3590, Hi 3750, Lo 3580, Close 3750 (4.2%) VWAP = 3,412.73, VWAP = 3,693.59
3,750 3,693.59 3,412.73
28 2016 11 18 25 Feb 9 15 22 29Mar 14 21 28 Apr 11 18 25 May 16 23 30 Jun 6 13
Optimization Trading System - ©2010
CPIN.JK - Volume = 2,466,400.00, Avg.Volume = 6,368,981.00
2,466,400 6,368,981
Harga akan coba bertahan diatas resistance 1 periode daily,weekly, dan monthly.
Potensi kenaikan harga saham ini naik lebih lanjut masih terbuka, jika harga mampu bertahan minimal diatas periode resistance 1 periode daily,weekly dan monthly dengan target berikutnya ke resistance 3 untuk periode daily dan resistance 2 untuk periode weekly dan monthly, sebagaimana terlihat pada Figure 8,9 dan 10.
Figure 8. Daily ,target : 3,775 Figure 9. Weekly, target : 3,850 Figure 10. Monthly, target : 3,975
Source: Daewoo Securities Indonesia Research Source: Daewoo Securities Indonesia Research Source: Daewoo Securities Indonesia Research
Created w ith AmiBroker - advanced charting and technical analysis softw are. http://w w w .amibroker.com CPIN.JK - Weekly 6/14/2016 Open 3580, Hi 3750, Lo 3560,
3,750 3,660 3,568.29 3,476.57 3,384.86 3,293.14 3,751.71 3,843.43 3,935.14 4,026.86
Oct 2016 Apr
Optimization Trading System - ©2010
CPIN.JK - Volume = 3,863,400.00, Avg.Volume = 29,772,340.00
3,863,400 29,772,340
Created w ith AmiBroker - advanced charting and technical analysis softw are. http://w w w .amibroker.com CPIN.JK - Daily 6/14/2016 Open 3590, Hi 3750, Lo 3580,
3,750 3,744.5 3,706 3,667.5 3,629 3,590.5 3,552 3,513.5 3,783 3,821.5
Apr May Jun
Optimization Trading System - ©2010
CPIN.JK - Volume = 2,466,400.00, Avg.Volume = 6,368,981.00
2,466,400 6,368,981
Created w ith AmiBroker - advanced charting and technical analysis sof tw are. http://w w w .amibroker.com CPIN.JK - Monthly 6/14/2016 Open 3500, Hi 3760, Lo 3440,
3,750 3,733.25 3,612.5 3,491.75 3,370.99 3,250.24 3,129.49 3,854.01 3,974.76 4,095.51
2014 2015 2016
Optimization Trading System - ©2010
CPIN.JK - Volume = 44,130,200.00, Avg.Volume = 140,023,328.00
44,130,200 140,023,328
9 Indika Energy (INDY)-Trading Buy
Harga akan coba bertahan diatas normal lower band pada uptrend channel.
Secara umum harga saham ini juga masih bergerak dalam pola uptrend yang masih relatif valid (r-squared = 0.9303) selama 89 hari terakhir dan bergerak dalam rentang +/- 1.83 std.deviasi dari center line. Peluang harga keluar dari pergerakan normalnya sekitar 6.97 % (sekitar 6 bar chart ). Volatilitas normal pergerakan harga saham ini sepanjang uptrend channel sebesar +/-4.18 % atau sekitar +/- 24.27 (potensi naik dan turun secara normal maksimum/minimum sebesar 25 rupiah) dari level penutupan kemarin. Saat ini harga akan coba bertahan diatas normal lower band pada uptrend channel, sebagaimana terlihat pada Figure 11.
Summary
Item Data Item Data
Close (June 14, 2016) 580 (0.0%) Trading range 570-660
Relative Avg. Price performance to JCI (%) 76.09 Target
β (beta) 1.31 - Daily 610
Corelation 0.51 - Weekly 625
Period 89 - Monthly 765
r-squared 0.9303 Stop loss 560
Volatility (+/-, %) 4.18
Volatility (+/-, Rp.) 24.27
Source: Daewoo Securities Indonesia Research
Figure 11. Daily trend – Uptrend
Source: Daewoo Securities Indonesia Research
Created w ith AmiBroker - advanced charting and technical analysis softw are. http://w w w .amibroker.com Optimization Trading System - ©2010
Optimization Trading System - ©2010 Optimization Trading System - ©2010 Optimization Trading System - ©2010
INDY.JK - Daily 6/14/2016 Open 580, Hi 610, Lo 570, Close 580 (0.0%) Upper Band = 754.03, Channel_prd = 663.67, Lower Band = 573.31, Upper Band = 763.44, Channel_prd = 663.67, Lower
580 573.306 569.758 563.898 631.88 663.667 663.667 754.027 763.436
28 2016 11 18 25 Feb 9 15 22 29Mar 14 21 28 Apr 11 18 25 May 16 23 30 Jun 6 13
Optimization Trading System - ©2010
INDY.JK - Volume = 11,240,900.00, Avg.Volume = 36,065,540.00
11,240,900 36,065,540
Aliran dana masuk masih terlihat diiringi dengan volatilitas pergerakan harga cenderung naik.
Pada Figure 12, terlihat dari hasil optimalisasi, indikator MFI Optimized saat ini masih cenderung naik, sementara itu indikator W%R Optimized cenderung bottom reversal namun volume masih di bawah rata-rata. Hal ini menandakan koreksi harga mulai tertahan. Jika level 615 sebagai resistance terdekat dapat ditembus, maka harga berpotensi ke 630 dan 670. Support terdekat saat ini di 570.Stop loss level di 560.
Figure 12. Daily, MFI optimized & W%R optimized
Source: Daewoo Securities Indonesia Research
Created w ith AmiBroker - advanced charting and technical analysis softw are. http://w w w .amibroker.com INDY.JK - MFI Smoothed = 36.00
35.9982
INDY.JK - Will%R Smoothed = -79.10
-79.1033
Optimization Trading System - ©2010 Optimization Trading System - ©2010 Optimization Trading System - ©2010
615 INDY.JK - Daily 6/14/2016 Open 580, Hi 610, Lo 570, Close 580 (0.0%) VWAP = 569.76, VWAP = 631.88, VWAP = 446.93 670
580 569.758 446.929 631.88
Dec 2016 Feb Mar Apr May Jun
Optimization Trading System - ©2010
INDY.JK - Volume = 11,240,900.00, Avg.Volume = 26,975,104.00
11,240,900 26,975,104
11 Harga akan coba bertahan sekitar rata-rata pada periode daily,weekly, dan monthly.
Untuk naik lebih lanjut harga saham ini harus mampu bertahan minimal pada rata-rata periode daily dan weekly sekitar level 585-590 dengan target normal kenaikan ke level resistance 2 pada masing masing periode diatas, sebagaimana terlihat pada Figure 13,14 dan 15.
Figure 13. Daily, target : 610 Figure 14. Weekly, target : 625 Figure 15. Monthly, target : 765
Source: Daewoo Securities Indonesia Research Source: Daewoo Securities Indonesia Research Source: Daewoo Securities Indonesia Research
Created w ith AmiBroker - advanced charting and technical analysis softw are. http://w w w .amibroker.com INDY.JK - Daily 6/14/2016 Open 580, Hi 610, Lo 570, Close
580 572.864 560.728 548.593 536.457 585 597.136 609.272 621.407 633.543
Apr May Jun
Optimization Trading System - ©2010
INDY.JK - Volume = 11,240,900.00, Avg.Volume = 26,975,104.00
11,240,900 26,975,104
Created w ith AmiBroker - advanced charting and technical analysis softw are. http://w w w .amibroker.com INDY.JK - Weekly 6/14/2016 Open 610, Hi 610, Lo 560,
580 572.678 555.356 538.033 520.711 590 607.322 624.644 641.967 659.289
Oct 2016 Apr
Optimization Trading System - ©2010
INDY.JK - Volume = 21,287,900.00, Avg.Volume = 154,566,608.00
21,287,900 154,566,608
Created w ith AmiBroker - advanced charting and technical analysis sof tw are. http://w w w .amibroker.com INDY.JK - Monthly 6/14/2016 Open 615, Hi 685, Lo 560,
580 532.041 454.082
376.122
298.163 610 687.959 765.918 843.878 921.837
2014 2015 2016
Optimization Trading System - ©2010
INDY.JK - Volume = 189,616,704.00, Avg.Volume = 797,460,800.00
189,616,704 797,460,800
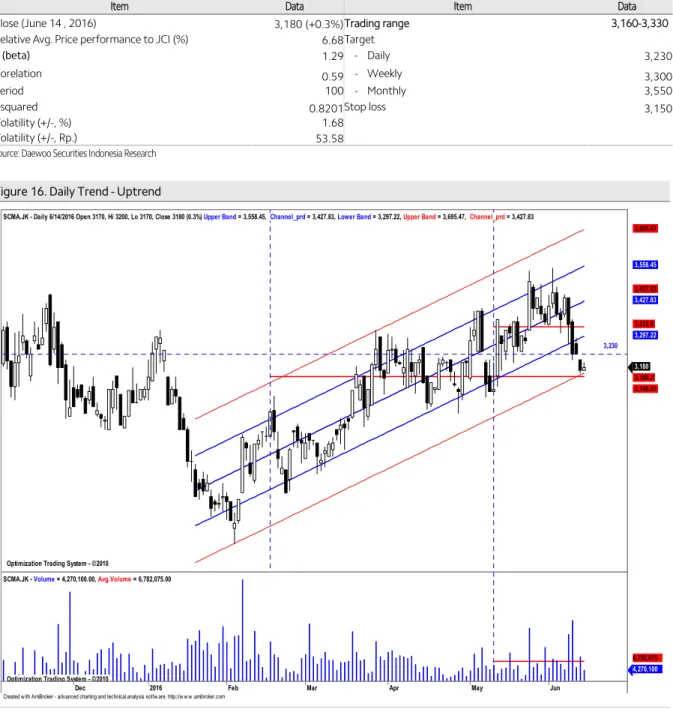
Surya Citra Media (SCMA)-Trading Buy
Harga akan coba bertahan diatas abnormal lower band pada uptrend channel.
Secara umum harga saham ini juga masih bergerak dalam pola uptrend yang masih relatif valid (r-squared = 0.8201) selama 100 hari terakhir dan bergerak dalam rentang +/- 1.34 std.deviasi dari center line. Peluang harga keluar dari pergerakan normalnya sekitar 17.99 % (sekitar 18 bar chart ). Volatilitas normal pergerakan harga saham ini sepanjang uptrend channel sebesar +/-1.68% atau sekitar +/- 53.58 (potensi naik dan turun secara normal maksimum/minimum sebesar 50-55 rupiah) dari level penutupan kemarin. Harga akan coba bertahan diatas abnormal lower band pada uptrend channel , sebagaimana terlihat pada Figure 16.
Summary
Item Data Item Data
Close (June 14 , 2016) 3,180 (+0.3%)Trading range 3,160-3,330
Relative Avg. Price performance to JCI (%) 6.68Target
β (beta) 1.29 - Daily 3,230
Corelation 0.59 - Weekly 3,300
Period 100 - Monthly 3,550
r-squared 0.8201 Stop loss 3,150
Volatility (+/-, %) 1.68
Volatility (+/-, Rp.) 53.58
Source: Daewoo Securities Indonesia Research
Figure 16. Daily Trend - Uptrend
Source: Daewoo Securities Indonesia Research
Created w ith AmiBroker - advanced charting and technical analysis softw are. http://w w w .amibroker.com Optimization Trading System - ©2010
Optimization Trading System - ©2010 Optimization Trading System - ©2010 Optimization Trading System - ©2010
3,230 SCMA.JK - Daily 6/14/2016 Open 3170, Hi 3200, Lo 3170, Close 3180 (0.3%) Upper Band = 3,558.45, Channel_prd = 3,427.83, Lower Band = 3,297.22, Upper Band = 3,695.47, Channel_prd = 3,427.83
3,180 3,160.2 3,146.41 3,297.22 3,332.6 3,427.83 3,427.83 3,558.45 3,695.47
Dec 2016 Feb Mar Apr May Jun
Optimization Trading System - ©2010
SCMA.JK - Volume = 4,270,100.00, Avg.Volume = 6,782,075.00
4,270,100 6,782,075
13 Aliran dana masuk masih terlihat dengan volatilitas koreksi harga mulai tertahan.
Pada Figure 17, terlihat dari hasil optimalisasi, indikator MFI Optimized cenderung naik dan indikator W%R Optimized saat ini akan menguji support trendline dengan volume masih di bawah rata-rata. Hal ini menandakan potensi kenaikan mulai terlihat. Level 3,230 adalah sebagai resistance terdekat saat ini sebelum ke 3,330. Support terdekat di 3,150 yang sekaligus sebagai stop loss level.
Figure 17. Daily MFI Optimized & W%R Optimized
Source: Daewoo Securities Indonesia Research
Created w ith AmiBroker - advanced charting and technical analysis softw are. http://w w w .amibroker.com SCMA.JK - MFI Smoothed = 19.27
19.2748
SCMA.JK - Will%R Smoothed = -86.29
-86.2938
Optimization Trading System - ©2010 Optimization Trading System - ©2010
3,230 SCMA.JK - Daily 6/14/2016 Open 3170, Hi 3200, Lo 3170, Close 3180 (0.3%) VWAP = 3,146.41, VWAP = 3,332.60
3,180 3,146.41 3,332.6
Oct Nov Dec 2016 Feb Mar Apr May Jun
Optimization Trading System - ©2010
SCMA.JK - Volume = 4,270,100.00, Avg.Volume = 6,782,075.00
4,270,100 6,782,075
Harga akan coba bertahan diatas rata-rata pada periode daily, weekly dan monthly.
Untuk mampu naik lebih lanjut harga saham ini harus mampu bertahan minimal diatas rata-rata periode daily dan weekly atau sekitar level 3,180-3,190 dengan target kenaikan normal adalah ke level resistance 2 pada masing masing periode diatas sebagaimana terlihat pada Figure 18,19 dan 20.
Figure 18. Daily, target : 3,230 Figure 19. Weekly, target : 3,300 Figure 20. Monthly, target : 3,550
Source: Daewoo Securities Indonesia Research Source: Daewoo Securities Indonesia Research Source: Daewoo Securities Indonesia Research
analyzed by : Tasrul, [email protected], +62-21- 5151140
Relative Avg.Price Performance to JCI (%) : Persentase kenaikan harga saham dari rata-rata sejak IHSG memulai uptrend-nya β (beta) : Indikator sensitivitas harga saham terhadap IHSG, beta diatas 1 berarti harga makin sensitif terhadap pergerakan IHSG dan sebaliknya
Correlation : Ukuran kuat hubungan (korelasi) pergerakan harga saham dibanding dengan pergerakan IHSG
Period : Periode uptrend / downtrend yang valid dari pergerakan harga saham
r-squared : Koefisien determinasi, menunjukkan persentase gerakan yang dapat dijelaskan dengan regresi linier.Nilai R2 terletak antara 0 – 1, dan kecocokan model dikatakan lebih baik kalau R2 semakin mendekati 1 (validitas uptrend atau downtrend makin valid) Volatility (+/-%) : Besaran volatilitas normal maksimal/minimal dari pergerakan harga harian selama harga saham bergerak normal pada trend channel dalam persentase.
Volatility (+/- point or Rp) : Besaran volatilitas normal maksimal/minimal dari pergerakan harga harian selama Harga saham bergerak
Buy: : Beli, harga sudah menyentuh atau jatuh di bawah support dan indikator teknikal berada di oversold area.
Sell: : Jual, harga sudah menyentuh atau tembus resistance normal dan indikator berada di overbought area.
BoW: : Buy on Weakness, beli ketika harga sudah melemah, dimana Volume tekanan jual mulai berkurang dan harga mendekati support, serta indikator teknikal sudah berada di oversold area.
SoS: : Sell on Strength, jual ketika kenaikan harga sudah mulai terbatas dimana volume beli mulai berkurang dan harga mendekati resistance, serta indikator teknikal sudah berada di overbought area.
Trading Buy: : Beli dan jual kembali secepatnya jika harga sudah mencapai level resistance terdekat, karena kenaikan harga relatif tidak stabil atau hanya sementara.
Trading Sell : Jual dan beli kembali secepatnya jika harga sudah mencapai level support terdekat karena koreksi harga relative tidak stabil atau hanya sementara.
Created w ith AmiBroker - advanced charting and technical analysis softw are. http://w w w .amibroker.com SCMA.JK - Daily 6/14/2016 Open 3170, Hi 3200, Lo 3170,
3,180 3,153.21 3,126.42 3,099.62 3,072.83 3,180 3,206.79 3,233.58 3,260.38 3,287.17
Apr May Jun
Optimization Trading System - ©2010
SCMA.JK - Volume = 4,270,100.00, Avg.Volume = 6,782,075.00
4,270,100 6,782,075
Created w ith AmiBroker - advanced charting and technical analysis softw are. http://w w w .amibroker.com SCMA.JK - Weekly 6/14/2016 Open 3210, Hi 3210, Lo
3,180 3,130.29 3,070.58 3,010.87 2,951.16 3,190 3,249.71 3,309.42 3,369.13 3,428.84
Oct 2016 Apr
Optimization Trading System - ©2010
SCMA.JK - Volume = 12,273,400.00, Avg.Volume = 33,775,652.00
12,273,400 33,775,652
Created w ith AmiBroker - advanced charting and technical analysis sof tw are. http://w w w .amibroker.com SCMA.JK - Monthly 6/14/2016 Open 3340, Hi 3550, Lo
3,180 3,062.54 2,940.05 2,817.57 3,185.02 3,307.5 3,429.98 3,552.46 3,674.95 3,797.43
2014 2015 2016
Optimization Trading System - ©2010
SCMA.JK - Volume = 79,650,800.00, Avg.Volume = 141,863,760.00
79,650,800 141,863,760
15 Chart 21. JCI Vs. USD/IDR Chart 22. JCI performance (absolute vs. relative)
Source: Bloomberg, Daewoo Securities Indonesia Research Note: Relative to MSCI EM Index
Source: Bloomberg, Daewoo Securities Indonesia Research
Chart 23. Foreigner’s net purchase (EM) Chart 24. Energy price
Note: The latest figure for India are Jun, 13th
Source: Bloomberg, Daewoo Securities Indonesia Research Source: Bloomberg, Daewoo Securities Indonesia Research
Chart 25. Non-ferrous metal price Chart 26. Precious metal price
Source: Bloomberg, Daewoo Securities Indonesia Research Source: Bloomberg, Daewoo Securities Indonesia Research 13,000
13,200 13,400 13,600 13,800 14,000
4,300 4,400 4,500 4,600 4,700 4,800 4,900 5,000
3/15 3/29 4/12 4/26 5/10 5/24 6/7
(IDR)
(pt) JCI (L) USD/IDR (R)
0.3
-2.3
1.3
-0.3
1.1 2.4
0.4
16.9
-4 0 4 8 12 16 20
1D 1W 1M 1Y
Absolute Relative (%, %p)
0
91 54
-2 -7
68 53
1,002
58 12 22
288
-200 0 200 400 600 800 1,000 1,200
Korea Taiwan Indonesia Thailand Philippines India 1 Day 5 Days (USDmn)
(USDmn) (USDmn) (USDmn)
1,700 1,900 2,100 2,300 2,500 2,700 2,900
25 30 35 40 45 50 55 60 65 70
3/16 3/16 4/16 4/16 5/16 5/16 6/16
Brent (L) CPO(R) (MYR/MT)
(((USD/b)
70 80 90 100 110 120 130
3/16 3/16 4/16 4/16 5/16 5/16 6/16
(D-3M=100) Copper Nickel Tin
((
85 90 95 100 105 110 115 120 125
3/16 3/16 4/16 4/16 5/16 5/16 6/16
Silver Gold Platinum
Table. Key valuation metrics
Company Name Ticker Price Market Cap Price Performance (%) P/E(X)* P/B(X)* ROE(%)*
(IDR) (IDRbn) 1D 1W 1M 1Y FY16 FY17 FY16 FY17 FY16 FY17
Jakarta Composite Index JCI 4,822 5,139,410 0.3 -2.3 1.3 -2.3
FINANCIALS
Bank Central Asia BBCA 12,850 316,817 0.6 -1.9 -2.3 -3.0 18.2 16.2 3.7 3.0 21.9 19.8 Bank Mandiri Persero BMRI 8,975 209,417 -0.8 -5.3 -3.5 -9.3 10.6 10.5 1.8 1.5 18.5 15.9 Bank Rakyat Indonesia Persero BBRI 9,975 246,075 -1.2 -6.3 1.0 -3.9 11.1 9.5 2.5 1.8 24.1 20.9 Bank Negara Indonesia Persero BBNI 4,660 86,903 -0.6 -3.3 4.0 -17.2 10.2 8.0 1.2 1.1 13.4 13.7 Bank Tabungan Negara Persero BBTN 1,630 17,262 -1.2 -4.7 -10.2 44.9 12.8 10.2 0.9 0.9 7.2 9.0
CONSUMER
HM Sampoerna HMSP 3,880 451,314 1.9 -2.8 -2.0 35.8 40.4 40.3 13.7 14.7 45.5 35.4
Gudang Garam GGRM 68,025 130,886 0.2 -3.3 -4.5 54.6 16.4 18.7 2.8 3.1 18.2 17.1
Indofood CBP Sukses Makmur ICBP 16,700 97,377 3.4 -0.3 7.1 25.1 26.2 27.1 5.1 5.5 20.6 21.0 Indofood Sukses Makmur INDF 7,150 62,780 0.0 -2.7 0.4 8.3 17.7 16.1 1.7 2.1 11.3 14.0
Kalbe Farma KLBF 1,400 65,625 0.0 -4.4 6.1 -17.2 30.9 29.6 5.9 5.5 20.2 19.4
Unilever Indonesia UNVR 43,500 331,905 1.2 -0.3 -2.0 5.5 48.3 51.9 58.5 62.6 122.2 126.3 AGRICULTURAL
Astra Agro Lestari AALI 14,500 27,908 -2.7 -8.1 2.5 -34.4 40.3 14.7 2.2 1.7 5.5 13.0
PP London Sumatera Indonesia LSIP 1,495 10,200 -1.0 -5.7 -2.6 -9.7 14.5 14.3 1.2 1.3 8.7 9.3
Sawit Sumbermas Sarana SSMS 1,870 17,812 -0.5 0.5 13.0 1.6 33.1 N/A 6.1 N/A 19.4 N/A
INFRASTRUCTURE
XL Axiata EXCL 3,680 39,332 1.1 -1.9 10.4 -8.0 N/A 41.3 2.2 2.0 -0.2 5.0
Jasa Marga JSMR 5,250 35,700 -0.5 -4.5 -3.2 -16.0 24.2 22.0 3.4 3.0 14.8 13.9
Perusahaan Gas Negara PGAS 2,370 57,452 -4.4 -6.3 2.6 -43.6 9.9 9.8 1.6 1.3 13.6 13.4 Tower Bersama Infrastructure TBIG 6,625 31,777 2.7 0.4 -0.4 -26.0 19.3 23.8 17.7 7.4 79.3 43.6 Telekomunikasi Indonesia TLKM 3,770 380,016 0.3 -3.6 2.2 32.9 19.7 20.3 4.1 4.5 21.7 22.3
Soechi Lines SOCI 428 3,021 -0.5 -2.7 5.4 -28.1 5.9 4.6 0.9 0.7 15.9 15.2
Garuda Indonesia GIAA 492 12,728 0.4 2.5 6.5 10.1 N/A 31.5 2.4 2.6 -10.0 7.2
BASIC-INDUSTRIES
Semen Indonesia SMGR 8,800 52,197 -0.6 -5.6 -2.2 -29.7 15.0 11.1 2.6 1.8 17.9 16.7
Charoen Pokphand Indonesia CPIN 3,750 61,493 4.2 1.1 19.0 27.8 23.2 22.9 3.4 4.2 15.6 19.6 Indocement Tunggal Prakarsa INTP 16,150 59,452 0.8 -2.7 -2.6 -22.7 18.9 13.4 3.4 2.3 18.0 17.6 Japfa Comfeed Indonesia JPFA 1,055 11,247 1.0 10.5 13.4 77.3 14.4 14.1 1.2 1.8 9.0 12.4 MINING
Indo Tambangraya Megah ITMG 8,650 9,774 -0.6 -2.3 3.3 -34.0 6.9 12.0 0.6 0.9 7.3 7.6
Adaro Energy ADRO 845 27,028 -1.7 -7.1 26.1 1.8 7.8 15.8 0.4 0.7 5.4 4.4
Aneka Tambang ANTM 685 16,461 -2.8 1.5 -2.8 9.5 N/A N/A 0.4 0.9 -9.5 -2.8
Vale Indonesia INCO 1,735 17,240 -1.1 -2.8 8.1 -41.1 23.6 N/A 0.6 0.7 2.8 0.5
Tambang Batubara Bukit Asam PTBA 7,400 17,051 -3.0 -5.4 17.0 -19.1 4.8 10.0 1.0 1.6 23.2 16.6 TRADE
United Tractors UNTR 13,875 51,756 0.2 -3.0 5.9 -32.3 16.4 10.8 1.7 1.3 10.3 11.8
AKR Corporindo AKRA 5,950 23,742 -2.5 -3.3 -2.9 5.8 27.3 20.2 4.7 3.4 18.0 18.4
Global Mediacom BMTR 1,045 14,838 -2.3 -2.3 -7.1 -6.7 297.3 15.6 1.4 N/A 0.5 N/A
Matahari Department Store LPPF 18,750 54,711 -0.3 -2.6 -1.4 10.3 28.8 25.3 46.4 26.5 281.5 139.8 Media Nusantara Citra MNCN 2,200 31,407 -1.3 -4.3 -4.3 15.2 22.0 17.5 2.9 3.0 13.3 18.3
Matahari Putra Prima MPPA 1,280 6,884 1.2 -2.7 -5.2 -62.4 53.7 47.0 3.5 2.3 6.5 7.6
Surya Citra Media SCMA 3,180 46,497 0.3 -7.6 -5.4 10.8 29.7 27.7 14.4 11.7 46.2 44.8
Siloam International Hospital SILO 10,975 12,688 -2.9 8.7 22.6 -16.9 160.9 141.5 6.5 7.0 4.1 4.8
PROPERTY
Bumi Serpong Damai BSDE 1,835 35,318 0.3 -2.1 6.7 7.0 16.0 14.0 1.8 1.6 12.5 12.2
Adhi Karya ADHI 2,680 9,543 -1.8 2.7 10.3 54.8 10.6 15.8 1.5 1.6 13.7 11.5
Alam Sutera Realty ASRI 386 7,585 -1.0 -4.0 5.5 -27.2 11.3 8.0 1.0 1.0 9.5 12.2
Ciputra Development CTRA 1,350 20,696 3.8 -0.7 7.1 5.8 17.5 14.6 2.7 2.2 16.0 15.3
Lippo Karawaci LPKR 965 22,270 0.0 -5.4 3.2 -15.7 44.0 15.8 1.4 1.2 3.3 9.4
Pembangunan Perumahan PTPP 3,750 18,159 -1.8 -1.6 4.2 7.4 25.3 19.6 4.3 3.8 22.0 20.0
Pakuwon Jati PWON 530 25,525 0.0 -5.4 6.0 29.3 18.9 12.9 3.3 2.8 18.9 23.7
Summarecon Agung SMRA 1,600 23,083 3.9 -2.7 13.5 -4.8 27.8 22.7 4.0 3.2 15.0 15.0
Wijaya Karya WIKA 2,700 16,603 0.7 2.3 11.1 1.5 25.9 21.8 3.7 3.3 15.1 15.7
Waskita Karya WSKT 2,390 32,439 -1.2 -1.2 -6.3 50.0 18.5 21.8 2.4 3.0 16.9 14.6
MISCELLANEOUS
Astra International ASII 6,700 271,240 1.9 -2.2 5.9 -5.3 16.8 16.2 2.4 2.4 14.6 15.3
Source: Bloomberg, Daewoo Securities Indonesia Research
*Note: Valuation metrics based on Bloomberg consensus estimates
17
Sector performance Top 10 market cap performance
Name Index Chg (%) Ticker Price Market Cap (IDRbn) Chg (%)
Agricultural 1,759.3 -1.1 PSAB IJ 1570 8,308 5.0
Mining 1,017.5 -0.8 BDMN IJ 3370 32,300 4.33
Basic-Industry 412.2 0.4 AMRT IJ 610 25,330 4.27
Miscellaneous Industry 1,138.7 1.6 CPIN IJ 3750 61,493 4.17
Consumer Goods 2,345.0 1.2 SMRA IJ 1600 23,083 3.90
Property & Construction 502.0 0.0 CTRA IJ 1350 20,696 3.85
Infrastructure 1,078.5 0.0 BJBR IJ 1020 9,890 3.6
Finance 661.7 -0.2 ICBP IJ 16700 97,377 3.41
Trade 837.6 -0.2 RALS IJ 930 6,599 3.3
Composite 4,821.6 0.3 TBIG IJ 6625 31,777 2.71
Source: Bloomberg
Top 5 leading movers Top 5 lagging movers
Name Chg (%) Close Name Chg (%) Close
HMSP IJ 1.9 3,880 BBRI IJ -1.2 9,975
ASII IJ 1.9 6,700 PGAS IJ -4.4 2,370
UNVR IJ 1.2 43,500 BMRI IJ -0.8 8,975
ICBP IJ 3.4 16,700 AALI IJ -2.7 14,500
CPIN IJ 4.2 3,750 AKRA IJ -2.5 5,950
Source: Bloomberg
Economic Calendar
Time Currency Detail Forecast Previous
5:45am NZD Current Account 0.97B -2.61B
7:30am AUD Westpac Consumer Sentiment 8.5%
1:45pm EUR French Final CPI m/m 0.4% 0.4%
15th-16th CNY M2 Money Supply y/y 12.6% 12.8%
15th-16th CNY New Loans 750B 556B
3:30pm GBP Average Earnings Index 3m/y 1.7% 2.0%
3:30pm GBP Claimant Count Change -0.1K -2.4K
3:30pm GBP Unemployment Rate 5.1% 5.1%
4:00pm EUR Trade Balance 21.6B 22.3B
Tentative EUR German 10-y Bond Auction 0.14|1.3
7:30pm CAD Manufacturing Sales m/m 0.7% -0.9%
7:30pm USD PPI m/m 0.3% 0.2%
7:30pm USD Core PPI m/m 0.1% 0.1%
7:30pm USD Empire State Manufacturing Index -3.4 -9.0
8:15pm USD Capacity Utilization Rate 75.2% 75.4%
8:15pm USD Industrial Production m/m -0.2% 0.7%
9:00pm EUR German Buba President Weidmann Speaks
9:30pm USD Crude Oil Inventories -3.2M
Tentative NZD GDT Price Index 3.4%
Note: Time is based on Indonesian local time Source: Forex Factory
Disclaimers
This report is prepared strictly for private circulation only to clients of PT Daewoo Securities Indonesia (DWS). It is purposed only to person having professional experience in matters relating to investments. The information contained in this report has been taken from sources which we deem reliable. No warranty (express or implied) is made to the accuracy or completeness of the information. All opinions and estimates included in this report constitute our judgments as of this date, without regards to its fairness, and are subject to change without notice. However, none of DWS and/or its affiliated companies and/or their respective employees and/or agents makes any representation or warranty (express or implied) or accepts any responsibility or liability as to, or in relation to, the accuracy or completeness of the information and opinions contained in this report or as to any information contained in this report or any other such information or opinions remaining unchanged after the issue thereof. We expressly disclaim any responsibility or liability (express or implied) of DWS, its affiliated companies and their respective employees and agents whatsoever and howsoever arising (including, without limitation for any claims, proceedings, action, suits, losses, expenses, damages or costs) which may be brought against or suffered by any person as a results of acting in reliance upon the whole or any part of the contents of this report and neither DWS, its affiliated companies or their respective employees or agents accepts liability for any errors, omissions or misstatements, negligent or otherwise, in the report and any liability in respect of the report or any inaccuracy therein or omission there from which might otherwise arise is hereby expresses disclaimed.
This document is not an offer to sell or a solicitation to buy any securities. This firms and its affiliates and their officers and employees may have a position, make markets, act as principal or engage in transaction in securities or related investments of any company mentioned herein, may perform services for or solicit business from any company mentioned herein, and may have acted upon or used any of the recommendations herein before they have been provided to you. © PT Daewoo Securities Indonesia 2015.