Franky Rivan +62-21-515-1140 [email protected] To subscribe to our Daily Focus, please contact us at [email protected]
Mirae Asset Sekuritas Indonesia
WIKA’s 2017F P/E range
Source: Mirae Asset Sekuritas Indonesia Research
Embun Pagi
August 7, 2017
WIKA (Buy) 2Q17 preview: Large double-digit growth to continue Getting bigger; Jump in earnings expected
Tidak seperti kontraktor lain yang telah merilis laporan keuangan (LK) 2Q17nya, Wijaya Karya (WIKA) akan melakukan limited review terhadap pembukuannya dan akan merilis LK 2Q17nya selambat-lambatnya pada 31 Sep. Kami yakin pendapatan untuk kuartal tersebut akan sejalan dengan pandangan optimis kami terhadap perusahaan, dengan pendapatan IDR5,2tr dan laba bersih IDR318,9bn. Argumen kami didasarkan pada order book perusahaan yang cukup besar yaitu IDR83,4tr (+105,8% YoY vs. IDR40.5tr di 1H16), dan pandangan kami terhadap pengakuan pendapatan WIKA yang cepat, karena kami lihat tingkat penyelesaian proyek saat ini tidak akan mengganggu burn-rate WIKA secara keseluruhan. Untuk 1H17, perkiraan pendapatan dan laba kami menyiratkan run-rate masing-masing 36,8%
dan 41,4% terhadap estimasi setahun penuh kami.
Maintain Buy, but lower TP to IDR2,920
Pada 1H17, WIKA adalah membukukan kontrak baru terbaik kedua (dibandingkan dengan kontraktor lainnya), senilai IDR19,5tr (+30% YoY vs. IDR15tr di 1H16;
mewakili 45,1% run-rate terhadap target IDR43tr vs. 42% run-rate industri).
Dengan ini, kami yakin WIKA akan dapat terus membukukan kontrak baru yang agresif ke depannya. Selanjutnya, posisi leverage perusahaan yang rendah dapat meningkatkan peluangnya untuk memenangkan tender kontrak baru, menurut pandangan kami. Kami mempertahankan rekomendasi Buy kami di WIKA karena kami melihat upside risks yang positif di LK 2Q17nya. Namun, kami menurunkan target harga kami dari IDR3.200 menjadi IDR2.920, karena kami menyesuaikan beta perusahaan dari 1.12x menjadi 1.21x, untuk mencerminkan profil risiko perusahaan saat ini secara lebih akurat. Target harga berbasis DCF kami mencerminkan tingkat pertumbuhan 5%, premi risiko pasar 5%, tingkat risk-free 7,5%, beta 1,21x, dan WACC 11,6%. WIKA saat ini diperdagangkan di 2017F P/E di 13x, di bawah standar deviasi -1nya sebesar 17.8x.
Market Index
Last Trade Chg (%) MoM YoY
JCI 5,777.5 -0.1 -0.6 6.6
MSCI Indonesia 26.6 0.0 -1.1 0.4
MSCI EM 1,067.3 0.3 6.1 20.2
HANG SENG 27,562.7 0.1 8.6 24.3
KOSPI 2,395.5 0.3 0.7 18.7
FTSE 7,511.7 0.5 1.7 10.0
DJIA 22,092.8 0.3 2.9 18.8
NASDAQ 6,351.6 0.2 3.0 21.4
Valuation
2017F P/E (x) P/B (x) ROE (%)
JCI 16.6 2.6 18.8
Key Rates
Last Trade Chg (bps) MoM YoY
BI 7-Day RR 4.75 0 0 -50
3yr 6.73 0 0 5
10yr 6.91 -1 -26 5
FX
Last Trade Chg (%) MoM YoY
USD/IDR 13,316.00 -0.1 -0.3 1.4
USD/KRW 1,124.90 -0.3 -2.6 1.5
USD/JPY 110.69 0.6 -2.8 8.0
USD/CNY 6.73 -0.1 -1.2 1.1
Commodities
Last Trade Chg (%) MoM YoY
WTI 49.6 1.1 11.7 4.6
Gold 1,258.9 -0.8 3.8 -5.7
Coal 95.4 9.3 17.5 46.7
Palm Oil 2,590.0 1.1 0.3 6.0
Rubber 131.2 0.0 0.4 -4.7
Nickel 10,250.0 -1.3 14.9 -4.3
Copper 6,372.0 0.3 9.3 33.1
Tin 20,510.0 -0.7 3.5 14.8
JCI Index VS MSCI Emerging Markets
650 800 950 1,100
3,500 4,500 5,500
07/13 07/14 07/15 07/16 07/17
JCI MSCI EM (pt)
(pt)
950 1,100 5,500
(pt) JCI MSCI EM (pt)
-1 Std Dev Avg P/E +1 Std Dev
-2 Std Dev +2 Std Dev
0 10 20 30 40 50 60
7/12 7/13 7/14 7/15 7/16 7/17
( x )
Mirae Asset Sekuritas Indonesia cartoon
Local flashes
BRPT: Pasca akuisisi Star Energy, Barito fokus di pabrik. Setelah melakukan pembayaran sebesar US$ 300 juta untuk mengakuisi Star Energy, PT Barito Pacific Tbk berencana merampungkan pembangunan pabrik untuk anak perusahaan di sektor petrokimia. Agus Salim Pangestu selaku Direktur Utama emiten berkode saham BRPT ini mensinyalkan adanya rencana untuk menyelesaikan pembangunan pabrik milik anak perusahaan PT Chandra Asri Petrochemical Tbk (TPIA). (Kontan)
KIJA: Jababeka kembangkan proyek ruko komersial. Perusahaan pengembang, Jababeka Residence (anak usaha PT Jababeka Tbk), menggarap proyek rumah toko (ruko) komersial baru, Sudirman Boulevard, di kawasan strategis Kota Jababeka, Cikarang. Presiden Direktur PT Grahabuana Cikarang, Sutedja S Darmono, mengatakan, proyek ruko yang dikembangkan pihaknya memiliki lokasi yang strategis, dan berdekatan dengan pusat bisnis di kawasan Jababeka. (BeritaSatu)
BABP: MNC Bank targetkan pertumbuhan kredit 13% tahun ini. Struktur modal semakin kuat, PT Bank MNC Internasional Tbk (BABP) menggenjot ekspansi pada sektor consumer dan ritel dengan target pertumbuhan total kredit 13% sepanjang tahun ini. Presiden Direktur MNC Bank Benny Purnomo menjelaskan struktur permodalan perseroan yang semakin kuat akan mendukung ekspansi kredit di masa depan. Akhir tahun ini, modal inti MNC Bank ditargetkan naik menjadi Rp2 triliun.
(Iqplus)
ARTI: Pendapatan turun, laba Ratu Prabu naik 71%. PT Ratu Prabu Energi Tbk (ARTI) mencatatkan pendapatan Rp 102 miliar pada semester pertama tahun ini. Pendapatan ini turun 28% dari Rp 143 miliar di semester 1 tahun lalu. ARTI meraup pendapatan terbesar dari penyewaan bangunan dan jasa terkait yakni sebesar Rp 44,18 miliar.
Angka ini melonjak 435% dibandingkan dengan pendapatan segmen yang sama tahun lalu. Bisnis jasa konsultan perminyakan dan tenaga ahli mencatatkan kontribusi pendapatan sebesar Rp 26,9 miliar. (Kontan)
MARI: Mahaka Radio siapkan dana Rp15 miliar untuk akuisisi radio daerah. PT Mahaka Radio Integra Tbk. (MARI) menganggarkan dana yang berasal dari cash flow untuk akuisisi radio-radio daerah sebesar Rp10 miliar hingga Rp15 miliar. Presiden Direkur PT Mahaka Radio Integra Adrian Syarkawie mengungkapkan langkah tersebut dilakukan karena pasar Jabodetabek sudah digarap separuhnya. (Bisnis Indonesia)
KINO: Kino Indonesia mengalami penurunan penjualan. Kino mencatatkan penurunan volume penjualan mencapai 27% pada semester I/2017 dibandingkan dengan periode sama tahun lalu yang dipengaruhi oleh penyusutan permintaan segmen beverages karena daya beli masyarakat belum stabil. Harry Sanusi, Presiden Direktur PT Kino Indonesia Tbk. (Kino), menyampaikan pada paruh pertama lalu penjualan perusahaannya menurun diakibatkan permintaan segmen beverages (minuman) berkurang paling drastis hingga menyentuh dua digit dibandingkan dengan periode sama tahun sebelumnya. Penurunan produk minuman tersebut memberikan efek yang besar dikarenakan segmenminuman menjadi salah satu penyumbang terbanyak penjualan Kino. (Bisnis Indonesia)
Technical analysis
Tasrul +62-21-515-1140 [email protected] Jakarta Composite Index (JCI) –Oversold
IHSG akan coba naik dari abnormal lower band pada uptrend channel
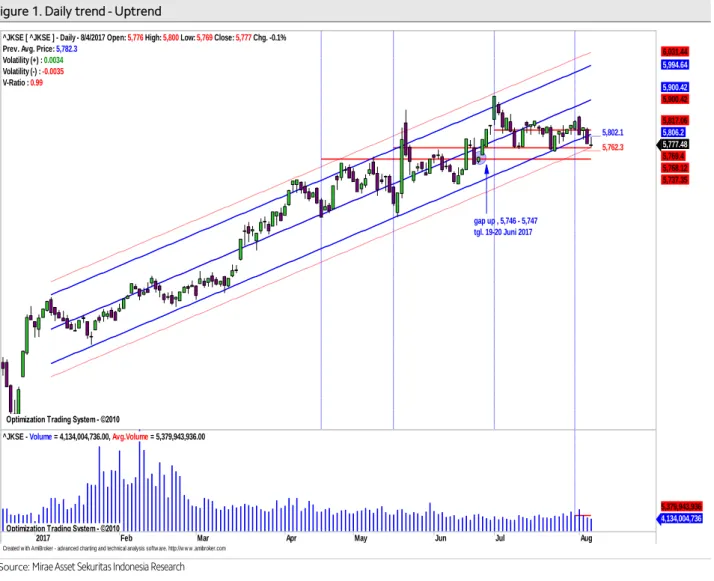
IHSG saat masih dalam pola uptrend jangka pendek relatif valid yang dimulai sejak 135 hari terakhir dengan r-squared = 0.9283 dan bergerak normal dalam rentang +/-1.8 std.deviasi dari centerline. Peluang IHSG bergerak di luar pergerakan normal sekitar 7.43%
atau sekitar 10 bar chart. Rata-rata volatilitas normal pergerakan IHSG saat ini sebesar antara 0.34 % / - 0.35% atau +19.66 point / -20.24 point (rata-rata pergerakan normal positif / negatif selama periode analisis) sebagaimana terlihat pada Figure 1.
Summary
Item Data Item Data
Close (Aug 4, 2017) 5,777.48(-0.1%) Trading range 5,768 – 5,802 Average index performance (%) 38.10 Target
Period 135 - Daily 5,802
r-squared 0.9257 - Weekly 5,864
Volatility (+/-, %) +0.34 / -0.35 - Monthly 5,919
Volatility (+/-, point) +19.66 / -20.24 Stop loss 5,768
Source: Mirae Asset Sekuritas Indonesia Research
Figure 1. Daily trend - Uptrend
Source: Mirae Asset Sekuritas Indonesia Research
Created w ith AmiBroker - advanced charting and technical analysis softw are. http://w w w .amibroker.com
_____ 5,802.1 _____ 5,762.3
Optimization Trading System - ©2010 Optimization Trading System - ©2010 Optimization Trading System - ©2010 Optimization Trading System - ©2010 Optimization Trading System - ©2010
gap up , 5,746 - 5,747 tgl. 19-20 Juni 2017
^JKSE [ ^JKSE ] - Daily - 8/4/2017 Open: 5,776 High: 5,800 Low: 5,769 Close: 5,777 Chg. -0.1%
Prev. Avg. Price: 5,782.3 Volatility (+) : 0.0034 Volatility (-) : -0.0035 V-Ratio : 0.99
5,777.48 5,769.4 5,768.12 5,737.35 5,806.2 5,817.06 5,900.42 5,900.42 5,994.64 6,031.44
2017 Feb Mar Apr May Jun Jul Aug
Optimization Trading System - ©2010
^JKSE - Volume = 4,134,004,736.00, Avg.Volume = 5,379,943,936.00
4,134,004,736 5,379,943,936
Aliran dana keluar dan volatilitaspergerakkan indeks turun sudah terbatas.
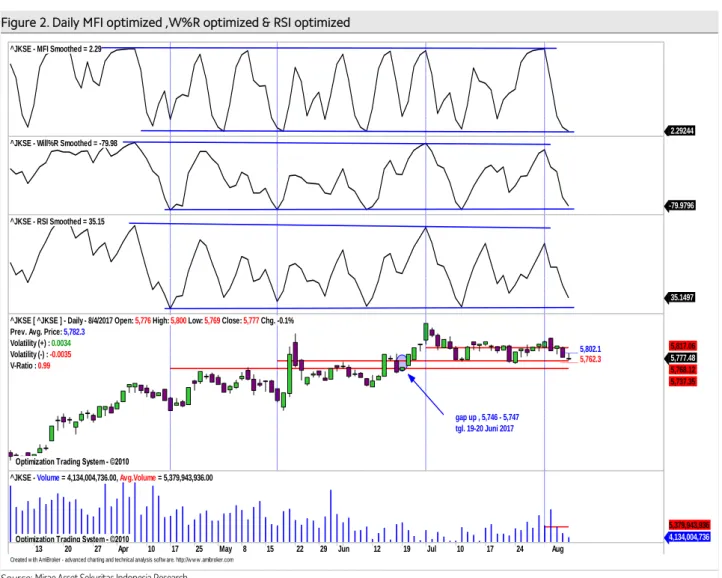
Pada Figure 2, terlihat dari hasil optimalisasi terakhir pada periode daily terlihat indikator MFI optimized , indikator W%R optimized dan indikator RSI optimized , menguji support trendline dengan kecenderungan menguat. Sementara itu pada Figure 3 pada periode weekly pergerakkan indikator MFI Optimized cenderung naik dan indikator W%R optimized sudah berada di support trendline.Daily resistance di 5,802 dan daily support di 5,762. Cut loss level di 5,762
Figure 2. Daily MFI optimized ,W%R optimized & RSI optimized
Source: Mirae Asset Sekuritas Indonesia Research
Created w ith AmiBroker - advanced charting and technical analysis softw are. http://w w w .amibroker.com
^JKSE - MFI Smoothed = 2.29
2.29244
^JKSE - Will%R Smoothed = -79.98
-79.9796
^JKSE - RSI Smoothed = 35.15
35.1497
_____ 5,802.1 _____ 5,762.3
Optimization Trading System - ©2010 Optimization Trading System - ©2010 Optimization Trading System - ©2010
gap up , 5,746 - 5,747 tgl. 19-20 Juni 2017
^JKSE [ ^JKSE ] - Daily - 8/4/2017 Open: 5,776 High: 5,800 Low: 5,769 Close: 5,777 Chg. -0.1%
Prev. Avg. Price: 5,782.3 Volatility (+) : 0.0034 Volatility (-) : -0.0035
V-Ratio : 0.99 5,777.48
5,768.12 5,737.35 5,817.06
13 20 27 Apr 10 17 25 May 8 15 22 29 Jun 12 19 Jul 10 17 24 31Aug
Optimization Trading System - ©2010
^JKSE - Volume = 4,134,004,736.00, Avg.Volume = 5,379,943,936.00
4,134,004,736 5,379,943,936
Figure 3. Weekly MFI optimized & W%R optimized
Source: Mirae Asset Sekuritas Indonesia Research
IHSG untuk mampu naik lebih lanjut, harus mampu bertahan diatas level 5,782
Untuk mampu kembali bergerak naik, indeks ini harus mampu dipertahankan pada level 5,782 Terlihat pada pergerakkan daily, rata-rata koreksi normal selama periode analisis adalah sekitar +0.35%, sementara saat ini di level -0.1%. Sementara itu pada pergerakkan weekly potensi koreksi normal rata-rata sekitar -0.77%, saat ini sekitar - 0.9%. Dengan demikian potensi koreksi mulai tertahan dengan kecenderungan bottom reversal. Pada Figure 4,5 dan 6 terlihat perkiraan normal trading range untuk masing- masing periode.
Figure 4. Daily : 5,762 – 5,802 Figure 5. Weekly : 5,757– 5,864 Figure 6. Monthly : 5,565 – 5,919
x
Source: Mirae Asset Sekuritas Indonesia Research Source: Mirae Asset Sekuritas Indonesia Research Source: Mirae Asset Sekuritas Indonesia Research
Created w ith AmiBroker - advanced charting and technical analysis softw are. http://w w w .amibroker.com
^JKSE - MFI Smoothed = 48.20
48.2029
^JKSE - Will%R Smoothed = -40.15
-40.1494
Optimization Trading System - ©2010
_____ 5,864.5 _____ 5,757.3
Optimization Trading System - ©2010 Optimization Trading System - ©2010
^JKSE [ ^JKSE ] - Weekly - 8/4/2017 Open: 5,820 High: 5,859 Low: 5,769 Close: 5,777 Chg. -0.9%
Prev. Avg. Price: 5,801.9 Volatility (+) : 0.0108 Volatility (-) : -0.0077 V-Ratio : 1.40
5,985.19 5,884.85 5,884.85 5,784.5 5,777.48 5,723.42 5,710.6 6,059.1
May Jun Jul Aug Sep Oct Nov Dec 2017 Feb Mar Apr May Jun 22Jul Aug
Optimization Trading System - ©2010
^JKSE - Volume = 26,899,720,192.00, Avg.Volume = 23,594,422,272.00
26,899,720,192 23,594,422,272
Created w ith AmiBroker - advanced charting and technical analysis sof tw are. http://w w w .amibroker.com _____ 5,802.1
_____ 5,762.3 5,782.3
^JKSE [ ^JKSE ] - Daily - 8/4/2017 Open: 5,776 High: 5,800 Prev. Avg. Price: 5,782.3
Volatility (+) : 0.0034 Volatility (-) : -0.0035 V-Ratio : 0.99
5,777.48
17 24 31Aug
^JKSE - Volume = 4,134,004,736.00
4,134,004,736
Created w ith AmiBroker - advanced charting and technical analysis sof tw are. http://w w w .amibroker.com _____ 5,864.5
_____ 5,757.3 5,801.9
^JKSE [ ^JKSE ] - Weekly - 8/4/2017 Open: 5,820 High: 5,859 Prev. Avg. Price: 5,801.9
Volatility (+) : 0.0108 Volatility (-) : -0.0077 V-Ratio : 1.40
5,777.48
Apr Jul
^JKSE - Volume = 26,899,720,192.00
26,899,720,192
Created w ith AmiBroker - advanced charting and technical analysis sof tw are. http://w w w .amibroker.com _____ 6,037.1
_____ 5,565.2 5,801.9
5,683.6 5,919.5
^JKSE [ ^JKSE ] - Monthly - 8/4/2017 Open: 5,854 High: 5,859 Prev. Avg. Price: 5,801.9
Volatility (+) : 0.0405 Volatility (-) : -0.0408 V-Ratio : 0.99
5,777.48
Apr Jul Oct2017 Jul
^JKSE - Volume = 21,423,812,608.00
21,423,812,608
Stocks on our focus list
Bank Danamon (BDMN)-Daily,Buy on Weakness
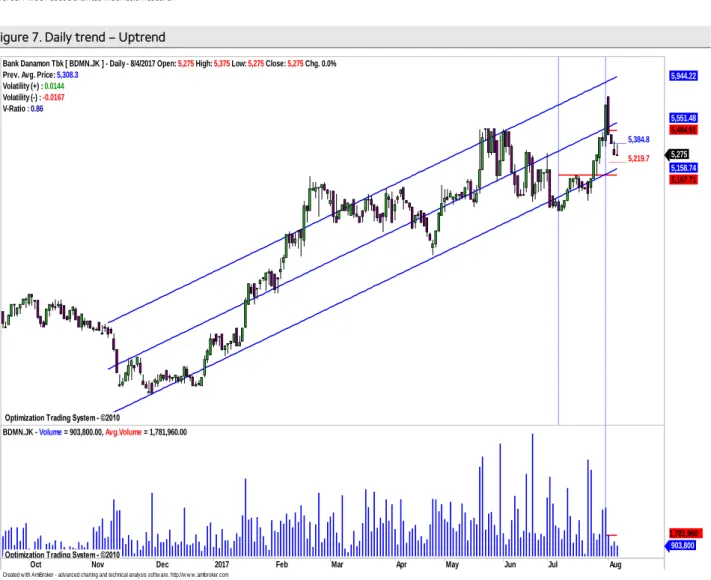
Harga akan coba naik mendekati center line pada uptrend channel.
Secara umum harga saham ini masih bergerak pada uptrend channel yang masih relatif valid (r-squared = 0.75) selama 175 hari terakhir yang bergerak normal dalam rentang +/- 1.57 std.deviasi dari center line. Peluang harga keluar dari pergerakan normal sekitar 11.77 % (sekitar 34 bar chart ). Rata-rata volatilitas normal pergerakan harga saat ini sebesar antara +1.44 % / - 1.67% atau +76.44 rupiah / -88.65 rupiah (rata-rata pergerakan normal positif / negatif selama periode analisis) sebagaimana terlihat pada Figure 7.
Summary
Item Data Item Data
Close (Aug 4, 2017) 5,275(+0.0%) Trading range 5,150 – 5,650
Relative Avg. Price performance to JCI (%) 8.79 Target
β (beta) 1.82 - Daily 5,375
Corelation 0.75 - Weekly 5,650
Period 175 - Monthly 5,975
r-squared 0.802 Stop loss 5,100
Volatility (+/-, %) +1.44 / -1.67
Volatility (+/-, Rp.) +76.44 / -88.65
Source: Mirae Asset Sekuritas Indonesia Research
Figure 7. Daily trend – Uptrend
Source: Mirae Asset Sekuritas Indonesia Research
Created w ith AmiBroker - advanced charting and technical analysis softw are. http://w w w .amibroker.com
_____ 5,384.8 _____ 5,219.7
Optimization Trading System - ©2010 Optimization Trading System - ©2010 Optimization Trading System - ©2010
Bank Danamon Tbk [ BDMN.JK ] - Daily - 8/4/2017 Open: 5,275 High: 5,375 Low: 5,275 Close: 5,275 Chg. 0.0%
Prev. Avg. Price: 5,308.3 Volatility (+) : 0.0144 Volatility (-) : -0.0167 V-Ratio : 0.86
5,275 5,158.74 5,107.71 5,484.91 5,551.48 5,944.22
Oct Nov Dec 2017 Feb Mar Apr May Jun Jul Aug
Optimization Trading System - ©2010
BDMN.JK - Volume = 903,800.00, Avg.Volume = 1,781,960.00
903,800 1,781,960
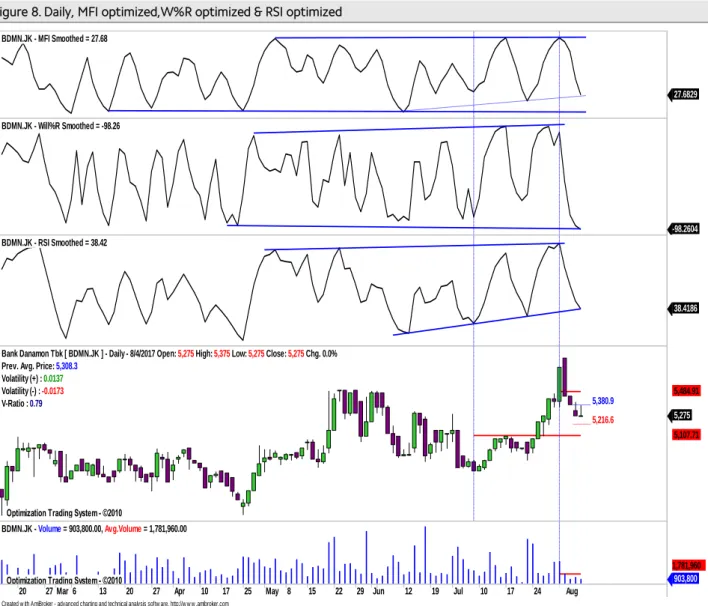
Aliran dana keluar dan volatilitas harga turun masih terlihat namun mulai terbatas.
Pada Figure 8, terlihat dari hasil optimalisasi terakhir, indikator MFI optimized, W%R optimized dan RSI optimized akan mennguji support trendline. Daily resistance terdekat di 5,37 sebelum ke weekly resistance di 5,650. Dailysupport di 5,225 dan weeklysupport di 5,150. Cut loss level di 5,100.
Figure 8. Daily, MFI optimized,W%R optimized & RSI optimized
Source: Mirae Asset Sekuritas Indonesia Research
Created w ith AmiBroker - advanced charting and technical analysis softw are. http://w w w .amibroker.com BDMN.JK - MFI Smoothed = 27.68
27.6829
BDMN.JK - Will%R Smoothed = -98.26
-98.2604 BDMN.JK - RSI Smoothed = 38.42
38.4186
_____ 5,380.9 _____ 5,216.6
Optimization Trading System - ©2010 Optimization Trading System - ©2010
Bank Danamon Tbk [ BDMN.JK ] - Daily - 8/4/2017 Open: 5,275 High: 5,375 Low: 5,275 Close: 5,275 Chg. 0.0%
Prev. Avg. Price: 5,308.3 Volatility (+) : 0.0137 Volatility (-) : -0.0173 V-Ratio : 0.79
5,275 5,107.71 5,484.91
20 27 Mar 6 13 20 27 Apr 10 17 25 May 8 15 22 29 Jun 12 19 Jul 10 17 24 31Aug
Optimization Trading System - ©2010
BDMN.JK - Volume = 903,800.00, Avg.Volume = 1,781,960.00
903,800 1,781,960
Harga akan coba naik dan bertahan diatas rata-rata pada masing-masing periode.
Untuk mampu naik lebih lanjut, harga saham saat ini harus mampu minimal bertahan diatas rata-rata masing-masing periode (positive area) .Pada pergerakkan daily coba bertahandi dengan kenaikkan +0.0% sementara itu kenaikkan normal rata-rata di level - 1.44%. Sementara itu pada pergerakkan weekly harga sudah terkoreksi sekitar -2.3%.
Normal koreksi sekitar -3.03% Dengan demikian potensi koreksi masih terlihat namun sudah terbatas. Pada Figure 9,10 dan 11 terlihat perkiraan normal trading range untuk masing-masing periode.
Figure 9. Daily : 5,225 – 5,375 Figure 10. Weekly : 5,100 – 5,650 Figure 11. Monthly : 4,975 – 5,975
Source: Mirae Asset Sekuritas Indonesia Research Source: Mirae Asset Sekuritas Indonesia Research Source: Mirae Asset Sekuritas Indonesia Research
Created w ith AmiBroker - advanced charting and technical analysis sof tw are. http://w w w .amibroker.com _____ 5,384.8
_____ 5,219.7 5,308.3 Bank Danamon Tbk [ BDMN.JK ] - Daily - 8/4/2017 Open:
Prev. Avg. Price: 5,308.3 Volatility (+) : 0.0144 Volatility (-) : -0.0167 V-Ratio : 0.86
5,275
17 24 31Aug
BDMN.JK - Volume = 903,800.00
903,800
Created w ith AmiBroker - advanced charting and technical analysis sof tw are. http://w w w .amibroker.com _____ 5,978.9
_____ 4,971.9 5,441.7 Bank Danamon Tbk [ BDMN.JK ] - Monthly - 8/4/2017 Open:
Prev. Avg. Price: 5,441.7 Volatility (+) : 0.0987 Volatility (-) : -0.0863 V-Ratio : 1.14
5,275
Apr Jul Oct2017 Jul
BDMN.JK - Volume = 4,845,900.00
4,845,900 Created w ith AmiBroker - advanced charting and technical analysis sof tw are. http://w w w .amibroker.com
_____ 5,660.3
_____ 5,276.7 5,441.7
5,111.7 Bank Danamon Tbk [ BDMN.JK ] - Weekly - 8/4/2017 Open:
Prev. Avg. Price: 5,441.7 Volatility (+) : 0.0402 Volatility (-) : -0.0303 V-Ratio : 1.33
5,275
Apr Jul
BDMN.JK - Volume = 8,909,800.00
8,909,800
Bank Mandiri (BMRI)-Daily, Buy on Weakness
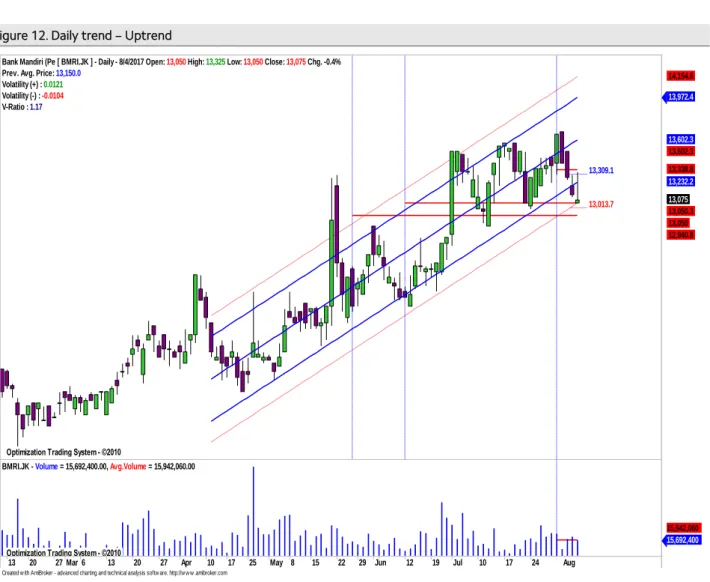
Harga akan coba naik mendekati normal lower band pada uptrend channel .
Secara umum harga saham ini juga masih bergerak dalam pola uptrend channel yang masih relatif valid (r-squared = 0.860) selama 71 hari terakhir dan bergerak normal dalam rentang +/- 1.48 std.deviasi dari center line. Peluang harga keluar dari pergerakan normal sekitar 13.96 % (sekitar 10 bar chart ). Rata-rata volatilitas normal pergerakan harga saat ini sebesar antara +1.21 % / - 1.04% atau +159.12 rupiah / - 136.76 rupiah (rata-rata pergerakan normal positif / negatif selama periode analisis) sebagaimana sebagaimana terlihat pada Figure 12.
Summary
Item Data Item Data
Close (Aug 4, 2017) 13,075(-0.4%) Trading range 12,975 –13,625 Relative Avg. Price performance to JCI (%) 9.09 Target
β (beta) 1.57 - Daily 13,300
Corelation 0.91 - Weekly 13,625
Period 71 - Monthly 13,650
r-squared 0.860 Stop loss 12,975
Volatility (+/-, %) +1.21 / -1.04
Volatility (+/-, Rp.) +159.12 / -136.76
Source: Mirae Asset Sekuritas Indonesia Research
Figure 12. Daily trend – Uptrend
Source: Mirae Asset Sekuritas Indonesia Research
Created w ith AmiBroker - advanced charting and technical analysis softw are. http://w w w .amibroker.com Optimization Trading System - ©2010
_____ 13,309.1
_____ 13,013.7
Optimization Trading System - ©2010 Optimization Trading System - ©2010 Optimization Trading System - ©2010 Optimization Trading System - ©2010
Bank Mandiri (Pe [ BMRI.JK ] - Daily - 8/4/2017 Open: 13,050 High: 13,325 Low: 13,050 Close: 13,075 Chg. -0.4%
Prev. Avg. Price: 13,150.0 Volatility (+) : 0.0121 Volatility (-) : -0.0104 V-Ratio : 1.17
13,972.4
13,602.3 13,602.3 13,338.8 13,232.2 13,075 13,050.3 13,050 12,940.8 14,154.6
13 20 27 Mar 6 13 20 27 Apr 10 17 25 May 8 15 22 29 Jun 12 19 Jul 10 17 24 31Aug
Optimization Trading System - ©2010
BMRI.JK - Volume = 15,692,400.00, Avg.Volume = 15,942,060.00
15,692,400 15,942,060
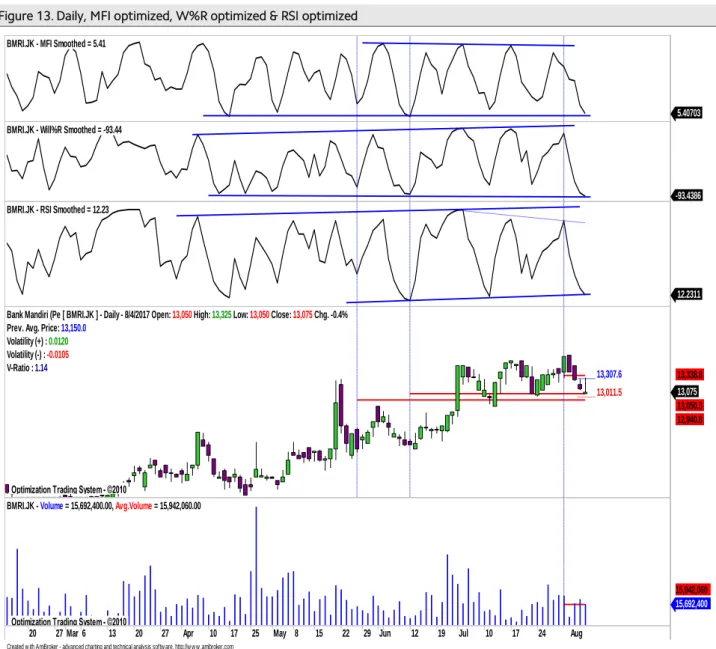
Aliran dana keluar dan volatilitas harga turun masih terlihat namun mulai terbatas.
Pada Figure 13, terlihat dari hasil optimalisasi indikator MFI optimized, W%R optimized dan RSI optimized akan menguji support trend line .Weekly resistance di 13,625 dengan catatan daily resistance dapat ditembus di 13,300. Sementara itu weekly support di 12,975 dengan catatan daily support di 13,000 juga dapat ditembus.Cut loss level di 12,975.
Figure 13. Daily, MFI optimized, W%R optimized & RSI optimized
Source: Mirae Asset Sekuritas Indonesia Research
Created w ith AmiBroker - advanced charting and technical analysis softw are. http://w w w .amibroker.com
BMRI.JK - MFI Smoothed = 5.41
5.40703 BMRI.JK - Will%R Smoothed = -93.44
-93.4386 BMRI.JK - RSI Smoothed = 12.23
12.2311
_____ 13,307.6 _____ 13,011.5
Optimization Trading System - ©2010 Optimization Trading System - ©2010 Optimization Trading System - ©2010
Bank Mandiri (Pe [ BMRI.JK ] - Daily - 8/4/2017 Open: 13,050 High: 13,325 Low: 13,050 Close: 13,075 Chg. -0.4%
Prev. Avg. Price: 13,150.0 Volatility (+) : 0.0120 Volatility (-) : -0.0105 V-Ratio : 1.14
13,075 13,050.3 12,940.8 13,338.8
20 27 Mar 6 13 20 27 Apr 10 17 25 May 8 15 22 29 Jun 12 19 Jul 10 17 24 31Aug
Optimization Trading System - ©2010
BMRI.JK - Volume = 15,692,400.00, Avg.Volume = 15,942,060.00
15,692,400 15,942,060
Harga saat ini akan coba naik dan bertahan diatas rata-ratapada masing-masing periode.
Untuk mampu naik lebih lanjut, harga saham saat ini harus mampu minimal bertahan diatas rata-rata masing-masing periode (positive area) . Jika dilihat lebih lanjut koreksi normal pada pergerakkan daily sekitar -1.05%, saat ini di level -0.4 %. Sementara itu pada pergerakkan weekly koreksi normal sekitar -2.10 %, saat ini sekitar -2.2 %. Dengan demikian potensi koreksi makin terbatas. Pada Figure 14,15 dan 16 terlihat perkiraan normal trading range untuk masing-masing periode.
Figure 14. Daily : 13,000 – 13,300 Figure 15. Weekly : 12,975 – 13,625 Figure 16. Monthly : 12,250 – 13,650 x
Source: Mirae Asset Sekuritas Indonesia Research Source: Mirae Asset Sekuritas Indonesia Research Source: Mirae Asset Sekuritas Indonesia Research
Created w ith AmiBroker - advanced charting and technical analysis sof tw are. http://w w w .amibroker.com _____ 13,307.6
_____ 13,011.5 13,150 Bank Mandiri (Pe [ BMRI.JK ] - Daily - 8/4/2017 Open: 13,050 Prev. Avg. Price: 13,150.0
Volatility (+) : 0.0120 Volatility (-) : -0.0105 V-Ratio : 1.14
13,075
10 17 24 31Aug
BMRI.JK - Volume = 15,692,400.00
15,692,400
Created w ith AmiBroker - advanced charting and technical analysis sof tw are. http://w w w .amibroker.com _____ 13,629.2
_____ 12,988.3 13,266.7 Bank Mandiri (Pe [ BMRI.JK ] - Weekly - 8/4/2017 Open:
Prev. Avg. Price: 13,266.7 Volatility (+) : 0.0273 Volatility (-) : -0.0210 V-Ratio : 1.30
13,075
Apr Jul
BMRI.JK - Volume = 79,710,304.00
79,710,304
Created w ith AmiBroker - advanced charting and technical analysis sof tw are. http://w w w .amibroker.com _____ 14,407.0
_____ 12,245.0 13,266.7 13,656.8
12,755.9 Bank Mandiri (Pe [ BMRI.JK ] - Monthly - 8/4/2017 Open:
Prev. Avg. Price: 13,266.7 Volatility (+) : 0.0860 Volatility (-) : -0.0770 V-Ratio : 1.12
13,075
AprJul Oct 2017 Jul
BMRI.JK - Volume = 58,355,900.00
58,355,900
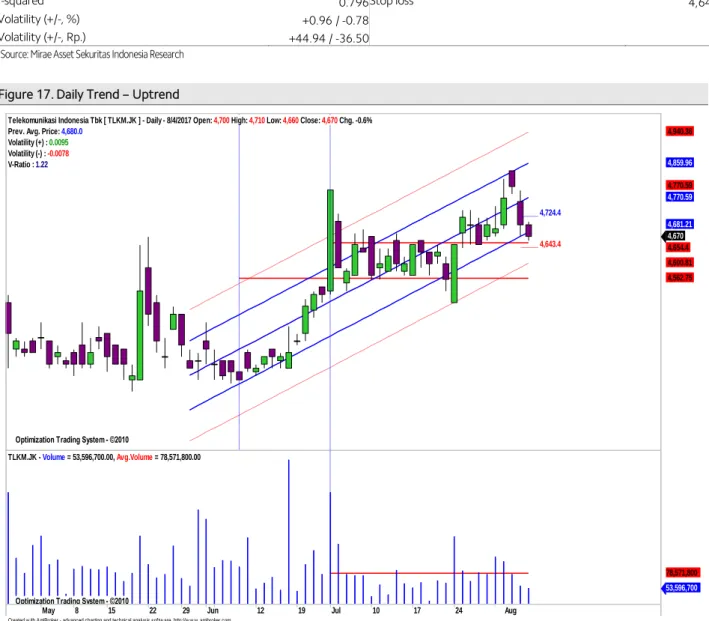
Telekomunikasi Indonesia (TLKM) - Daily, Buy on Weakness Harga akan coba bertahan diatas normal lower band pada uptrend channel.
Secara umum harga saham ini akan mencoba bertahan diatas normal lower band pada uptrend channel yang masih relatif valid dengan r-squared = 0.94 selama 42 hari terakhir dan bergerak normal dalam rentang +/-127 std.deviasi dari centerline. Peluang harga keluar dari pergerakan normalnya sekitar 20.37 % (sekitar 8 bar chart ). Rata-rata volatilitas normal pergerakan harga saat ini sebesar antara +0.96 % / - 0.78 % atau +44.94 rupiah / -36.50 rupiah (rata-rata pergerakan normal positif / negatif selama periode analisis)sebagaimana terlihat pada Figure 17.
Summary
Item Data Item Data
Close (Aug 4, 2017) 4,670 (-0.6%) Normal trading range 4,640 – 4,720 Relative Avg. Price performance to JCI (%) 9.93 Target
β (beta) 1.66 - Daily 4,720
Corelation 0.94 - Weekly 4,840
Period 42 - Monthly 4,980
r-squared 0.796 Stop loss 4,640
Volatility (+/-, %) +0.96 / -0.78
Volatility (+/-, Rp.) +44.94 / -36.50
Source: Mirae Asset Sekuritas Indonesia Research
Figure 17. Daily Trend – Uptrend
Source: Mirae Asset Sekuritas Indonesia Research
Created w ith AmiBroker - advanced charting and technical analysis softw are. http://w w w .amibroker.com
_____ 4,724.4
_____ 4,643.4
Optimization Trading System - ©2010 Optimization Trading System - ©2010 Optimization Trading System - ©2010 Optimization Trading System - ©2010
Telekomunikasi Indonesia Tbk [ TLKM.JK ] - Daily - 8/4/2017 Open: 4,700 High: 4,710 Low: 4,660 Close: 4,670 Chg. -0.6%
Prev. Avg. Price: 4,680.0 Volatility (+) : 0.0095 Volatility (-) : -0.0078 V-Ratio : 1.22
4,670 4,654.4 4,600.81 4,562.75 4,681.21 4,770.59 4,770.59 4,859.96 4,940.36
May 8 15 22 29 Jun 12 19 Jul 10 17 24 31 Aug
Optimization Trading System - ©2010
TLKM.JK - Volume = 53,596,700.00, Avg.Volume = 78,571,800.00
53,596,700 78,571,800
Aliran dana keluar dan volatilitas harga turun masih terlihat namun mulai terbatas.
Pada Figure 18, terlihat dari hasil optimalisasi, indikator MFI Optimized dan indikator RSI Optimized akan menguji support trend line. Dengan demikian diperkirakan potensi koreksi mulai terbatas. Perkiraan daily resistance di 4,720 sebelum ke weekly resistance di 4,840. Daily support di 4,640 dan weekly support di 4,650.Cut loss level di 4,640.
Figure 18. Daily MFI optimized & RSI optimized
Source: Mirae Asset Sekuritas Indonesia Research
Created w ith AmiBroker - advanced charting and technical analysis softw are. http://w w w .amibroker.com TLKM.JK - MFI Smoothed = 61.90
61.9038
TLKM.JK - Will%R Smoothed = -66.69
-66.6903
_____ 4,732.0 _____ 4,644.4
Optimization Trading System - ©2010 - Powered by AMTA Optimization Trading System - ©2010 - Powered by AMTA
Telekomunikasi Indonesia Tbk [ TLKM.JK ] - Daily - 8/4/2017 Open: 4,700 High: 4,710 Low: 4,660 Close: 4,670 Chg. -0.6%
Prev. Avg. Price: 4,680.0 Volatility (+) : 0.0111 Volatility (-) : -0.0076 V-Ratio : 1.46
4,670 4,654.4 4,562.75
Feb Mar Apr May Jun Jul Aug
Optimization Trading System - ©2010 - Powered by AMTA TLKM.JK - Volume = 53,596,700.00, Avg.Volume = 78,571,800.00
53,596,700 78,571,800
Relative Avg.Price Performance to JCI (%) : Persentase kenaikan harga saham dari rata-rata sejak IHSG memulai uptrend-nya β (beta) : Indikator sensitivitas harga saham terhadap IHSG, beta diatas 1 berarti harga makin sensitif terhadap pergerakan IHSG dan sebaliknya
Correlation : Ukuran kuat hubungan (korelasi) pergerakan harga saham dibanding dengan pergerakan IHSG selama periode analisis.
Period : Periode uptrend / downtrend yang valid dari pergerakan harga saham.
r-squared : Koefisien determinasi, menunjukkan persentase gerakan yang dapat dijelaskan dengan regresi linier.Nilai R2 terletak antara 0 – 1, dan kecocokan model dikatakan lebih baik kalau R2 semakin mendekati 1 (validitas uptrend atau downtrend makin valid) Volatility (+/-%) : Besaran volatilitas normal maksimal/minimal dari pergerakan harga harian selama harga saham bergerak normal pada trend channel dalam persentase.
Volatility (+/- point or Rp) : Besaran volatilitas normal maksimal/minimal dari pergerakan harga harian selama harga saham bergerak dalam periode analisis.
Harga akan coba naik dan bertahan diatas rata-ratapada masing-masing periode.
Untuk mampu naik lebih lanjut, harga saham saat ini harus mampu minimal bertahan diatas rata-rata masing-masing periode (positive area) . Jika dilihat lebih lanjut koreksi normal pada pergerakkan daily sekitar -0.78%, saat ini di level -0.6 %.Sementara itu pada pergerakkan weekly koreksi normal sekitar -1.51 %, saat ini baru -0.6 %.Dengan demikan potensi koreksi harga masih terlihat namun mulai terbatas. Pada Figure 19,20 dan 21 terlihat perkiraan normal trading range untuk masing-masing periode.
Figure 19. Daily : 4,640 – 4,720 Figure 20. Weekly : 4,650 – 4,840 Figure 21. Monthly : 4,530 – 4,980
Source: Mirae Asset Sekuritas Indonesia Research Source: Mirae Asset Sekuritas Indonesia Research Source: Mirae Asset Sekuritas Indonesia Research
Buy: : Beli, harga sudah menyentuh atau jatuh di bawah support dan indikator teknikal berada di oversold area.
Sell: : Jual, harga sudah menyentuh atau tembus resistance normal dan indikator berada di overbought area.
BoW: : Buy on Weakness, beli ketika harga sudah melemah, dimana volume tekanan jual mulai berkurang dan harga mendekati support, serta indikator teknikal sudah berada di oversold area.
SoS: : Sell on Strength, jual ketika kenaikan harga sudah mulai terbatas dimana volume beli mulai berkurang dan harga mendekati resistance, serta indikator teknikal sudah berada di overbought area.
Trading Buy: : Beli dan jual kembali secepatnya jika harga sudah mencapai level resistance terdekat, karena kenaikan harga relatif tidak stabil atau hanya sementara.
Trading Sell : Jual dan beli kembali secepatnya jika harga sudah mencapai level support terdekat karena koreksi harga relatif tidak stabil atau hanya sementara.
Created w ith AmiBroker - advanced charting and technical analysis sof tw are. http://w w w .amibroker.com _____ 4,724.4
_____ 4,643.4 4,723.3 Telekomunikasi Indonesia Tbk [ TLKM.JK ] - Daily - 8/4/2017 Prev. Avg. Price: 4,680.0
Volatility (+) : 0.0095 Volatility (-) : -0.0078 V-Ratio : 1.22
4,670
10 17 24 31Aug
TLKM.JK - Volume = 53,596,700.00
53,596,700
Created w ith AmiBroker - advanced charting and technical analysis sof tw are. http://w w w .amibroker.com _____ 4,839.3
_____ 4,651.8 4,723.3 Telekomunikasi Indonesia Tbk [ TLKM.JK ] - Weekly - 8/4/2017 Prev. Avg. Price: 4,723.3
Volatility (+) : 0.0245 Volatility (-) : -0.0151 V-Ratio : 1.62
4,670
Apr Jul
TLKM.JK - Volume = 391,323,104.00
391,323,104
Created w ith AmiBroker - advanced charting and technical analysis sof tw are. http://w w w .amibroker.com _____ 4,986.6
_____ 4,534.1 4,723.3 Telekomunikasi Indonesia Tbk [ TLKM.JK ] - Monthly - Prev. Avg. Price: 4,723.3
Volatility (+) : 0.0557 Volatility (-) : -0.0401 V-Ratio : 1.39
4,670
AprJul Oct2017 Jul TLKM.JK - Volume = 285,702,592.00
285,702,592
Chart 22. JCI Vs. USD/IDR Chart 23. JCI performance (absolute vs. relative)
Source: Bloomberg, Mirae Asset Sekuritas Indonesia Note: Relative to MSCI EM Index
Source: Bloomberg, Mirae Asset Sekuritas Indonesia
Chart 24. Foreigner’s net purchase (EM) Chart 25. Energy price
Note: The latest figure for India are August 3rd, 2017
Source: Bloomberg, Mirae Asset Sekuritas Indonesia Source: Bloomberg, Mirae Asset Sekuritas Indonesia
Chart 26. Non-ferrous metal price Chart 27. Precious metal price
Source: Bloomberg, Mirae Asset Sekuritas Indonesia Source: Bloomberg, Mirae Asset Sekuritas Indonesia 13,200
13,300 13,400 13,500 13,600 13,700 13,800
5,400 5,500 5,600 5,700 5,800 5,900 6,000
5/8 6/5 7/3 7/31
(IDR)
(pt) JCI (L) USD/IDR (R)
-0.1
-0.9 -0.6
6.6
-0.4
-1.0
-7.1
-13.9 -16
-12 -8 -4 0 4 8
1D 1W 1M 1Y
Absolute Relative (%, %p)
(%, %p) (%, %p)
-174 -85
-14 -28
0 9
-733
-51 -32
-400 5
-238
-800 -700 -600 -500 -400 -300 -200 -100 0 100
Korea Taiwan Indonesia Thailand Philippines India
1 Day 5 Days
(USDmn) (USDmn) (USDmn) (USDmn)
75 85 95 105 115 125 135
5/8 6/5 7/3 7/31
CPO WTI Coal
(D-3M=100) (D-3M=100)
90 95 100 105 110 115 120
5/8 6/5 7/3 7/31
(D-3M=100) Copper Nickel Tin
90 97 104 111
5/8 6/5 7/3 7/31
Silver Gold Platinum
(D-3M=100)
Table. Key valuation metrics
Company Name Ticker
Price Market Cap Price Performance (%) P/E(X)* P/B(X)* ROE(%)*
(IDR) (IDRbn) 1D 1W 1M 1Y FY16 FY17 FY16 FY17 FY16 FY17
Jakarta Composite Index JCI 5,777 6,356,486 -0.1 -0.9 -1.5 7.5 16.6 14.5 2.6 0.0 18.8 10.2
FINANCIALS
Bank Central Asia BBCA 18,575 457,967 -0.9 -1.2 0.1 23.8 18.5 20.0 3.4 3.5 20.4 18.8
Bank Mandiri Persero BMRI 13,075 305,083 -0.4 -2.2 -3.1 23.9 19.6 15.4 1.8 1.9 10.3 12.4
Bank Rakyat Indonesia Persero BBRI 14,925 368,187 0.5 2.9 -2.5 26.5 10.9 13.1 1.9 2.3 20.2 18.1
Bank Negara Indonesia Persero BBNI 7,275 135,669 1.4 -1.0 10.6 33.5 9.1 10.3 1.2 1.4 13.9 14.4
Bank Tabungan Negara Persero BBTN 2,640 27,958 1.1 1.9 0.0 37.5 13.3 12.8 1.0 1.3 7.6 10.5
CONSUMER
HM Sampoerna HMSP 3,470 403,624 -1.1 -4.9 -8.9 -14.1 34.8 30.2 13.0 11.3 38.6 38.1
Gudang Garam GGRM 71,650 137,861 0.8 -10.2 -8.7 4.1 18.4 18.6 3.1 3.2 17.3 17.8
Indofood CBP Sukses Makmur ICBP 8,300 96,794 0.0 -2.1 -5.7 -6.2 27.8 24.9 5.7 4.9 21.8 21.0
Indofood Sukses Makmur INDF 8,225 72,219 -0.3 -4.4 -6.0 -0.3 18.3 16.2 2.4 2.3 14.7 14.7
Kalbe Farma KLBF 1,775 83,203 2.3 3.2 7.3 4.7 30.9 32.9 6.0 6.2 20.6 19.8
Unilever Indonesia UNVR 47,575 362,997 -0.3 -1.7 -2.4 3.8 46.3 49.7 62.9 66.3 134.1 142.2
AGRICULTURAL
Astra Agro Lestari AALI 15,125 29,111 -0.3 3.8 1.5 -0.5 14.8 13.6 1.9 1.6 14.1 11.7
PP London Sumatera Indonesia LSIP 1,405 9,586 -1.1 0.0 1.4 -5.7 20.0 12.4 1.6 1.2 7.9 9.7
Sawit Sumbermas Sarana SSMS 1,365 13,002 -3.9 -11.9 -17.0 -16.0 22.5 20.5 3.9 3.3 18.3 16.2
INFRASTRUCTURE
XL Axiata EXCL 3,430 36,660 -3.9 3.9 4.3 -6.3 60.8 123.9 1.2 1.7 2.1 1.2
Jasa Marga JSMR 5,475 39,737 -1.4 -3.9 0.0 -1.1 15.6 19.5 2.3 2.5 15.7 13.5
Perusahaan Gas Negara PGAS 2,150 52,119 -0.9 -4.9 -7.7 -34.8 15.3 10.8 1.5 1.2 9.8 12.1
Tower Bersama Infrastructure TBIG 6,675 30,247 0.4 -1.1 -9.2 12.7 17.4 24.2 14.3 13.0 83.6 62.5
Telekomunikasi Indonesia TLKM 4,670 470,736 -0.6 -0.6 1.7 8.6 20.3 20.0 4.7 4.9 24.3 25.8
Soechi Lines SOCI 290 2,047 0.0 -4.0 -2.7 -32.2 8.2 4.4 0.6 N/A 7.4 10.1
Garuda Indonesia GIAA 340 8,801 -0.6 -2.3 -2.9 -28.3 31.7 18.4 2.6 2.4 8.6 12.5
BASIC-INDUSTRIES
Semen Indonesia SMGR 10,325 61,243 -1.4 2.7 1.7 2.0 12.0 17.7 1.9 2.0 16.3 11.1
Charoen Pokphand Indonesia CPIN 2,810 46,078 1.4 2.6 -15.1 -27.9 22.6 16.7 3.6 2.9 16.5 18.5
Indocement Tunggal Prakarsa INTP 18,125 66,722 -2.3 2.7 -4.1 -1.0 14.6 22.1 2.2 2.4 15.5 10.7
Japfa Comfeed Indonesia JPFA 1,180 13,464 -0.4 0.4 -13.9 -20.3 7.7 8.4 1.9 1.4 28.6 17.1
MINING
Indo Tambangraya Megah ITMG 20,600 23,276 1.0 0.4 16.7 60.9 10.4 8.2 1.5 1.8 15.0 21.4
Adaro Energy ADRO 1,870 59,814 1.4 2.5 18.4 68.5 12.0 10.8 1.3 1.3 11.1 11.9
Aneka Tambang ANTM 660 15,860 -2.9 -4.3 -6.4 -19.0 298.3 58.1 1.2 1.0 0.4 0.2
Vale Indonesia INCO 2,460 24,443 1.2 -1.2 32.6 -1.6 #N/A
N/A 184.8 1.1 1.0 0.1 0.2
Tambang Batubara Bukit Asam PTBA 13,525 31,163 1.5 2.7 9.1 26.7 13.1 9.1 2.5 2.3 20.5 27.8
TRADE
United Tractors UNTR 29,200 108,920 0.0 -0.5 2.5 65.9 15.8 15.9 1.9 2.4 12.7 15.8
AKR Corporindo AKRA 6,550 26,201 -0.4 -3.3 4.0 -1.5 23.5 22.6 3.5 3.4 15.7 15.6
Global Mediacom BMTR 505 7,170 -1.0 -2.9 -11.4 -53.2 41.8 N/A 0.9 N/A 2.0 N/A
Matahari Department Store LPPF 11,375 33,191 3.9 -6.8 -17.6 -45.9 21.9 15.7 23.8 12.1 136.4 86.5
Media Nusantara Citra MNCN 1,595 22,770 1.6 -10.9 -7.3 -26.2 17.7 13.7 2.7 2.2 15.4 16.4
Matahari Putra Prima MPPA 590 3,173 0.0 -7.1 -12.6 -66.3 211.4 40.0 3.3 1.3 1.6 1.2
Surya Citra Media SCMA 2,330 34,068 -2.5 4.0 -8.3 -28.1 27.2 19.9 11.9 8.6 45.7 45.3
Siloam International Hospital SILO 9,300 12,096 -0.5 -5.6 -16.2 -8.9 150.3 89.9 4.5 3.7 3.5 4.2
PROPERTY
Bumi Serpong Damai BSDE 1,790 34,452 -0.8 2.3 -5.0 -13.1 18.8 13.3 1.6 1.4 9.1 11.3
Adhi Karya ADHI 2,130 7,585 0.5 -1.8 -1.8 -22.0 23.6 12.3 1.4 1.3 5.9 9.9
Alam Sutera Realty ASRI 354 6,956 1.1 15.7 11.3 -33.2 13.6 8.2 1.0 0.9 7.5 11.3
Ciputra Development CTRA 1,065 19,767 -0.5 3.9 -9.7 -26.8 19.9 16.7 2.2 1.5 9.8 10.0
Lippo Karawaci LPKR 735 16,962 2.8 7.3 5.8 -38.2 18.6 15.4 0.9 0.8 5.0 5.6
Pembangunan Perumahan PTPP 3,050 18,910 -0.3 -0.7 -9.2 -25.0 23.1 13.8 2.4 1.7 14.4 12.7
Pakuwon Jati PWON 700 33,712 1.4 0.7 8.5 10.2 16.3 17.7 3.1 3.2 21.0 18.8
Summarecon Agung SMRA 995 14,355 0.0 0.0 -22.9 -42.8 61.3 40.2 3.1 2.0 5.1 5.8
Wijaya Karya WIKA 2,000 17,940 -0.5 -3.4 -11.1 -32.3 14.4 14.3 1.8 1.4 12.9 10.1
Waskita Karya WSKT 2,280 30,948 -0.4 -3.8 -2.1 -18.3 17.3 12.4 3.1 2.0 16.6 18.0
MISCELLANEOUS
Astra International ASII 7,775 314,760 0.0 -2.2 -11.4 0.3 22.1 16.1 3.0 2.5 14.2 16.1
Source: Bloomberg, Mirae Asset Sekuritas Indonesia
*Note: Valuation metrics based on Bloomberg consensus estimates
Sector performance Top 10 market cap performance
Name Index Chg (%) Ticker Price Market Cap (IDRbn) Chg (%)
Agricultural 1,727.7 -0.5 BRAM IJ 18000 8,100 20.00
Mining 1,500.5 1.6 BYAN IJ 6750 22,500 17.90
Basic-Industry 607.2 -1.2 PSAB IJ 218 5,768 9.00
Miscellaneous Industry 1,342.7 0.4 RIMO IJ 306 12,526 8.51
Consumer Goods 2,406.2 -0.2 NISP IJ 1900 21,798 8.3
Property & Construction 497.4 0.2 LPPF IJ 11375 33,191 3.88
Infrastructure 1,214.5 -0.3 KAEF IJ 3050 16,940 3.39
Finance 968.8 0.0 DOID IJ 865 7,358 2.98
Trade 916.8 0.3 HRUM IJ 2480 6,705 2.9
Composite 5,777.5 -0.1 MKPI IJ 28300 26,834 2.82
Source: Bloomberg
Top 5 leading movers Top 5 lagging movers
Name Chg (%) Close Name Chg (%) Close
BYAN IJ 17.9 6,750 HMSP IJ -1.1 3,470
TAMU IJ 17.5 3,500 BBCA IJ -0.9 18,575
KLBF IJ 2.3 1,775 TLKM IJ -0.6 4,670
BBNI IJ 1.4 7,275 TPIA IJ -3.0 25,750
BBRI IJ 0.5 14,925 INTP IJ -2.3 18,125
Source: Bloomberg
Economic Calendar
Time Currency Detail Forecast Previous
All Day AUD Bank Holiday
6:30am AUD AIG Construction Index 56.0
8:30am AUD ANZ Job Advertisements m/m 2.7%
10:00am NZD Inflation Expectations q/q 1.9%
12:00pm JPY Leading Indicators 104.6%
1:00pm EUR German Industrial Production m/m 1.2%
2:00pm CHF Foreign Currency Reserves 693B
2:15pm CHF CPI m/m -0.1%
2:30pm GBP Halifax HPI m/m -1.0%
3:30pm EUR Sentix Investor Confidence 28.3
All Day CAD Bank Holiday
7th-12th USD Mortgage Delinquencies 4.71%
9:00pm USD Labor Market Conditions Index m/m 1.5
Note: Time is based on Indonesian local time Source: Forex Factory
Disclaimers
This report is prepared strictly for private circulation only to clients of PT Mirae Asset Sekuritas Indonesia (MASI). It is purposed only to person having professional experience in matters relating to investments. The information contained in this report has been taken from sources which we deem reliable. No warranty (express or implied) is made to the accuracy or completeness of the information. All opinions and estimates included in this report constitute our judgments as of this date, without regards to its fairness, and are subject to change without notice. However, none of MASI and/or its affiliated companies and/or their respective employees and/or agents makes any representation or warranty (express or implied) or accepts any responsibility or liability as to, or in relation to, the accuracy or completeness of the information and opinions contained in this report or as to any information contained in this report or any other such information or opinions remaining unchanged after the issue thereof. We expressly disclaim any responsibility or liability (express or implied) of MASI, its affiliated companies and their respective employees and agents whatsoever and howsoever arising (including, without limitation for any claims, proceedings, action, suits, losses, expenses, damages or costs) which may be brought against or suffered by any person as a results of acting in reliance upon the whole or any part of the contents of this report and neither MASI, its affiliated companies or their respective employees or agents accepts liability for any errors, omissions or misstatements, negligent or otherwise, in the report and any liability in respect of the report or any inaccuracy therein or omission there from which might otherwise arise is hereby expresses disclaimed.
This document is not an offer to sell or a solicitation to buy any securities. This firms and its affiliates and their officers and employees may have a position, make markets, act as principal or engage in transaction in securities or related investments of any company mentioned herein, may perform services for or