Andy Wibowo Gunawan +62-21-515-1140 [email protected] To subscribe to our Daily Focus, please contact us at [email protected]
Mirae Asset Sekuritas Indonesia
ADRO’s full-year 2017F sales volume
Source: Company Data, Mirae Asset Sekuritas Indonesia
May 16, 2017
ADRO: Not a structural matter
Meskipun saham Adaro Energy (ADRO) baru-baru ini turun menjadi Rp1.460 (dari level tertinggi YTD di IDR 1.900), kami mempertahankan target harga 12 bulan kami sebesar Rp2.425 pada saham. Kami tetap optimis mengenai fundamental ADRO, mengingat: 1) menyediakan kontrak dengan pembangkit listrik mencapai sekitar 90% dari volume penjualan batubara ke China; 2) harga batubara global tidak menunjukkan tanda-tanda penurunan tajam; 3) produksi batubara perusahaan meningkat 2Q17 dibandingkan triwulan sebelumnya; Dan 4) perusahaan diperdagangkan di bawah rata-rata P/E lima tahun. Kami tetap mempertahankan rekomendasi Beli pada saham ADRO, karena kami percaya sekarang adalah saat yang tepat bagi investor untuk mengoleksi saham.
2017F coal sales volume to China: Large portion is on a contract basis Selama setahun penuh, kami memperkirakan volume penjualan batubara ADRO ke China pada 7,5 juta ton, menyumbang 14,0% dari total volume penjualan 2017F.
Kami mencatat bahwa sebagian besar (sekitar 90,0%) volume penjualan batubara ke China tahun ini terdiri dari pasokan ke pembangkit listrik, yang umumnya ditetapkan dalam kontrak jangka panjang.
Global coal prices: No sign of sharp decline, despite China’s lower PMI Sementara PMI yang lebih rendah pada bulan April menunjukkan bahwa ekonomi China akan melambat tahun ini, kami mencatat bahwa persediaan batubara negara tersebut pada bulan April masih berada di bawah rata-rata 48 bulan.
2Q17 production: Improving thanks to better weather conditions Kami yakin produksi batubara 2Q17F akan meningkat menjadi 12,5 juta ton (+5,0%
QoQ) didukung kondisi cuaca yang membaik; Administrasi Kelautan dan Atmosfer Nasional (NOAA) hanya memprediksi La Nina ringan tahun ini.
Maintain Buy and TP of IDR2,425
Kami mempertahankan target harga 12 bulan ke depan IDR2.425 di ADRO, yang menyiratkan potensi kenaikan 63,3%.
Market Index
Last Trade Chg (%) MoM YoY
JCI 5,688.9 0.2 1.0 19.9
MSCI Indonesia 26.9 0.7 2.6 19.7
MSCI EM 1,010.2 0.8 4.4 25.7
HANG SENG 25,371.6 0.9 3.7 26.5
KOSPI 2,290.7 0.5 7.3 16.4
FTSE 7,454.4 0.3 1.5 20.9
DJIA 20,981.9 0.4 2.2 18.0
NASDAQ 6,149.7 0.5 5.4 28.2
Valuation
2017F P/E (x) P/B (x) ROE (%)
JCI 16.3 2.5 18.3
Key Rates
Last Trade Chg (bps) MoM YoY
BI 7-Day RR 4.75 0 0 -50*
3yr 6.82 0 14 -44
10yr 7.06 -8 1 -68
*since introduced in Aug 2016
FX
Last Trade Chg (%) MoM YoY
USD/IDR 13,303.00 -0.2 0.3 0.2
USD/KRW 1,123.65 -0.3 -1.3 -4.7
USD/JPY 113.79 0.4 4.5 4.4
USD/CNY 6.89 -0.1 0.3 5.8
Commodities
Last Trade Chg (%) MoM YoY
WTI 48.9 2.1 -8.9 -2.9
Gold 1,230.8 0.2 -4.2 -3.4
Coal 73.3 -1.2 -12.9 45.0
Palm Oil 2,824.0 -1.6 3.6 8.2
Rubber 161.5 0.0 -4.8 16.9
Nickel 9,235.0 -0.9 -5.3 5.9
Copper 5,613.0 1.0 -1.4 20.8
Tin 19,875.0 0.2 1.2 19.2
JCI Index VS MSCI Emerging Markets
650 800 950 1,100
3,500 4,500 5,500
05/13 05/14 05/15 05/16 05/17
JCI MSCI EM (pt)
(pt)
950 1,100 5,500
(pt) JCI MSCI EM (pt)
Mirae Asset Sekuritas Indonesia cartoon
Local flashes
IPO: Kisaran Harga Alfa Energi Rp400 – Rp500 per lembar. PT Alfa Energi Investama Tbk. akan menawarkan 300 juta lembar saham atau setara 23,01% dalam penawaran perdana saham atau initial public offering (IPO) di Bursa Efek Indonesia. Perseroan telah menunjuk PT Lautandhana Securindo selaku penjamin pelaksana emisi efek (lead underwriter). Dalam paparan publik, Direktur Utama PT Lautandhana Securindo Wientoro Prasetyo mengungkapkan dalam IPO tersebut perusahaan akan menerbitkan 300 juta lembar saham baru atau setara 23,08% dengan harga Rp400-Rp500 per lembar. (Kontan)
DSNG: Dharma Satya menambah pabrik pengolah sawit. PT Dharma Satya Nusantara Tbk (DSNG) terus meningkatkan kapasitas terpasang pabrik pengolahan kelapa sawit (PKS) miliknya. Bahkan pada Maret lalu, perusahaan ini telah memulai uji coba produksi di PKS ketujuh miliknya yang berlokasi di Muara Wahau, Kutai Timur, Provinsi Kalimantan Timur. Dengan kapasitas produksi pabrik baru sekitar 60 ton tandan buah segar (TBS) per jam, maka total kapasitas terpasang produksi PKS milik DSNG dapat mencapai 450 ton TBS per jam. (Kontan)
LTLS: Ekspansi pabrik Lautan Luas telan US$40 juta. Ekspansi pabrik yang dilakukan PT Lautan Luas Tbk. pada medio tahun lalu hampir terealisasi sepenuhnya pada awal tahun ini. Ekspansi anak usaha dari grup emiten berkode saham LTLS itu bakal mendongkrak kapasitas produksi krimer. “Dari 21.000 ton per tahun, menjadi 60.000 ton,” kata Direktur Operasional LTLS Herman Santoso, Senin (15/5/2017). Total pendanaan ekspansi mencapai US$40 juta. Menurut Herman, hampir seluruh anggaran tersebut telah dicairkan. (Bisnis Indonesia)
AGRS: Laba Bank Agris hingga Maret 2017 capai Rp3,53 miliar. PT Bank Agris Tbk (AGRS) meraih laba yang dapat didistribusikan kepada pemilik entitas induk sebesar Rp3,53 miliar hingga 31 Maret 2017 naik tipis dibandingkan laba Rp3,19 miliar di periode sama tahun sebelumnya. Laporan keuangan perseroan Senin menyebutkan, pendapatan bunga bersih naik jadi Rp41,94 miliar dari pendapatan bunga bersih Rp31,54 miliar di tahun sebelumnya. Namun laba operasional turun menjadi Rp2,90 miliar dari laba operasional tahun sebelumnya yang Rp3,21 miliar. (Iqplus)
BULL: Buana Listya raih pendapatan US$51,24 juta hingga Desember 2016. PT Buana Listya Tama Tbk (BULL) meraih pendapatan sebesar US$51,24 juta hingga periode 31 Desember 2016 naik tipis dari pendapatan US$50,63 juta di periode sama tahun sebelumnya. Laporan keuangan perseroan menyebutkan, beban langsung naik menjadi US$35,96 juta dari beban langsung US$29,47 juta tahun sebelumnya dan laba kotor turun menjadi US$15,28 juta dari laba kotor US$21,16 juta tahun sbeelumnya. Laba yang dapat didistribusikan kepada pemilik entitas induk mencapai US$485,44 ribu turun tajam dari laba US$9,98 juta di periode hingga Desember 2015. (Iqplus)
GEMS: Golden Energy akuisisi empat perusahaan batubara. PT Golden Energy Mines Tbk (GEMS) bersama perusahaan asal India, GMR Infrastructure Ltd. telah menandatangani perjanjian jual beli bersyarat atau Conditional Share Purchase Agreement (CSPA) terkait akuisisi empat perusahaan di sektor batubara. GEMS akan mengakuisisi 100% saham empat anak usaha GMR Infrastructure, yakni PT Dwikarya Sejati Utama, PT Duta Surana Internusa, PT Unsoco dan PT Barasentosa Lestari.
(Kontan)
COWL: Cowell bakal luncurkan 5 proyek baru tahun ini. PT Cowell Development Tbk.
bakal meluncurkan lima proyek baru pada tahun ini, dengan mayoritas pembangunan apartemen. Direktur Cowell Development Darwin F. Manurung menuturkan akan meluncurkan lima proyek baru di beberapa lokasi dan mayoritas yang dibangun adalah hunian apartemen. Proyek itu mencakup di Jakarta, Bogor dan sejumlah lokasi lainnya.
(Bisnis Indonesia)
Technical analysis
Tasrul +62-21-515-1140 [email protected] Jakarta Composite Index (JCI) – Tendency to rise
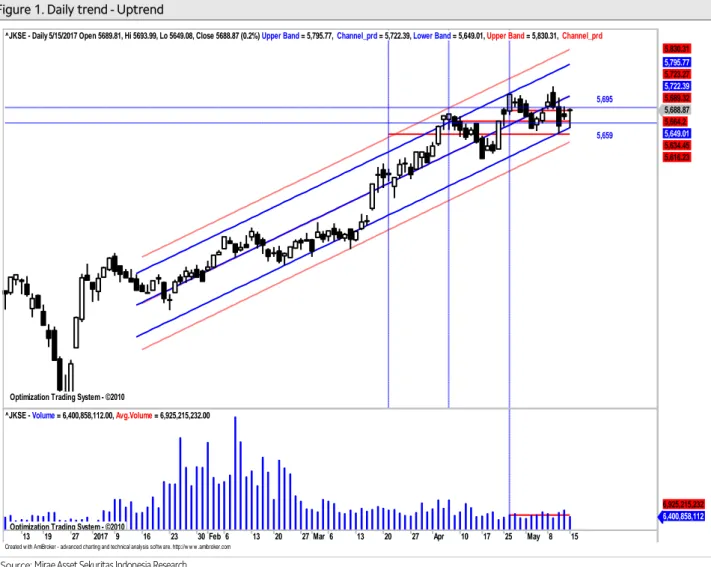
IHSG akan coba naik mendekati center line pada uptrend channel.
IHSG saat masih dalam pola uptrend jangka pendek relatif valid yang dimulai sejak selama 79 hari terakhir dengan r-squared = 0.9228 dan bergerak normal dalam rentang +/-1.77 std.deviasi dari centerline. Peluang IHSG bergerak di luar pergerakan normal sekitar 7.72% atau sekitar 6 bar chart. Volatilitas normal pergerakan IHSG saat ini sebesar +/-0.43% atau sekitar +/- 24.5 point. sebagaimana terlihat pada Figure 1.
Summary
Item Data Item Data
Close (May 15, 2017) 5,688.87(+0.2%) Normal trading range 5,677-5,722 Average index performance (%) 4.67 Target
Period 80 - Daily 5,712
r-squared 0.9228 - Weekly 5,756
Volatility (+/-, %) 0.43 - Monthly 5,807 Volatility (+/-, point) 24.5 Stop loss 5,649 Source: Mirae Asset Sekuritas Indonesia Research
Figure 1. Daily trend - Uptrend
Source: Mirae Asset Sekuritas Indonesia Research
Created w ith AmiBroker - advanced charting and technical analysis softw are. http://w w w .amibroker.com Optimization Trading System - ©2010
Optimization Trading System - ©2010 Optimization Trading System - ©2010 Optimization Trading System - ©2010 Optimization Trading System - ©2010
5,695
5,659
^JKSE - Daily 5/15/2017 Open 5689.81, Hi 5693.99, Lo 5649.08, Close 5688.87 (0.2%) Upper Band = 5,795.77, Channel_prd = 5,722.39, Lower Band = 5,649.01, Upper Band = 5,830.31, Channel_prd
5,688.87 5,664.2 5,649.01 5,634.45 5,616.23 5,689.32 5,722.39 5,723.27 5,795.77 5,830.31
13 19 27 2017 9 16 23 30 Feb 6 13 20 27 Mar 6 13 20 27 Apr 10 17 25 May 8 15
Optimization Trading System - ©2010
^JKSE - Volume = 6,400,858,112.00, Avg.Volume = 6,925,215,232.00
6,400,858,112 6,925,215,232
Aliran dana masuk mulai terlihat dan volatilitasturun indeks naik masih berlanjut
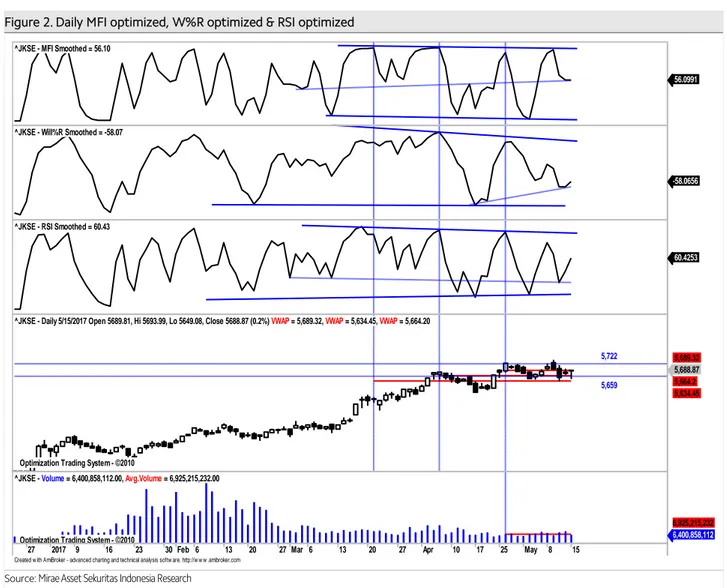
Pada Figure 2, terlihat dari hasil optimalisasi terakhir, indikator MFI optimized akan menguji support trendline, dan indikator W%R optimized dan RSI optimized cenderung naik dengan volume sekitar rata-rata . Daily resistance di 5,712 sebelum lanjut ke 5,722 dan daily support di 5,677. Stop loss level di 5,649.
Figure 2. Daily MFI optimized, W%R optimized & RSI optimized
Source: Mirae Asset Sekuritas Indonesia Research
Created w ith AmiBroker - advanced charting and technical analysis softw are. http://w w w .amibroker.com
^JKSE - MFI Smoothed = 56.10
56.0991
^JKSE - Will%R Smoothed = -58.07
-58.0656
^JKSE - RSI Smoothed = 60.43
60.4253
Optimization Trading System - ©2010 Optimization Trading System - ©2010 Optimization Trading System - ©2010
5,722
5,659
^JKSE - Daily 5/15/2017 Open 5689.81, Hi 5693.99, Lo 5649.08, Close 5688.87 (0.2%) VWAP = 5,689.32, VWAP = 5,634.45, VWAP = 5,664.20
5,688.87 5,664.2 5,634.45 5,689.32
27 2017 9 16 23 30 Feb 6 13 20 27 Mar 6 13 20 27 Apr 10 17 25 May 8 15
Optimization Trading System - ©2010
^JKSE - Volume = 6,400,858,112.00, Avg.Volume = 6,925,215,232.00
6,400,858,112 6,925,215,232
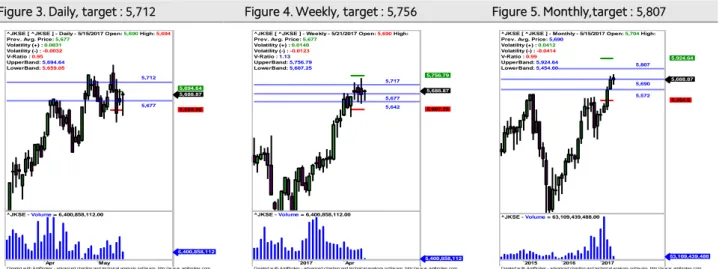
IHSG akan coba bertahan sekitar rata-rata masing-masing periode.
Untuk mampu naik lebih lanjut IHSG saat ini harus mampu bertahan diatas rata-rata masing-masing periode (positive area) sebagaimana terlihat pada Figure 3,4 dan 5.
Figure 3. Daily, target : 5,712 Figure 4. Weekly, target : 5,756 Figure 5. Monthly,target : 5,807
x
Source: Mirae Asset Sekuritas Indonesia Research Source: Mirae Asset Sekuritas Indonesia Research Source: Mirae Asset Sekuritas Indonesia Research
Created w ith AmiBroker - advanced charting and technical analysis sof tw are. http://w w w .amibroker.com 5,677
5,712
^JKSE [ ^JKSE ] - Daily - 5/15/2017 Open: 5,690 High: 5,694 Prev. Avg. Price: 5,677
Volatility (+) : 0.0031 Volatility (-) : -0.0032 V-Ratio : 0.95 UpperBand: 5,694.64 LowerBand: 5,659.05
5,688.87
5,659.05 5,694.64
Apr May
^JKSE - Volume = 6,400,858,112.00
6,400,858,112
Created w ith AmiBroker - advanced charting and technical analysis sof tw are. http://w w w .amibroker.com 5,677
5,717
5,642
^JKSE [ ^JKSE ] - Weekly - 5/21/2017 Open: 5,690 High:
Prev. Avg. Price: 5,677 Volatility (+) : 0.0140 Volatility (-) : -0.0123 V-Ratio : 1.13 UpperBand: 5,756.79 LowerBand: 5,607.25
5,688.87
5,607.25 5,756.79
2017 Apr
^JKSE - Volume = 6,400,858,112.00
6,400,858,112
Created w ith AmiBroker - advanced charting and technical analysis sof tw are. http://w w w .amibroker.com 5,690
5,572 5,807
^JKSE [ ^JKSE ] - Monthly - 5/15/2017 Open: 5,704 High:
Prev. Avg. Price: 5,690 Volatility (+) : 0.0412 Volatility (-) : -0.0414 V-Ratio : 0.99 UpperBand: 5,924.64 LowerBand: 5,454.60
5,688.87
5,454.6 5,924.64
2015 2016 2017
^JKSE - Volume = 63,109,439,488.00
63,109,439,488
Stocks on our focus list
Medco Energi Internasional (MEDC) – Trading Buy
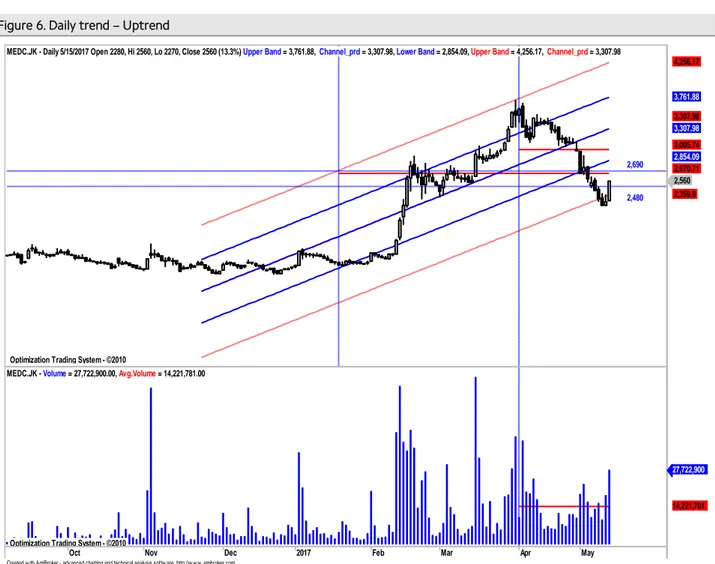
Harga akan coba naik mendekati normal lower band pada uptrend channel.
Secara umum harga saham ini masih bergerak pada uptrend channel yang masih relatif valid (r-squared = 0.751) selama 114 hari terakhir yang bergerak normal dalam rentang +/- 1.15 std.deviasi dari center line. Peluang harga keluar dari pergerakan normal sekitar 24.94 % (sekitar 28 bar chart ). Volatilitas normal pergerakkan harga saham ini sepanjang uptrend channel sebesar +/- 4.60% atau sekitar +/- 117.69 (potensi naik dan turun secara normal maksimum/minimum sebesar 120 rupiah) dari level penutupan terakhir sebagaimana terlihat pada Figure 6.
Summary
Item Data Item Data
Close (May 15, 2017) 2,560(+13.3%) Normal trading range 2,480-2,690
Relative Avg. Price performance to JCI (%) (3.71) Target
β (beta) 0.31 - Daily 2,630
Corelation 0.75 - Weekly 2,690
Period 114 - Monthly 2,870
r-squared 0.751 Stop loss 2,360
Volatility (+/-, %) 4.60
Volatility (+/-, Rp.) 117.69
Source: Mirae Asset Sekuritas Indonesia Research
Figure 6. Daily trend – Uptrend
Source: Mirae Asset Sekuritas Indonesia Research
Created w ith AmiBroker - advanced charting and technical analysis softw are. http://w w w .amibroker.com Optimization Trading System - ©2010
Optimization Trading System - ©2010 Optimization Trading System - ©2010 Optimization Trading System - ©2010
2,480 2,690 MEDC.JK - Daily 5/15/2017 Open 2280, Hi 2560, Lo 2270, Close 2560 (13.3%) Upper Band = 3,761.88, Channel_prd = 3,307.98, Lower Band = 2,854.09, Upper Band = 4,256.17, Channel_prd = 3,307.98
2,560 2,359.8 2,670.71 2,854.09 3,005.74 3,307.98 3,307.98 3,761.88 4,256.17
Oct Nov Dec 2017 Feb Mar Apr May
Optimization Trading System - ©2010
MEDC.JK - Volume = 27,722,900.00, Avg.Volume = 14,221,781.00
27,722,900
14,221,781
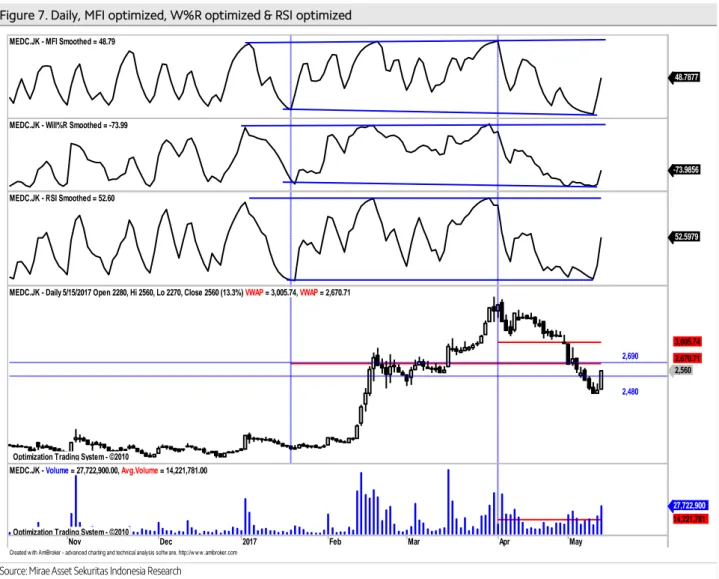
Aliran dana masuk dan volatilitas harga niak masih terlihat.
Pada Figure 7, terlihat dari hasil optimalisasi terakhir, indikator MFI Optimized,W%R Optimized dan RSI Optimized saat ini cenderung naik dengan volume tembus rata- rata. Hal ini mengindikasikan potensi kenaikkan masih terlihat. Daily resistance terdekat di 2,690 sebelum lanjut ke 3,000. Dailysupport terdekat di 2,480. Cut loss level di 2,360.
Figure 7. Daily, MFI optimized, W%R optimized & RSI optimized
Source: Mirae Asset Sekuritas Indonesia Research
Created w ith AmiBroker - advanced charting and technical analysis softw are. http://w w w .amibroker.com MEDC.JK - MFI Smoothed = 48.79
48.7877
MEDC.JK - Will%R Smoothed = -73.99
-73.9856
MEDC.JK - RSI Smoothed = 52.60
52.5979
Optimization Trading System - ©2010 Optimization Trading System - ©2010
2,480 2,690 MEDC.JK - Daily 5/15/2017 Open 2280, Hi 2560, Lo 2270, Close 2560 (13.3%) VWAP = 3,005.74, VWAP = 2,670.71
2,560 2,670.71 3,005.74
Nov Dec 2017 Feb Mar Apr May
Optimization Trading System - ©2010
MEDC.JK - Volume = 27,722,900.00, Avg.Volume = 14,221,781.00
27,722,900 14,221,781
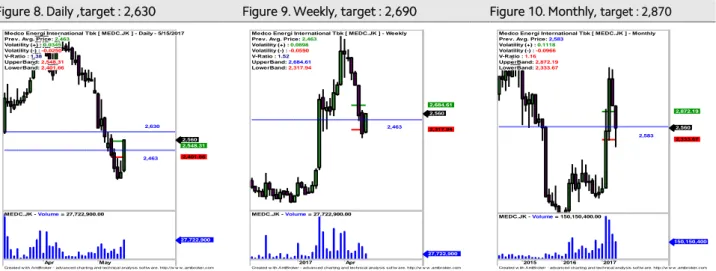
Harga akan coba naik dan bertahan diatas rata-rata pada masing-masing periode.
Untuk naik lebih lanjut harga harus mampu bertahan minimal sekitarrata-rata dengan target kenaikkan terdekat ke resistance masing-masing periode sebagaimana terlihat pada Figure 8,9 dan 10.
Figure 8. Daily ,target : 2,630 Figure 9. Weekly, target : 2,690 Figure 10. Monthly, target : 2,870
Source: Mirae Asset Sekuritas Indonesia Research Source: Mirae Asset Sekuritas Indonesia Research Source: Mirae Asset Sekuritas Indonesia Research
Created w ith AmiBroker - advanced charting and technical analysis sof tw are. http://w w w .amibroker.com 2,630
2,463 Medco Energi International Tbk [ MEDC.JK ] - Daily - 5/15/2017 Prev. Avg. Price: 2,463
Volatility (+) : 0.0345 Volatility (-) : -0.0250 V-Ratio : 1.38 UpperBand: 2,548.31 LowerBand: 2,401.66
2,560 2,548.31 2,401.66
Apr May
MEDC.JK - Volume = 27,722,900.00
27,722,900
Created w ith AmiBroker - advanced charting and technical analysis sof tw are. http://w w w .amibroker.com 2,463
Medco Energi International Tbk [ MEDC.JK ] - Weekly Prev. Avg. Price: 2,463
Volatility (+) : 0.0898 Volatility (-) : -0.0590 V-Ratio : 1.52 UpperBand: 2,684.61 LowerBand: 2,317.94
2,560
2,317.94 2,684.61
2017 Apr
MEDC.JK - Volume = 27,722,900.00
27,722,900
Created w ith AmiBroker - advanced charting and technical analysis sof tw are. http://w w w .amibroker.com 2,583
Medco Energi International Tbk [ MEDC.JK ] - Monthly Prev. Avg. Price: 2,583
Volatility (+) : 0.1118 Volatility (-) : -0.0966 V-Ratio : 1.16 UpperBand: 2,872.19 LowerBand: 2,333.67
2,560 2,333.67 2,872.19
2015 2016 2017
MEDC.JK - Volume = 150,150,400.00
150,150,400
Bank Tabungan Negara (BBTN) – Trading Buy
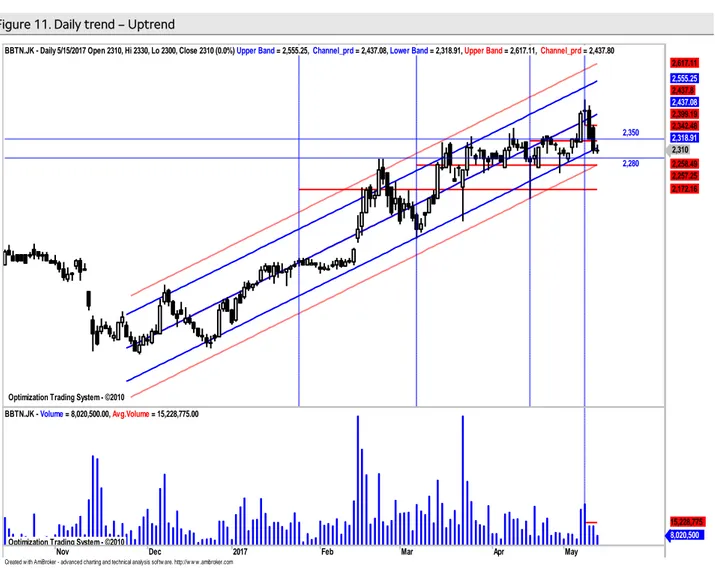
Harga akan coba naik mendekati center line pada uptrend channel .
Secara umum harga saham ini juga masih bergerak dalam pola uptrend channel yang masih relatif valid (r-squared = 0,935) selama113 hari terakhir dan bergerak normal dalam rentang +/- 1.84 std.deviasi dari center line. Peluang harga keluar dari pergerakan normal sekitar 6.52 % (sekitar 7 bar chart ). Volatilitas normal pergerakan harga saham ini sepanjang uptrend channel sebesar +/- 1.93% atau sekitar +/- 44.56 (potensi naik dan turun secara normal maksimum/minimum sebesar 40-50 rupiah) dari level penutupan terakhir sebagaimana terlihat pada Figure 11.
Summary
Item Data Item Data
Close (May 15, 2017) 2,310(0.0%) Normal trading range 2,280-2,350 Relative Avg. Price performance to JCI (%) 7.51 Target
β (beta) 0.94 - Daily 2,350
Corelation 0.90 - Weekly 2,400
Period 113 - Monthly 2,560
r-squared 0.935 Stop loss 2,170
Volatility (+/-, %) 1.93
Volatility (+/-, Rp.) 44.56
Source: Mirae Asset Sekuritas Indonesia Research
Figure 11. Daily trend – Uptrend
Source: Mirae Asset Sekuritas Indonesia Research
Created w ith AmiBroker - advanced charting and technical analysis softw are. http://w w w .amibroker.com Optimization Trading System - ©2010
Optimization Trading System - ©2010 Optimization Trading System - ©2010 Optimization Trading System - ©2010 Optimization Trading System - ©2010 Optimization Trading System - ©2010 2,370
2,350
2,280 BBTN.JK - Daily 5/15/2017 Open 2310, Hi 2330, Lo 2300, Close 2310 (0.0%) Upper Band = 2,555.25, Channel_prd = 2,437.08, Lower Band = 2,318.91, Upper Band = 2,617.11, Channel_prd = 2,437.80
2,310 2,258.49 2,257.25 2,172.16 2,318.91 2,342.48 2,399.19 2,437.08 2,437.8 2,555.25 2,617.11
Nov Dec 2017 Feb Mar Apr May
Optimization Trading System - ©2010
BBTN.JK - Volume = 8,020,500.00, Avg.Volume = 15,228,775.00
8,020,500 15,228,775
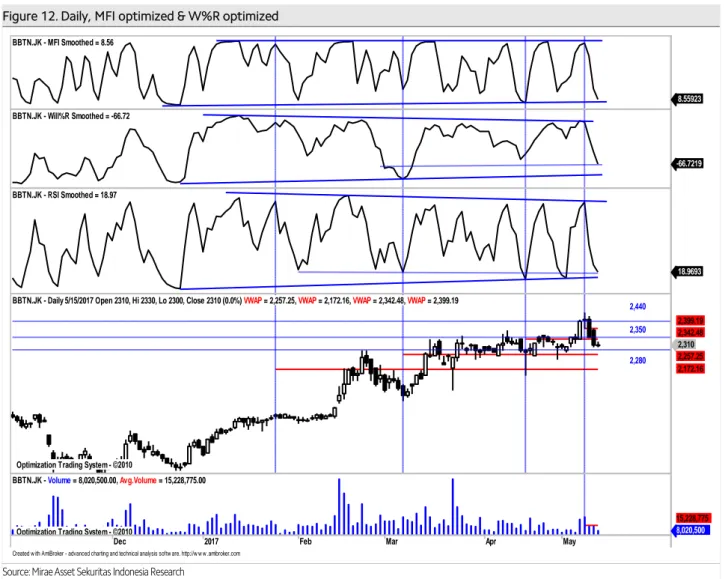
Aliran dana keluar dan volatilitas harga turun mulai tertahan.
Pada Figure 12, terlihat dari hasil optimalisasi indikator MFI optimized ,indikator W%R optimized dan RSI Optimized sudah berada sekitar support trendline dengan volume di bawah rata-rata. Hal ini mengindikasikan potensi koreksi mulai terbatas dengan kecenderungan menguat. Daily resistance di 2,350 sebelum lanjut ke 2,440. Daily support saat ini di 2,280.Cut loss level di 2,170.
Figure 12. Daily, MFI optimized & W%R optimized
Source: Mirae Asset Sekuritas Indonesia Research
Created w ith AmiBroker - advanced charting and technical analysis softw are. http://w w w .amibroker.com BBTN.JK - MFI Smoothed = 8.56
8.55923 BBTN.JK - Will%R Smoothed = -66.72
-66.7219
BBTN.JK - RSI Smoothed = 18.97
18.9693
Optimization Trading System - ©2010 Optimization Trading System - ©2010 Optimization Trading System - ©2010 Optimization Trading System - ©2010
2,350
2,280 2,440 BBTN.JK - Daily 5/15/2017 Open 2310, Hi 2330, Lo 2300, Close 2310 (0.0%) VWAP = 2,257.25, VWAP = 2,172.16, VWAP = 2,342.48, VWAP = 2,399.19
2,310 2,257.25 2,172.16 2,342.48 2,399.19
Dec 2017 Feb Mar Apr May
Optimization Trading System - ©2010
BBTN.JK - Volume = 8,020,500.00, Avg.Volume = 15,228,775.00
8,020,500 15,228,775
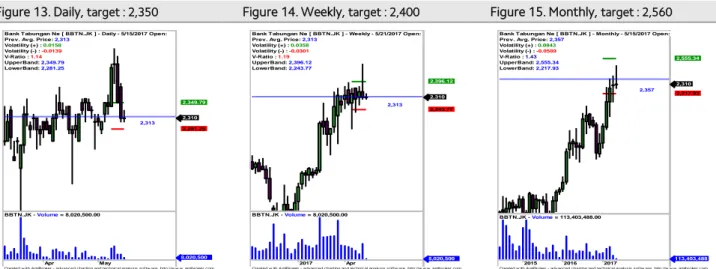
Harga saat ini akan coba naik dan bertahan diatas rata-rata pada masing-masing periode.
Untuk naik lebih lanjut harga harus mampu bertahan minimal sekitar lower band dengan target kenaikkan terdekat ke resistance masing-masing periode sebagaimana sebagaimana terlihat pada Figure 14,15 dan 16.
Figure 13. Daily, target : 2,350 Figure 14. Weekly, target : 2,400 Figure 15. Monthly, target : 2,560 x
Source: Mirae Asset Sekuritas Indonesia Research Source: Mirae Asset Sekuritas Indonesia Research Source: Mirae Asset Sekuritas Indonesia Research
Created w ith AmiBroker - advanced charting and technical analysis sof tw are. http://w w w .amibroker.com 2,313
Bank Tabungan Ne [ BBTN.JK ] - Daily - 5/15/2017 Open:
Prev. Avg. Price: 2,313 Volatility (+) : 0.0158 Volatility (-) : -0.0139 V-Ratio : 1.14 UpperBand: 2,349.79 LowerBand: 2,281.25
2,310 2,281.25 2,349.79
Apr May
BBTN.JK - Volume = 8,020,500.00
8,020,500
Created w ith AmiBroker - advanced charting and technical analysis sof tw are. http://w w w .amibroker.com 2,313
Bank Tabungan Ne [ BBTN.JK ] - Weekly - 5/21/2017 Open:
Prev. Avg. Price: 2,313 Volatility (+) : 0.0358 Volatility (-) : -0.0301 V-Ratio : 1.19 UpperBand: 2,396.12 LowerBand: 2,243.77
2,310 2,243.77 2,396.12
2017 Apr
BBTN.JK - Volume = 8,020,500.00
8,020,500
Created w ith AmiBroker - advanced charting and technical analysis sof tw are. http://w w w .amibroker.com 2,357
Bank Tabungan Ne [ BBTN.JK ] - Monthly - 5/15/2017 Open:
Prev. Avg. Price: 2,357 Volatility (+) : 0.0843 Volatility (-) : -0.0589 V-Ratio : 1.43 UpperBand: 2,555.34 LowerBand: 2,217.93
2,310 2,217.93 2,555.34
2015 2016 2017
BBTN.JK - Volume = 113,403,488.00
113,403,488
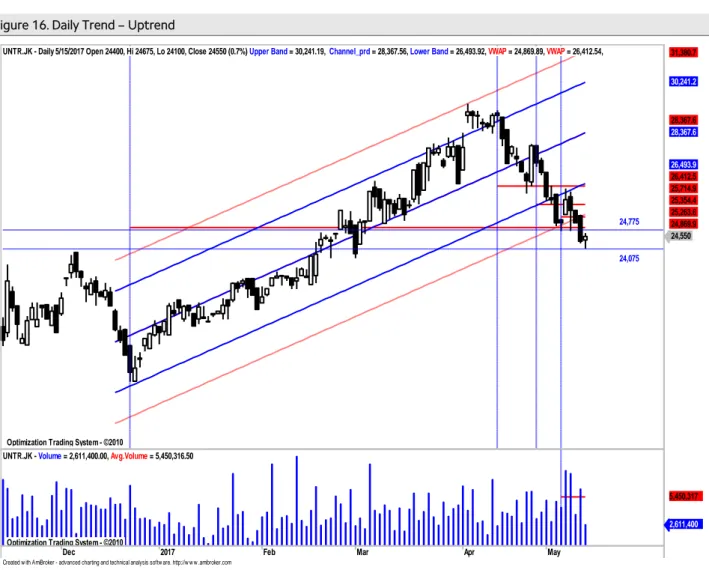
United Tractores (UNTR) – Buy on Weakness
Harga akan coba naik mendekati abnormal lower band pada uptrend channel.
Secara umum harga saham ini akan coba naik mendekati abnormal lower band pada uptrend channel yang masih relatif valid dengan r-squared = 0.756 selama 97 hari terakhir dan bergerak normal dalam rentang +/-1.16 std.deviasi dari centerline. Peluang harga keluar dari pergerakan normalnya sekitar 24.37 % (sekitar 23 bar chart ).
Volatilitas normal pergerakan harga saham ini sepanjang uptrend channel sebesar +/- 1.78% atau sekitar +/- 437.96 (potensi naik dan turun secara normal maksimum/minimum sebesar 425-450 rupiah) dari level penutupan terakhir sebagaimana terlihat pada Figure 16.
Summary
Item Data Item Data
Close (May 15, 2017) 24,550(+0.7%) Normal trading range 24,075-25,250 Relative Avg. Price performance to JCI (%) (3.38) Target
β (beta) 2.48 - Daily 24,775
Corelation 0.80 - Weekly 25,400
Period 97 - Monthly 27,075
r-squared 0.756 Stop loss 24,075
Volatility (+/-, %) 1.78
Volatility (+/-, Rp.) 437.96
Source: Mirae Asset Sekuritas Indonesia Research
Figure 16. Daily Trend – Uptrend
Source: Mirae Asset Sekuritas Indonesia Research
Created w ith AmiBroker - advanced charting and technical analysis softw are. http://w w w .amibroker.com Optimization Trading System - ©2010
Optimization Trading System - ©2010 Optimization Trading System - ©2010 Optimization Trading System - ©2010 Optimization Trading System - ©2010 Optimization Trading System - ©2010
24,775
24,075 UNTR.JK - Daily 5/15/2017 Open 24400, Hi 24675, Lo 24100, Close 24550 (0.7%) Upper Band = 30,241.19, Channel_prd = 28,367.56, Lower Band = 26,493.92, VWAP = 24,869.89, VWAP = 26,412.54,
24,550 24,869.9 25,263.6 25,354.4 25,714.9 26,412.5 26,493.9 28,367.6 28,367.6 30,241.2 31,380.7
Dec 2017 Feb Mar Apr May
Optimization Trading System - ©2010
UNTR.JK - Volume = 2,611,400.00, Avg.Volume = 5,450,316.50
2,611,400 5,450,317
Aliran dana keluar mulai tertahan dan volatilitas harga naik mulai terlihat.
Pada Figure 17, terlihat dari hasil optimalisasi, indikator MFI Optimized akan menguji support trendline, sementara itu W%R Optimized dan RSI Optimized cenderung naik namun volume masih di bawah rata-rata. Dengan demikian diperkirakan potensi koreksi mulai terbatas dengan kecenderungan menguat. Perkiraan daily resistance terdekat ke 24,775 sebelum lanjut ke 24,850. Daily support terdekat di 24,075 yang sekaligus sebagai cut loss level.
Figure 17. Daily MFI Optimized , W%R Optimized & RSI Optimized
Source: Mirae Asset Sekuritas Indonesia Research
Created w ith AmiBroker - advanced charting and technical analysis softw are. http://w w w .amibroker.com UNTR.JK - MFI Smoothed = 10.69
10.6878 UNTR.JK - Will%R Smoothed = -85.31
-85.3143 UNTR.JK - RSI Smoothed = 26.21
26.2107
Optimization Trading System - ©2010 Optimization Trading System - ©2010 Optimization Trading System - ©2010 Optimization Trading System - ©2010
24,775
24,075 UNTR.JK - Daily 5/15/2017 Open 24400, Hi 24675, Lo 24100, Close 24550 (0.7%) VWAP = 25,714.92, VWAP = 26,412.54, VWAP = 24,869.89, VWAP = 25,263.60
24,550 24,869.9 25,263.6 25,714.9 26,412.5
Nov Dec 2017 Feb Mar Apr May
Optimization Trading System - ©2010
UNTR.JK - Volume = 2,611,400.00, Avg.Volume = 5,450,316.50
2,611,400 5,450,317
Harga akan coba naik dan bertahan diatas rata-ratapada masing-masing periode.
Untuk naik lebih lanjut harga harus mampu bertahan minimal sekitarrata-rata dengan target kenaikkan terdekat ke resistance masing-masing periode sebagaimana terlihat pada Figure 18,19 dan 20.
Figure 18. Daily, target : 24,775 Figure 19. Weekly, target : 25,400 Figure 20. Monthly, target : 27,075
Source: Mirae Asset Sekuritas Indonesia Research Source: Mirae Asset Sekuritas Indonesia Research Source: Mirae Asset Sekuritas Indonesia Research
analyzed by : Tasrul, [email protected], +62-21- 5151140
Relative Avg.Price Performance to JCI (%) : Persentase kenaikan harga saham dari rata-rata sejak IHSG memulai uptrend-nya β (beta) : Indikator sensitivitas harga saham terhadap IHSG, beta diatas 1 berarti harga makin sensitif terhadap pergerakan IHSG dan sebaliknya
Correlation : Ukuran kuat hubungan (korelasi) pergerakan harga saham dibanding dengan pergerakan IHSG
Period : Periode uptrend / downtrend yang valid dari pergerakan harga saham
r-squared : Koefisien determinasi, menunjukkan persentase gerakan yang dapat dijelaskan dengan regresi linier.Nilai R2 terletak antara 0 – 1, dan kecocokan model dikatakan lebih baik kalau R2 semakin mendekati 1 (validitas uptrend atau downtrend makin valid) Volatility (+/-%) : Besaran volatilitas normal maksimal/minimal dari pergerakan harga harian selama harga saham bergerak normal pada trend channel dalam persentase.
Volatility (+/- point or Rp) : Besaran volatilitas normal maksimal/minimal dari pergerakan harga harian selama Harga saham bergerak
Buy : Beli, harga sudah menyentuh atau jatuh di bawah support dan indikator teknikal berada di oversold area.
Sell : Jual, harga sudah menyentuh atau tembus resistance normal dan indikator berada di overbought area.
BoW : Buy on Weakness, beli ketika harga sudah melemah, dimana volume tekanan jual mulai berkurang dan harga mendekatisupport, serta indikator teknikal sudah berada di oversold area.
SoS : Sell on Strength, jual ketika kenaikan harga sudah mulai terbatas dimana volume beli mulai berkurang dan harga mendekati resistance, serta indikator teknikal sudah berada di overbought area.
Trading Buy : Beli dan jual kembali secepatnya jika harga sudah mencapai level resistance terdekat, karena kenaikan harga relatif tidak stabil atau hanya sementara.
Trading Sell : Jual dan beli kembali secepatnya jika harga sudah mencapai level support terdekat karena koreksi harga relative tidak stabil atau hanya sementara.
Created w ith AmiBroker - advanced charting and technical analysis sof tw are. http://w w w .amibroker.com 28,817
24,442 United Tractors Tbk [ UNTR.JK ] - Daily - 5/15/2017 Open:
Prev. Avg. Price: 24,442 Volatility (+) : 0.0136 Volatility (-) : -0.0151 V-Ratio : 0.90 UpperBand: 24,773.15 LowerBand: 24,071.91
24,550
24,071.9 24,773.2
Apr May
UNTR.JK - Volume = 2,611,400.00
2,611,400
Created w ith AmiBroker - advanced charting and technical analysis sof tw are. http://w w w .amibroker.com 24,442
United Tractors Tbk [ UNTR.JK ] - Weekly - 5/21/2017 Open:
Prev. Avg. Price: 24,442 Volatility (+) : 0.0394 Volatility (-) : -0.0337 V-Ratio : 1.17 UpperBand: 25,405.10 LowerBand: 23,618.63
24,550 23,618.6 25,405.1
2017 Apr
UNTR.JK - Volume = 2,611,400.00
2,611,400
Created w ith AmiBroker - advanced charting and technical analysis sof tw are. http://w w w .amibroker.com 25,183
27,075
24,000 United Tractors Tbk [ UNTR.JK ] - Monthly - 5/15/2017 Prev. Avg. Price: 25,183
Volatility (+) : 0.1508 Volatility (-) : -0.0932 V-Ratio : 1.62 UpperBand: 28,980.32 LowerBand: 22,836.33
24,550
22,836.3 28,980.3
2015 2016 2017
UNTR.JK - Volume = 45,721,400.00
45,721,400
Chart 21. JCI Vs. USD/IDR Chart 22. JCI performance (absolute vs. relative)
Source: Bloomberg, Mirae Asset Sekuritas Indonesia Note: Relative to MSCI EM Index
Source: Bloomberg, Mirae Asset Sekuritas Indonesia
Chart 23. Foreigner’s net purchase (EM) Chart 24. Energy price
Note: The latest figure for India are May 12th, 2017
Source: Bloomberg, Mirae Asset Sekuritas Indonesia Source: Bloomberg, Mirae Asset Sekuritas Indonesia
Chart 25. Non-ferrous metal price Chart 26. Precious metal price
Source: Bloomberg, Mirae Asset Sekuritas Indonesia Source: Bloomberg, Mirae Asset Sekuritas Indonesia 13,100
13,300 13,500 13,700
4,800 5,000 5,200 5,400 5,600 5,800
2/13 3/13 4/10 5/8
(IDR)
(pt) JCI (L) USD/IDR (R)
0.2 0.1 1.3
20.2
-0.5
-1.9
-3.9
-6.5 -8
-4 0 4 8 12 16 20 24
1D 1W 1M 1Y
Absolute Relative (%, %p)
(%, %p) (%, %p)
0 6
-56 -15
2
142
-73
556
264
103 54
448
-200 -100 0 100 200 300 400 500 600
Korea Taiwan Indonesia Thailand Philippines India
1 Day 5 Days
(USDmn) (USDmn) (USDmn) (USDmn)
75 80 85 90 95 100 105 110 115
2/13 3/13 4/10 5/8
CPO WTI Coal
(D-3M=100)
80 85 90 95 100 105 110
2/13 3/13 4/10 5/8
(D-3M=100) Copper Nickel Tin
80 85 90 95 100 105 110
2/13 3/13 4/10 5/8
Silver Gold Platinum
(D-3M=100)
Table. Key valuation metrics
Company Name Ticker
Price Market Cap Price Performance (%) P/E(X)* P/B(X)* ROE(%)*
(IDR) (IDRbn) 1D 1W 1M 1Y FY16 FY17 FY16 FY17 FY16 FY17
Jakarta Composite Index JCI 5,689 6,201,487 0.2 0.1 1.3 19.5 16.2 14.1 2.5 2.3 18.3 20.6
FINANCIALS
Bank Central Asia BBCA 18,250 449,954 1.4 2.7 5.2 38.8 18.5 19.6 3.4 3.5 20.4 18.9
Bank Mandiri Persero BMRI 12,125 282,917 1.0 1.3 4.1 30.4 19.6 14.1 1.8 1.7 10.3 12.5
Bank Rakyat Indonesia Persero BBRI 14,300 352,769 2.0 2.7 12.6 44.8 10.9 12.5 1.9 2.2 20.2 18.3
Bank Negara Indonesia Persero BBNI 6,525 121,682 -2.2 -0.8 4.0 45.6 9.1 9.1 1.2 1.3 13.9 14.5
Bank Tabungan Negara Persero BBTN 2,310 24,463 0.0 -1.3 1.3 27.3 13.3 12.4 1.0 1.2 7.6 10.2
CONSUMER
HM Sampoerna HMSP 3,850 447,825 0.3 -1.3 -1.5 -2.7 34.8 33.0 13.0 12.5 38.6 38.5
Gudang Garam GGRM 73,600 141,613 -0.4 3.1 13.8 3.3 18.4 18.7 3.1 3.2 17.3 17.9
Indofood CBP Sukses Makmur ICBP 8,625 100,584 0.3 0.0 6.2 10.6 27.8 25.9 5.7 5.1 21.8 21.1
Indofood Sukses Makmur INDF 8,475 74,414 0.0 0.0 6.3 18.9 18.3 16.5 2.4 2.3 14.7 14.5
Kalbe Farma KLBF 1,525 71,485 -0.7 -1.6 -3.5 15.5 30.9 28.1 6.0 5.3 20.6 19.2
Unilever Indonesia UNVR 48,000 366,240 2.6 5.6 5.9 8.1 46.3 50.7 62.9 66.1 134.1 137.3
AGRICULTURAL
Astra Agro Lestari AALI 14,650 28,197 -0.3 3.5 0.5 3.5 14.8 14.5 1.9 1.6 14.1 11.2
PP London Sumatera Indonesia LSIP 1,500 10,234 0.7 8.7 7.5 -2.3 20.0 13.1 1.6 1.2 7.9 9.8
Sawit Sumbermas Sarana SSMS 1,740 16,574 0.0 3.9 1.5 5.1 22.5 22.6 3.9 4.2 18.3 18.4
INFRASTRUCTURE
XL Axiata EXCL 3,120 33,346 2.3 -0.6 3.0 -6.4 60.8 80.3 1.2 1.5 2.1 1.5
Jasa Marga JSMR 4,830 35,056 0.4 1.9 4.1 -10.8 15.6 18.2 2.3 2.3 15.7 13.1
Perusahaan Gas Negara PGAS 2,420 58,664 1.5 1.3 -4.3 4.8 15.3 10.7 1.5 1.3 9.8 12.5
Tower Bersama Infrastructure TBIG 5,650 25,602 -3.8 -1.3 -5.8 -15.0 17.4 19.8 14.3 8.0 83.6 50.1
Telekomunikasi Indonesia TLKM 4,360 439,488 -0.9 0.5 7.1 18.7 20.3 19.0 4.7 4.5 24.3 24.0
Soechi Lines SOCI 322 2,273 -0.6 -9.6 -13.9 -20.7 8.2 4.8 0.9 N/A 15.9 10.1
Garuda Indonesia GIAA 344 8,905 1.2 0.0 -9.5 -25.5 31.7 21.5 2.6 2.6 8.6 13.2
BASIC-INDUSTRIES
Semen Indonesia SMGR 8,900 52,791 0.6 1.1 0.3 -1.1 12.0 14.2 1.9 1.7 16.3 12.4
Charoen Pokphand Indonesia CPIN 3,050 50,014 1.7 -0.7 -5.3 -3.2 22.6 16.3 3.6 3.0 16.5 19.7
Indocement Tunggal Prakarsa INTP 17,800 65,526 4.7 8.5 7.9 7.4 14.6 19.3 2.2 2.3 15.5 12.2
Japfa Comfeed Indonesia JPFA 1,075 12,266 -2.3 -15.7 -31.1 15.6 7.7 6.8 1.9 1.2 28.6 19.5
MINING
Indo Tambangraya Megah ITMG 15,150 17,118 -5.0 -17.7 -23.5 80.9 10.4 6.3 1.5 1.3 15.0 20.1
Adaro Energy ADRO 1,485 47,499 0.3 -4.8 -20.2 121.6 12.0 8.6 1.3 1.0 11.1 11.7
Aneka Tambang ANTM 610 14,659 -1.6 -3.2 -17.0 -13.5 298.3 53.2 1.2 0.8 0.4 2.6
Vale Indonesia INCO 1,885 18,730 0.0 -4.8 -15.5 17.4 N/A 35.4 1.1 0.7 0.1 2.2
Tambang Batubara Bukit Asam PTBA 10,875 25,057 -0.9 -5.4 -13.0 71.9 13.1 8.2 2.5 1.9 20.5 24.8
TRADE
United Tractors UNTR 24,550 91,575 0.7 -2.0 -12.8 87.4 15.8 13.9 1.9 2.0 12.7 15.3
AKR Corporindo AKRA 6,300 25,201 -0.8 -2.3 -3.8 2.9 23.5 20.5 3.5 3.3 15.7 16.0
Global Mediacom BMTR 640 9,087 -6.6 0.0 19.6 -43.1 41.8 N/A 0.9 N/A 2.0 N/A
Matahari Department Store LPPF 15,025 43,842 1.5 -4.8 11.7 -21.0 21.9 19.7 23.8 14.6 136.4 86.2
Media Nusantara Citra MNCN 1,925 27,481 -2.3 -2.8 6.1 -16.3 17.7 15.4 2.7 2.5 15.4 16.8
Matahari Putra Prima MPPA 825 4,437 0.0 -4.6 -17.5 -38.9 211.4 27.0 3.3 1.8 1.6 4.7
Surya Citra Media SCMA 2,860 41,818 0.7 0.0 4.0 -14.9 27.2 23.2 11.9 10.2 45.7 46.6
Siloam International Hospital SILO 11,850 15,412 -1.3 -13.5 -12.7 34.5 150.3 107.7 4.5 4.8 3.5 4.6 PROPERTY
Bumi Serpong Damai BSDE 1,800 34,644 -0.6 -0.8 2.0 4.7 18.8 14.6 1.6 1.5 9.1 10.5
Adhi Karya ADHI 2,180 7,763 0.0 -3.1 -6.4 -10.3 23.6 13.2 1.4 1.3 5.9 9.8
Alam Sutera Realty ASRI 330 6,484 0.0 -2.9 -6.8 -9.8 13.6 7.5 1.0 0.8 7.5 12.1
Ciputra Development CTRA 1,170 21,716 -0.4 -2.5 -6.0 -6.6 19.9 16.9 2.2 1.6 9.8 11.3
Lippo Karawaci LPKR 765 17,654 0.0 -7.3 1.3 -18.2 18.6 16.1 0.9 0.9 5.0 5.9
Pembangunan Perumahan PTPP 2,710 16,802 0.0 -9.1 -21.9 -20.8 23.1 11.9 2.4 1.6 14.4 14.3
Pakuwon Jati PWON 625 30,100 1.6 -8.8 6.8 25.0 16.3 14.7 3.1 2.8 21.0 19.9
Summarecon Agung SMRA 1,340 19,332 -0.4 -2.9 -0.4 -5.0 61.3 43.6 3.1 2.8 5.1 6.8
Wijaya Karya WIKA 2,230 20,003 1.8 -2.6 -6.3 -0.9 14.4 15.8 1.8 1.5 12.9 10.3
Waskita Karya WSKT 2,260 30,677 1.3 -3.0 -4.6 -11.4 17.3 12.7 3.1 1.9 16.6 16.7
MISCELLANEOUS
Astra International ASII 8,700 352,207 0.3 0.0 2.4 37.5 22.1 17.8 3.0 2.8 14.2 16.5
Source: Bloomberg, Mirae Asset Sekuritas Indonesia
*Note: Valuation metrics based on Bloomberg consensus estimates
Sector performance Top 10 market cap performance
Name Index Chg (%) Ticker Price Market Cap (IDRbn) Chg (%)
Agricultural 1,812.6 0.0 MEDC IJ 2560 8,531 13.27
Mining 1,348.5 -0.2 JSPT IJ 3300 7,652 10.00
Basic-Industry 605.9 0.3 INAF IJ 3120 9,670 9.47
Miscellaneous Industry 1,468.4 0.2 DOID IJ 875 7,434 4.79
Consumer Goods 2,508.8 0.6 INTP IJ 17800 65,526 4.7
Property & Construction 488.8 0.3 DSNG IJ 490 5,194 4.26
Infrastructure 1,134.5 -0.5 KAEF IJ 2520 13,996 4.13
Finance 917.8 0.6 HRUM IJ 2070 5,596 3.50
Trade 906.8 -0.4 UNVR IJ 48000 366,240 2.6
Composite 5,688.9 0.2 INPP IJ 630 7,045 2.44
Source: Bloomberg
Top 5 leading movers Top 5 lagging movers
Name Chg (%) Close Name Chg (%) Close
UNVR IJ 2.6 48,000 TLKM IJ -0.9 4,360
BBRI IJ 2.0 14,300 BBNI IJ -2.3 6,525
BBCA IJ 1.4 18,250 MYOR IJ -3.2 2,150
INTP IJ 4.7 17,800 SMBR IJ -3.6 3,260
BMRI IJ 1.0 12,125 INKP IJ -8.1 2,390
Source: Bloomberg
Economic Calendar
Time Currency Detail Forecast Previous
2:00am GBP Prime Minister May Speaks
3:00am USD TIC Long-Term Purchases 68.3B 53.4B
8:30am AUD Monetary Policy Meeting Minutes
8:30am AUD New Motor Vehicle Sales m/m 1.9%
16th-18th CNY Foreign Direct Investment ytd/y 1.0%
11:30am JPY Tertiary Industry Activity m/m 0.1% 0.2%
1:45pm EUR French Final CPI m/m 0.1% 0.1%
3:00pm EUR Italian Prelim GDP q/q 0.2% 0.2%
3:30pm GBP CPI y/y 2.6% 2.3%
3:30pm GBP PPI Input m/m 0.1% 0.4%
3:30pm GBP RPI y/y 3.4% 3.1%
3:30pm GBP Core CPI y/y 2.2% 1.8%
3:30pm GBP HPI y/y 5.4% 5.8%
3:30pm GBP PPI Output m/m 0.2% 0.4%
4:00pm EUR Flash GDP q/q 0.5% 0.5%
4:00pm EUR German ZEW Economic Sentiment 22.3 19.5
4:00pm EUR Trade Balance 18.8B 19.2B
4:00pm EUR ZEW Economic Sentiment 29.1 26.3
7:30pm USD Building Permits 1.27M 1.27M
7:30pm USD Housing Starts 1.26M 1.22M
8:15pm USD Capacity Utilization Rate 76.3% 76.1%
8:15pm USD Industrial Production m/m 0.4% 0.5%
8:30pm GBP CB Leading Index m/m 0.1%
9:00pm USD Mortgage Delinquencies 4.80%
Tentative NZD GDT Price Index 3.6%
Note: Time is based on Indonesian local time Source: Forex Factory
Disclaimers
This report is prepared strictly for private circulation only to clients of PT Mirae Asset Sekuritas Indonesia (MASI). It is purposed only to person having professional experience in matters relating to investments. The information contained in this report has been taken from sources which we deem reliable. No warranty (express or implied) is made to the accuracy or completeness of the information. All opinions and estimates included in this report constitute our judgments as of this date, without regards to its fairness, and are subject to change without notice. However, none of MASI and/or its affiliated companies and/or their respective employees and/or agents makes any representation or warranty (express or implied) or accepts any responsibility or liability as to, or in relation to, the accuracy or completeness of the information and opinions contained in this report or as to any information contained in this report or any other such information or opinions remaining unchanged after the issue thereof. We expressly disclaim any responsibility or liability (express or implied) of MASI, its affiliated companies and their respective employees and agents whatsoever and howsoever arising (including, without limitation for any claims, proceedings, action, suits, losses, expenses, damages or costs) which may be brought against or suffered by any person as a results of acting in reliance upon the whole or any part of the contents of this report and neither MASI, its affiliated companies or their respective employees or agents accepts liability for any errors, omissions or misstatements, negligent or otherwise, in the report and any liability in respect of the report or any inaccuracy therein or omission there from which might otherwise arise is hereby expresses disclaimed.
This document is not an offer to sell or a solicitation to buy any securities. This firms and its affiliates and their officers and employees may have a position, make markets, act as principal or engage in transaction in securities or related investments of any company mentioned herein, may perform services for or solicit business from any company mentioned herein, and may have acted upon or used any of the recommendations herein before they have been provided to you. © PT Mirae Asset Sekuritas Indonesia 2016.