Taye Shim +62-21-515-3281 [email protected] To subscribe to our Daily Focus, please contact us at [email protected]
Mirae Asset Sekuritas Indonesia
12MF Rolling forward P/B trend of BMRI
Source: Company data, Mirae Asset Sekuritas Research Indonesia
April 26, 2017
BMRI 1Q17 Review: Balanced risk/reward Early signs of stability
Bank Mandiri (BMRI) membukukan laba bersih 1Q17 sebesar IDR4.079,0 miliar (naik 127,4% QoQ; naik 6,9% YoY), mewakili 20,1% dari proyeksi laba bersih kami untuk tahun ini sebesar IDR20,3tr.
Key operational discussions
Quid pro quo: BMRI tampaknya telah mengalihkan fokusnya kepada peminjam berkualitas (atau peminjam berisiko rendah). Kami menduga bahwa ini adalah langkah strategis manajemen untuk mengorbankan marginnya untuk stabilitas.
Manajemen nampaknya merasa nyaman dengan market liquidity. Bank mengalami penurunan 10bps QoQ dalam cost of funds - yang kami anggap untuk menyeimbangkan kembali campuran pendanaannya (tabungan meningkat 15,6%, demand deposit 12,9%, time deposit naik 6,8% YoY). Where is BMRI on the credit cycle? Meskipun tidak ada peningkatan yang berarti terhadap rasio NPL dan rasio precautionary loan, kami mencatat bahwa ada provisioning write-backs yang cukup besar (IDR467,9 miliar; naik 532,9% YoY) di 1Q17. Diskusi lebih lanjut dengan bank tersebut mengungkapkan bahwa 80% provisioning write-backs berasal dari segmen mikro dan UKM (yang lebih sensitif terhadap situasi makro). Ini berarti perbaikan kondisi makro dapat menyebabkan bank menikmati pemulihan pendapatan.
Balanced risk/reward: Maintain hold
Kami melihat pemulihan PPOP dari BMRI sebagai hal yang menggembirakan.
Selanjutnya, dengan perbaikan makro, kita melihat resiko yang lebih rendah terhadap biaya kreditnya. Namun, kita melihat adanya tantangan terhadap pertumbuhan, mengingat pergeseran strukturalnya kepada peminjam berkualitas dan pandangan optimis manajemen terhadap likuiditas pasar. Kami melihat risk/reward bank cukup seimbang dan reiterate rekomendasi Hold kami untuk BMRI.
TP baru kami menerapkan target P/B 1.5x terhadap perkiraan 12M rolling forward BPS.
Market Index
Last Trade Chg (%) MoM YoY
JCI 5,680.8 0.3 1.7 17.7
MSCI Indonesia 26.5 0.0 2.3 12.5
MSCI EM 982.7 1.2 0.2 15.3
HANG SENG 24,455.9 1.3 -0.9 12.8
KOSPI 2,196.9 0.4 1.3 8.8
FTSE 7,275.6 0.2 -1.0 15.6
DJIA 20,996.1 1.1 0.8 15.4
NASDAQ 6,025.5 0.7 2.7 22.4
Valuation
2017F P/E (x) P/B (x) ROE (%)
JCI 16.2 2.5 18.0
Key Rates
Last Trade Chg (bps) MoM YoY
BI 7-Day RR 4.75 0 0 -50*
3yr 6.65 1 -14 -65
10yr 7.07 -3 -5 -56
*since introduced in Aug 2016
FX
Last Trade Chg (%) MoM YoY
USD/IDR 13,284.00 -0.2 0.0 0.8
USD/KRW 1,125.43 -0.4 1.1 -2.2
USD/JPY 111.09 1.2 0.4 -0.2
USD/CNY 6.88 0.0 0.2 6.0
Commodities
Last Trade Chg (%) MoM YoY
WTI 49.6 0.7 2.2 3.8
Gold 1,264.1 -1.0 0.7 1.7
Coal 83.9 -0.6 3.6 64.4
Palm Oil 2,634.0 -2.1 -10.7 -1.9
Rubber 168.2 0.0 -6.9 19.2
Nickel 9,260.0 -0.9 -6.2 1.4
Copper 5,706.0 0.9 -1.7 15.0
Tin 19,495.0 -0.7 -1.1 12.6
JCI Index VS MSCI Emerging Markets
650 800 950 1,100
3,500 4,500 5,500
04/13 04/14 04/15 04/16 04/17
JCI MSCI EM (pt)
(pt)
800 950 1,100
4,500 5,500
(pt) JCI MSCI EM (pt)
Local flashes
BMRI: Laba Bank Mandiri naik 6,9% di kuartal I 2017. PT Bank Mandiri Tbk membukukan laba bersih pada kinerja kuartal I-2017, meski kinerja laba sempat turun tahun lalu akibat kenaikan kredit bermasalah. Bank pelat merah ini mencatat kenaikan laba bersih 6,9% menjadi Rp 4,1 triliun per kuartal I-2017 dibandingkan periode yang sama tahun lalu sejumlah Rp 3,8 triliun. Kartika Wirjoatmodjo, Direktur Utama Bank Mandiri mengatakan, peningkatan laba bersih ditopang pertumbuhan pendapatan bunga bersih dan premi bersih sebesar 3,0% menjadi Rp 13,4 triliun, dan kenaikan pendapatan komisi atau fee based income sebesar 25,0% menjadi Rp 5,3 triliun.
Sementara, kenaikan biaya operasional hanya 3,8% menjadi Rp 7,9 triliun. (Kontan)
PTBA: Bukit Asam targetkan penjualan 27,29 juta ton batubara di 2017. PT Tambang Bukit Asam Tbk (PTBA) menargetkan penjualan tahun 2017 sebesar 27,29 juta ton atau 31 persen lebih tinggi dibandingkan realisasi tahun 2016 yang 20,75 juta ton. Menurut keterangan Adib Ubaidillah, Sekretaris Perusahaan perseroan Selasa disebutkan, dari jumlah tersebut komposisinya 15,93 juta ton untuk memenuhi permintaan domestik atau 58 persen total penjualan dan 11,36 juta ton atau 42 persen untuk ekspor. (Iqplus)
KLBF: Kalbe Farma berniat membagi dividen maksimal 50% dari laba bersih. PT Kalbe Farma Tbk (KLBF) memastikan menjaga komitmennya untuk selalu memberikan nilai tambah bagi para pemegang saham mereka. Emiten farmasi ini berupaya membagikan dividen dengan payout ratio yang lebih besar. Sekretaris Perusahaan KLBF Vidjongtius menjelaskan, kebijakan dividend payout ratio berada pada rentang 40% hingga 50%
dari laba bersih 2016. KLBF juga terbilang konsisten membagikan dividen dengan rentang payout ratio sebesar itu. (Kontan)
ANTM: Antam bangun pabrik feronikel di Halmahera Timur. PT Aneka Tambang Tbk (ANTM) memulai proses pembangunan pabrik feronikel Halmahera Timur, Maluku Utara dengan melaksanakan pemasangan tiang pancang perdana (first piling) pada 25 April 2017. First piling ini merefleksikan dukungan program hilirisasi pemerintah dalam rangka peningkatan nilai tambah produk mineral Indonesia. Direktur Utama ANTM, Tedy Badrujaman mengatakan Proyek Pembangunan Pabrik Feronikel Haltim (P3FH) merupakan wujud implementasi rencana strategis ANTM dalam hilirisasi. (Kontan)
IIKP: Inti Agri akan stock split rasio 1:10. Perusahaan perikanan, PT Inti Agri Resources Tbk berencana memecah jumlah saham (stock split). Manajemen sudah mendapatkan restu melalui Rapat Umum Pemegang Saham Luar Biasa (RUPSLB) yang digelar di Jakarta, Selasa (25/4). Emiten dengan kode IIKP tersebut, sepakat mematok besaran rasio stock splitsebesar 1:10. Artinya, harga saham IIKP akan menjadi 10 kali lebih kecil, namun memiliki jumlah yang semakin banyak. "Supaya likuid, dan dengan harapan investor yang kecil akan masuk. Sehingga pemegang saham makin banyak," terang Akbar, Sekretaris Perusahaan PT Inti Agri Resources Tbk. (Kontan)
SMMA: Sinar Mas Multiartha siapkan Rp 5,2 triliun untuk buyback saham. PT Sinar Mas Multiartha Tbk (SMMA) berencana membeli kembali (buyback) sahamnya yang telah tercatat di Bursa Efek Indonesia (BEI). Jumlah saham yang akan dibeli kembali maksimal sebanyak 10% dari modal ditempatkan dan disetor penuh atau 636,76 juta saham. Untuk aksi korporasi itu, SMMA menyiapkan dana hingga Rp 5,2 triliun yang akan diambil dari akun saldo laba ditahan alias retained earnings. Perseroan akan menyimpan saham hasil pembelian kembali itu sebagai saham treasuri untuk jangka waktu maksimal tiga tahun. (Kontan)
Technical analysis
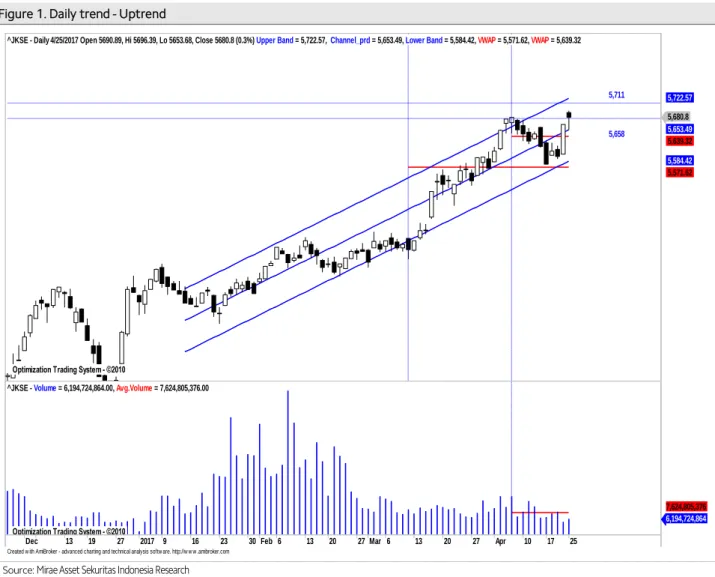
Tasrul +62-21-515-1140 [email protected] Jakarta Composite Index (JCI) – Tendency to rise
IHSG akan coba naik menguji normal upper band pada uptrend channel.
IHSG saat masih dalam pola uptrend jangka pendek relatif valid yang dimulai sejak selama 68 hari terakhir dengan r-squared = 0.8961 dan bergerak normal dalam rentang +/-1.63 std.deviasi dari centerline. Peluang IHSG bergerak di luar pergerakan normal sekitar 10.39% atau sekitar 7 bar chart. Volatilitas normal pergerakan IHSG saat ini sebesar +/-0.42% atau sekitar +/- 23.6 point. sebagaimana terlihat pada Figure 1.
Summary
Item Data Item Data
Close (April 25, 2017)
5,680.8 (+0.3)%
Normal trading range
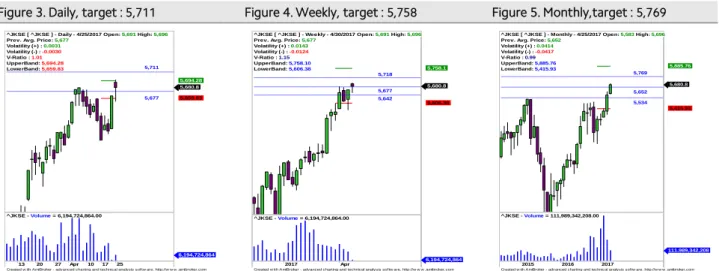
5,658-5,711 Average index performance (%) 5.01 Target
Period 68 - Daily 5,711
r-squared 0.8961 - Weekly 5,758
Volatility (+/-, %) 0.42 - Monthly 5,769 Volatility (+/-, point) 23.6 Stop loss 5,639 Source: Mirae Asset Sekuritas Indonesia Research
Figure 1. Daily trend - Uptrend
Source: Mirae Asset Sekuritas Indonesia Research
Created w ith AmiBroker - advanced charting and technical analysis softw are. http://w w w .amibroker.com Optimization Trading System - ©2010
Optimization Trading System - ©2010 Optimization Trading System - ©2010
5,658 5,711
^JKSE - Daily 4/25/2017 Open 5690.89, Hi 5696.39, Lo 5653.68, Close 5680.8 (0.3%) Upper Band = 5,722.57, Channel_prd = 5,653.49, Lower Band = 5,584.42, VWAP = 5,571.62, VWAP = 5,639.32
5,680.8 5,653.49 5,639.32
5,584.42 5,571.62 5,722.57
Dec 13 19 27 2017 9 16 23 30 Feb 6 13 20 27 Mar 6 13 20 27 Apr 10 17 25
Optimization Trading System - ©2010
^JKSE - Volume = 6,194,724,864.00, Avg.Volume = 7,624,805,376.00
6,194,724,864 7,624,805,376
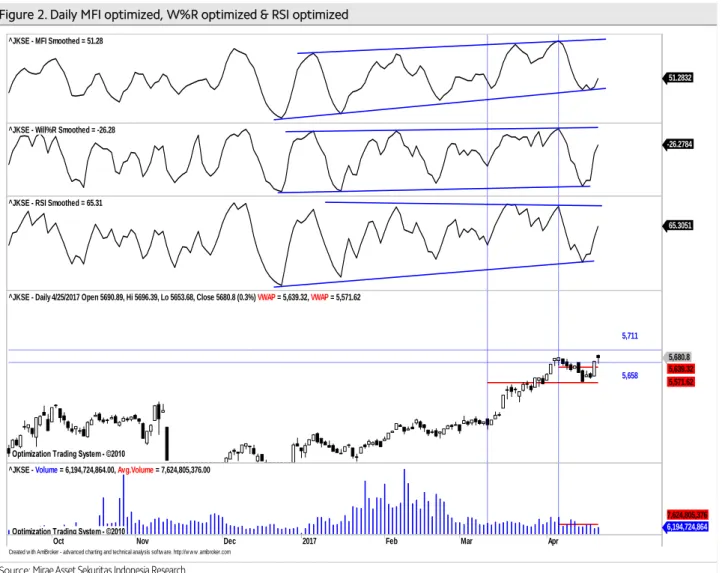
Aliran dana masuk dan volatilitasindeks naik masih terlihat.
Pada Figure 2, terlihat dari hasil optimalisasi terakhir, koreksi indikator MFI optimized, indikator W%R optimized dan RSI optimized cenderung naik namun volume masih di bawah rata-rata dengan demikian potensi kenaikkan masih terlihat meskipun masih terbatas . Daily resistance di 5,711 dan daily support di 5,658. Stop loss level di 5,639.
Figure 2. Daily MFI optimized, W%R optimized & RSI optimized
Source: Mirae Asset Sekuritas Indonesia Research
Created w ith AmiBroker - advanced charting and technical analysis softw are. http://w w w .amibroker.com
^JKSE - MFI Smoothed = 51.28
51.2832
^JKSE - Will%R Smoothed = -26.28
-26.2784
^JKSE - RSI Smoothed = 65.31
65.3051
Optimization Trading System - ©2010 Optimization Trading System - ©2010
5,658 5,711
^JKSE - Daily 4/25/2017 Open 5690.89, Hi 5696.39, Lo 5653.68, Close 5680.8 (0.3%) VWAP = 5,639.32, VWAP = 5,571.62
5,680.8 5,639.32 5,571.62
Oct Nov Dec 2017 Feb Mar Apr
Optimization Trading System - ©2010
^JKSE - Volume = 6,194,724,864.00, Avg.Volume = 7,624,805,376.00
6,194,724,864 7,624,805,376
IHSG akan coba bertahan sekitar rata-rata masing-masing periode.
Untuk mampu naik lebih lanjut IHSG saat ini harus mampu bertahan diatas rata-rata masing-masing periode (positive area) sebagaimana terlihat pada Figure 3,4 dan 5.
Figure 3. Daily, target : 5,711 Figure 4. Weekly, target : 5,758 Figure 5. Monthly,target : 5,769
x
Source: Mirae Asset Sekuritas Indonesia Research Source: Mirae Asset Sekuritas Indonesia Research Source: Mirae Asset Sekuritas Indonesia Research
Created w ith AmiBroker - advanced charting and technical analysis sof tw are. http://w w w .amibroker.com 5,677 5,711
^JKSE [ ^JKSE ] - Daily - 4/25/2017 Open: 5,691 High: 5,696 Prev. Avg. Price: 5,677
Volatility (+) : 0.0031 Volatility (-) : -0.0030 V-Ratio : 1.01 UpperBand: 5,694.28 LowerBand: 5,659.83
5,680.8 5,659.83 5,694.28
13 20 27 Apr 10 17 25
^JKSE - Volume = 6,194,724,864.00
6,194,724,864
Created w ith AmiBroker - advanced charting and technical analysis sof tw are. http://w w w .amibroker.com 5,677
5,642 5,718
^JKSE [ ^JKSE ] - Weekly - 4/30/2017 Open: 5,691 High: 5,696 Prev. Avg. Price: 5,677
Volatility (+) : 0.0143 Volatility (-) : -0.0124 V-Ratio : 1.15 UpperBand: 5,758.10 LowerBand: 5,606.38
5,680.8
5,606.38 5,758.1
2017 Apr
^JKSE - Volume = 6,194,724,864.00
6,194,724,864
Created w ith AmiBroker - advanced charting and technical analysis sof tw are. http://w w w .amibroker.com 5,652 5,769
5,534
^JKSE [ ^JKSE ] - Monthly - 4/25/2017 Open: 5,583 High: 5,696 Prev. Avg. Price: 5,652
Volatility (+) : 0.0414 Volatility (-) : -0.0417 V-Ratio : 0.99 UpperBand: 5,885.76 LowerBand: 5,415.93
5,680.8
5,415.93 5,885.76
2015 2016 2017
^JKSE - Volume = 111,989,342,208.00
111,989,342,208
Stocks on our focus list
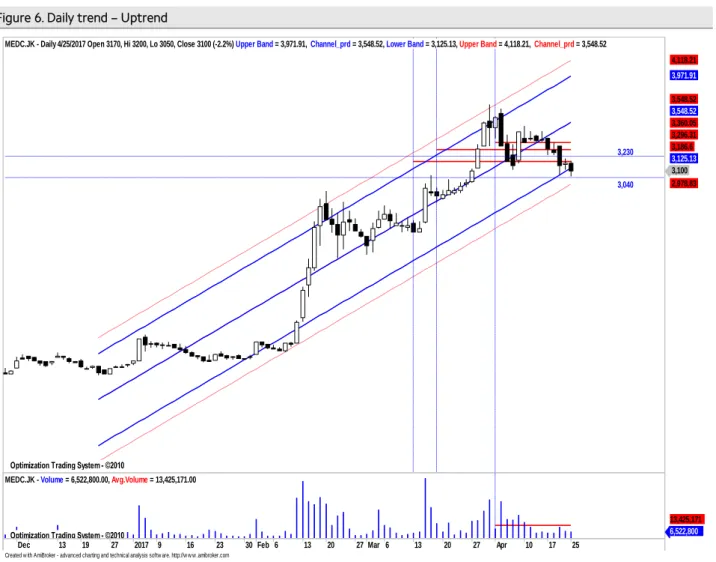
Medco Energi Internasional (MEDC) – Buy on Weakness Harga akan coba naik diatas normal lower band pada uptrend channel.
Secara umum harga saham ini masih bergerak pada uptrend channel yang masih relatif valid (r-squared = 0.891 selama 82 hari terakhir yang bergerak normal dalam rentang +/- 1.6 std.deviasi dari center line. Peluang harga keluar dari pergerakan normal sekitar 10.94% (sekitar 9 bar chart ). Volatilitas normal pergerakkan harga saham ini sepanjang uptrend channel sebesar +/- 3.61 % atau sekitar +/- 111.77 (potensi naik dan turun secara normal maksimum/minimum sebesar 110 rupiah) dari level penutupan terakhir sebagaimana terlihat pada Figure 6.
Summary
Item Data Item Data
Close (April 25, 2017) 3,100(-2.2%) Normal trading range 3,040-3,300
Relative Avg. Price performance to JCI (%) 16.44 Target
β (beta) (0.19) - Daily 3,230
Corelation 0.87 - Weekly 3,390
Period 82 - Monthly 3,650
r-squared 0.891 Stop loss 2,980
Volatility (+/-, %) 3.61
Volatility (+/-, Rp.) 111.77
Source: Mirae Asset Sekuritas Indonesia Research
Figure 6. Daily trend – Uptrend
Source: Mirae Asset Sekuritas Indonesia Research
Created w ith AmiBroker - advanced charting and technical analysis softw are. http://w w w .amibroker.com Optimization Trading System - ©2010
Optimization Trading System - ©2010 Optimization Trading System - ©2010 Optimization Trading System - ©2010 Optimization Trading System - ©2010
3,230
3,040 MEDC.JK - Daily 4/25/2017 Open 3170, Hi 3200, Lo 3050, Close 3100 (-2.2%) Upper Band = 3,971.91, Channel_prd = 3,548.52, Lower Band = 3,125.13, Upper Band = 4,118.21, Channel_prd = 3,548.52
3,100 2,978.83 3,125.13 3,186.6 3,296.31 3,360.05 3,548.52 3,548.52 3,971.91 4,118.21
Dec 13 19 27 2017 9 16 23 30 Feb 6 13 20 27 Mar 6 13 20 27 Apr 10 17 25
Optimization Trading System - ©2010
MEDC.JK - Volume = 6,522,800.00, Avg.Volume = 13,425,171.00
6,522,800 13,425,171
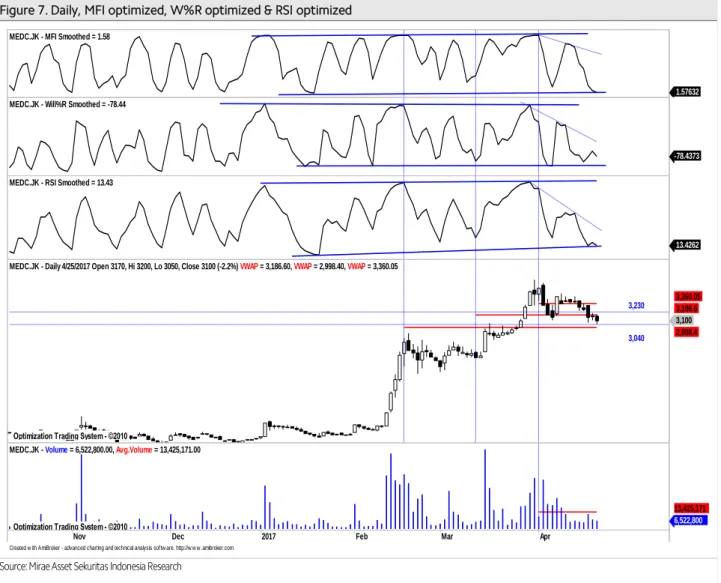
Aliran dana keluar masih terlihat dan volatilitas harga turun mulai terbatas.
Pada Figure 7, terlihat dari hasil optimalisasi terakhir, indikator MFI Optimized , indikator W%R Optimized dan RSI Optimized akan menguji support trendline dengan volume di bawah rata-rata. Hal ini mengindikasikan koreksi mulai terbatas.
Dailyresistance terdekat di 3,230 sebelum lanjut ke 3,300 dan 3,360. Dailysupport terdekat di 3,040. Stop loss level di 3,300.
Figure 7. Daily, MFI optimized, W%R optimized & RSI optimized
Source: Mirae Asset Sekuritas Indonesia Research
Created w ith AmiBroker - advanced charting and technical analysis softw are. http://w w w .amibroker.com MEDC.JK - MFI Smoothed = 1.58
1.57632 MEDC.JK - Will%R Smoothed = -78.44
-78.4373
MEDC.JK - RSI Smoothed = 13.43
13.4262
Optimization Trading System - ©2010 Optimization Trading System - ©2010 Optimization Trading System - ©2010
3,230
3,040 MEDC.JK - Daily 4/25/2017 Open 3170, Hi 3200, Lo 3050, Close 3100 (-2.2%) VWAP = 3,186.60, VWAP = 2,998.40, VWAP = 3,360.05
3,100 2,998.4 3,186.6 3,360.05
Nov Dec 2017 Feb Mar Apr
Optimization Trading System - ©2010
MEDC.JK - Volume = 6,522,800.00, Avg.Volume = 13,425,171.00
6,522,800 13,425,171
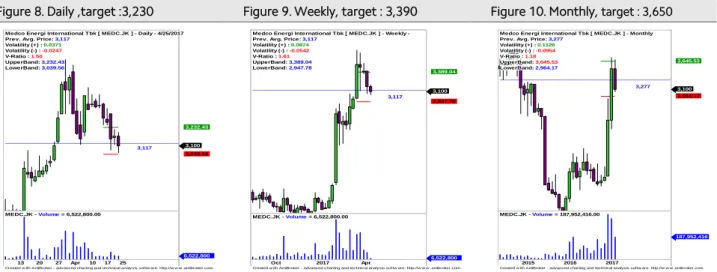
Harga akan coba naik dan bertahan diatas rata-rata pada masing-masing periode.
Untuk naik lebih lanjut harga harus mampu bertahan minimal sekitarrata-rata dengan target kenaikkan terdekat ke resistance masing-masing periode sebagaimana terlihat pada Figure 8,9 dan 10.
Figure 8. Daily ,target :3,230 Figure 9. Weekly, target : 3,390 Figure 10. Monthly, target : 3,650
Source: Mirae Asset Sekuritas Indonesia Research Source: Mirae Asset Sekuritas Indonesia Research Source: Mirae Asset Sekuritas Indonesia Research
Created w ith AmiBroker - advanced charting and technical analysis sof tw are. http://w w w .amibroker.com 3,117
Medco Energi International Tbk [ MEDC.JK ] - Daily - 4/25/2017 Prev. Avg. Price: 3,117
Volatility (+) : 0.0371 Volatility (-) : -0.0247 V-Ratio : 1.50 UpperBand: 3,232.43 LowerBand: 3,039.56
3,100 3,039.56 3,232.43
13 20 27 Apr 10 17 25
MEDC.JK - Volume = 6,522,800.00
6,522,800
Created w ith AmiBroker - advanced charting and technical analysis sof tw are. http://w w w .amibroker.com 3,117
Medco Energi International Tbk [ MEDC.JK ] - Weekly - Prev. Avg. Price: 3,117
Volatility (+) : 0.0874 Volatility (-) : -0.0542 V-Ratio : 1.61 UpperBand: 3,389.04 LowerBand: 2,947.78
3,100 2,947.78 3,389.04
Oct 2017 Apr
MEDC.JK - Volume = 6,522,800.00
6,522,800
Created w ith AmiBroker - advanced charting and technical analysis sof tw are. http://w w w .amibroker.com 3,277
Medco Energi International Tbk [ MEDC.JK ] - Monthly Prev. Avg. Price: 3,277
Volatility (+) : 0.1126 Volatility (-) : -0.0954 V-Ratio : 1.18 UpperBand: 3,645.53 LowerBand: 2,964.17
3,100 2,964.17 3,645.53
2015 2016 2017
MEDC.JK - Volume = 187,952,416.00
187,952,416
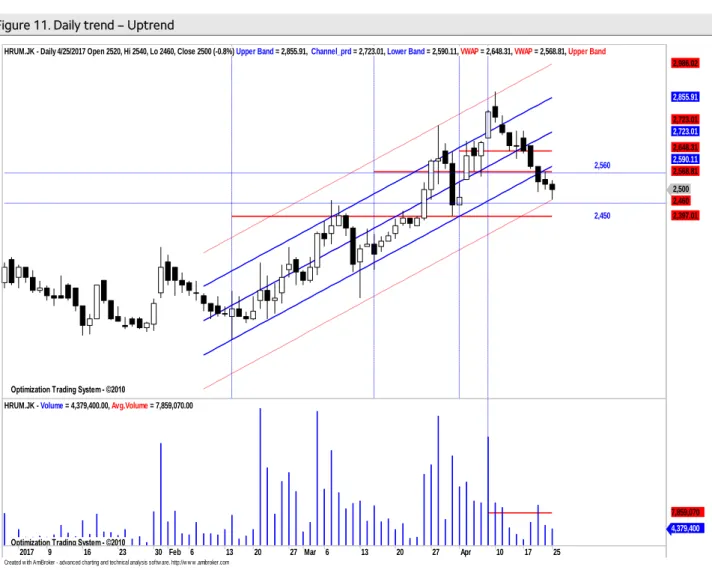
Harum Energy (HRUM) – Trading Buy
Harga akan coba naik mendekati normal lower band pada uptrend channel .
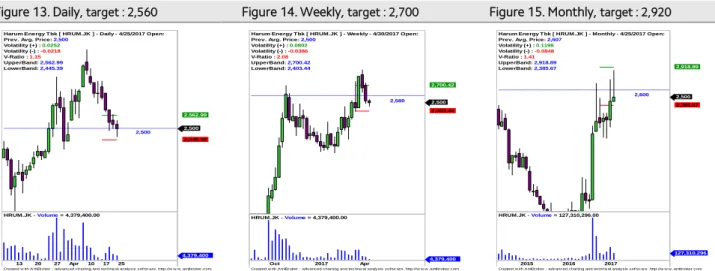
Secara umum harga saham ini juga masih bergerak dalam pola uptrend channel yang masih relatif valid (r-squared = 0,852) selama 50 hari terakhir dan bergerak normal dalam rentang +/- 1.45 std.deviasi dari center line. Peluang harga keluar dari pergerakan normal sekitar 14.83 % (sekitar 7 bar chart ). Volatilitas normal pergerakan harga saham ini sepanjang uptrend channel sebesar +/- 3.04 % atau sekitar +/- 75.88 (potensi naik dan turun secara normal maksimum/minimum sebesar 80 rupiah) dari level penutupan terakhir sebagaimana terlihat pada Figure 11.
Summary
Item Data Item Data
Close (April 25, 2017) 2,500(-0.8%) Normal trading range 2,450-2,590 Relative Avg. Price performance to JCI (%) 6.90 Target
β (beta) 0.71 - Daily 2,560
Corelation 0.92 - Weekly 2,700
Period 50 - Monthly 2,920
r-squared 0.852 Stop loss 2,450
Volatility (+/-, %) 3.04
Volatility (+/-, Rp.) 75.88
Source: Mirae Asset Sekuritas Indonesia Research
Figure 11. Daily trend – Uptrend
Source: Mirae Asset Sekuritas Indonesia Research
Created w ith AmiBroker - advanced charting and technical analysis softw are. http://w w w .amibroker.com Optimization Trading System - ©2010
Optimization Trading System - ©2010 Optimization Trading System - ©2010 Optimization Trading System - ©2010 Optimization Trading System - ©2010
2,450 2,560 HRUM.JK - Daily 4/25/2017 Open 2520, Hi 2540, Lo 2460, Close 2500 (-0.8%) Upper Band = 2,855.91, Channel_prd = 2,723.01, Lower Band = 2,590.11, VWAP = 2,648.31, VWAP = 2,568.81, Upper Band
2,500 2,460 2,397.01 2,568.81 2,590.11 2,648.31 2,723.01 2,723.01 2,855.91 2,986.02
2017 9 16 23 30 Feb 6 13 20 27 Mar 6 13 20 27 Apr 10 17 25
Optimization Trading System - ©2010
HRUM.JK - Volume = 4,379,400.00, Avg.Volume = 7,859,070.00
4,379,400 7,859,070
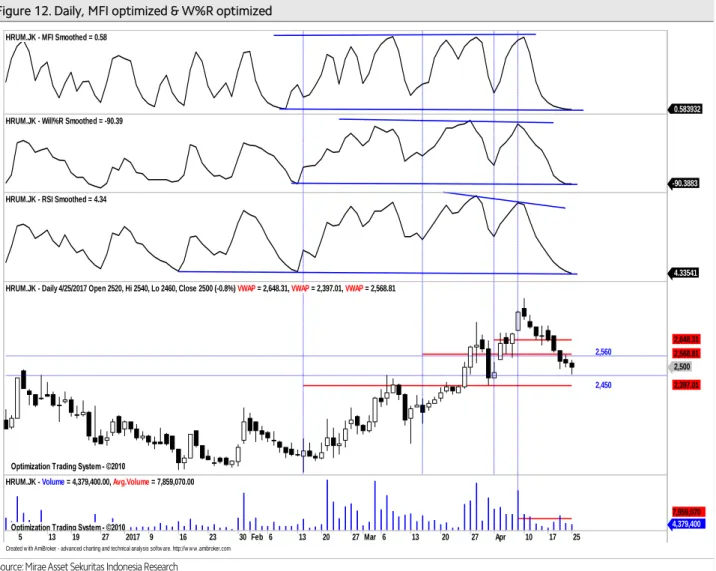
Aliran dana keluar dan volatilitas harga turun mulai terbatas.
Pada Figure 12, terlihat dari hasil optimalisasi indikator MFI optimized ,indikator W%R optimized dan RSI Optimized saat ini cenderung menguji support trendline dengan volume di di bawah rata-rata. Hal ini mengindikasikan potensi koreksi sudah terbatas.
Daily resistance di 2,560 sebelum ke 2,590 dan 2,650.Dailysupport saat ini di 2,450 yang sekaligus sebagai stop loss level.
Figure 12. Daily, MFI optimized & W%R optimized
Source: Mirae Asset Sekuritas Indonesia Research
Created w ith AmiBroker - advanced charting and technical analysis softw are. http://w w w .amibroker.com HRUM.JK - MFI Smoothed = 0.58
0.583932 HRUM.JK - Will%R Smoothed = -90.39
-90.3883 HRUM.JK - RSI Smoothed = 4.34
4.33541
Optimization Trading System - ©2010 Optimization Trading System - ©2010 Optimization Trading System - ©2010
2,560
2,450 HRUM.JK - Daily 4/25/2017 Open 2520, Hi 2540, Lo 2460, Close 2500 (-0.8%) VWAP = 2,648.31, VWAP = 2,397.01, VWAP = 2,568.81
2,500 2,397.01 2,568.81 2,648.31
5 13 19 27 2017 9 16 23 30 Feb 6 13 20 27 Mar 6 13 20 27 Apr 10 17 25
Optimization Trading System - ©2010
HRUM.JK - Volume = 4,379,400.00, Avg.Volume = 7,859,070.00
4,379,400 7,859,070
Harga saat ini akan coba naik dan bertahan diatas rata-rata pada masing-masing periode.
Untuk naik lebih lanjut harga harus mampu bertahan minimal sekitar lower band dengan target kenaikkan terdekat ke resistance masing-masing periode sebagaimana sebagaimana terlihat pada Figure 14,15 dan 16.
Figure 13. Daily, target : 2,560 Figure 14. Weekly, target : 2,700 Figure 15. Monthly, target : 2,920 x
Source: Mirae Asset Sekuritas Indonesia Research Source: Mirae Asset Sekuritas Indonesia Research Source: Mirae Asset Sekuritas Indonesia Research
Created w ith AmiBroker - advanced charting and technical analysis sof tw are. http://w w w .amibroker.com 2,500
Harum Energy Tbk [ HRUM.JK ] - Daily - 4/25/2017 Open:
Prev. Avg. Price: 2,500 Volatility (+) : 0.0252 Volatility (-) : -0.0218 V-Ratio : 1.15 UpperBand: 2,562.99 LowerBand: 2,445.39
2,500 2,445.39 2,562.99
13 20 27 Apr 10 17 25
HRUM.JK - Volume = 4,379,400.00
4,379,400
Created w ith AmiBroker - advanced charting and technical analysis sof tw are. http://w w w .amibroker.com 2,580
Harum Energy Tbk [ HRUM.JK ] - Weekly - 4/30/2017 Open:
Prev. Avg. Price: 2,500 Volatility (+) : 0.0802 Volatility (-) : -0.0386 V-Ratio : 2.08 UpperBand: 2,700.42 LowerBand: 2,403.44
2,500 2,403.44 2,700.42
Oct 2017 Apr
HRUM.JK - Volume = 4,379,400.00
4,379,400
Created w ith AmiBroker - advanced charting and technical analysis sof tw are. http://w w w .amibroker.com 2,600
Harum Energy Tbk [ HRUM.JK ] - Monthly - 4/25/2017 Open:
Prev. Avg. Price: 2,607 Volatility (+) : 0.1198 Volatility (-) : -0.0848 V-Ratio : 1.41 UpperBand: 2,918.89 LowerBand: 2,385.67
2,500 2,385.67 2,918.89
2015 2016 2017
HRUM.JK - Volume = 127,310,296.00
127,310,296
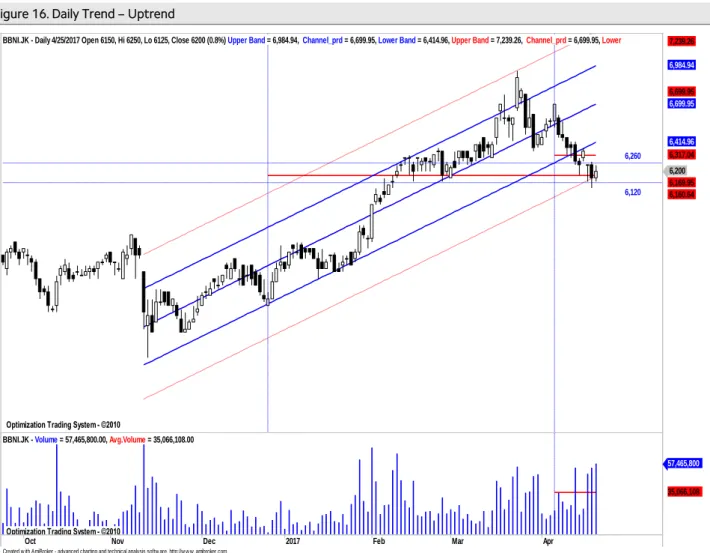
Bank Negara Indonesia (BBNI) – Trading Buy
Harga akan coba naik menguji normal lower band pada uptrend channel.
Secara umum harga saham ini akan coba bertahan sekitar normal lower band pada uptrend channel yang masih relatif valid dengan r-squared = 0.870 selama 110 hari terakhir dan bergerak normal dalam rentang +/-1.51 std.deviasi dari centerline. Peluang harga keluar dari pergerakan normalnya sekitar 13.022 % (sekitar 14 bar chart ).
Volatilitas normal pergerakan harga saham ini sepanjang uptrend channel sebesar +/- 1.38 % atau sekitar +/- 85.53 (potensi naik dan turun secara normal maksimum/minimum sebesar 80-90 rupiah) dari level penutupan terakhir sebagaimana terlihat pada Figure 16.
Summary
Item Data Item Data
Close (April 25, 2017) 6,200 (+0.8%) Normal trading range 6,140-6,410 Relative Avg. Price performance to JCI (%) (0.31) Target
β (beta) 1.31 - Daily 6,260
Corelation 0.74 - Weekly 6,360
Period 110 - Monthly 6,940
r-squared 0.870 Stop loss 6,120
Volatility (+/-, %) 1.38
Volatility (+/-, Rp.) 85.53
Source: Mirae Asset Sekuritas Indonesia Research
Figure 16. Daily Trend – Uptrend
Source: Mirae Asset Sekuritas Indonesia Research
Created w ith AmiBroker - advanced charting and technical analysis softw are. http://w w w .amibroker.com Optimization Trading System - ©2010
Optimization Trading System - ©2010 Optimization Trading System - ©2010 Optimization Trading System - ©2010
6,260
6,120 BBNI.JK - Daily 4/25/2017 Open 6150, Hi 6250, Lo 6125, Close 6200 (0.8%) Upper Band = 6,984.94, Channel_prd = 6,699.95, Lower Band = 6,414.96, Upper Band = 7,239.26, Channel_prd = 6,699.95, Lower
6,200 6,169.95 6,160.64 6,317.04 6,414.96 6,699.95 6,699.95 6,984.94 7,239.26
Oct Nov Dec 2017 Feb Mar Apr
Optimization Trading System - ©2010
BBNI.JK - Volume = 57,465,800.00, Avg.Volume = 35,066,108.00
57,465,800
35,066,108
Aliran dana masuk dan volatilitas harga naik masih terlihat.
Pada Figure 17, terlihat dari hasil optimalisasi, indikator MFI Optimized ,W%R Optimized dan RSI Optimized cenderung naik dengan volume di bawah rata-rata. Dengan demikian diperkirakan potensi kenaikkan masih terlihat. Perkiraan daily resistance terdekat ke 6,260 sebelum lanjut ke 6,320 sebelum lanjut ke 6,410. Daily support terdekat di 6,120 yang sekaligus sebagai cut loss level.
Figure 17. Daily MFI Optimized & W%R Optimized
Source: Mirae Asset Sekuritas Indonesia Research
Created w ith AmiBroker - advanced charting and technical analysis softw are. http://w w w .amibroker.com BBNI.JK - MFI Smoothed = 33.33
33.332
BBNI.JK - Will%R Smoothed = -77.71
-77.7111 BBNI.JK - RSI Smoothed = 32.19
32.185
Optimization Trading System - ©2010 Optimization Trading System - ©2010
6,120 6,260 BBNI.JK - Daily 4/25/2017 Open 6150, Hi 6250, Lo 6125, Close 6200 (0.8%) VWAP = 6,317.04, VWAP = 6,169.95
6,200 6,169.95 6,317.04
Oct Nov Dec 2017 Feb Mar Apr
Optimization Trading System - ©2010
BBNI.JK - Volume = 57,465,800.00, Avg.Volume = 35,066,108.00
57,465,800 35,066,108
Harga akan coba naik bertahan diatas rata-ratapada masing-masing periode.
Untuk naik lebih lanjut harga harus mampu bertahan minimal sekitarrata-rata dengan target kenaikkan terdekat ke resistance masing-masing periode sebagaimana terlihat pada Figure 18,19 dan 20.
Figure 18. Daily, target : 6,260 Figure 19. Weekly, target : 6,360 Figure 20. Monthly, target : 6,940
Source: Mirae Asset Sekuritas Indonesia Research Source: Mirae Asset Sekuritas Indonesia Research Source: Mirae Asset Sekuritas Indonesia Research
analyzed by : Tasrul, [email protected], +62-21- 5151140
Relative Avg.Price Performance to JCI (%) : Persentase kenaikan harga saham dari rata-rata sejak IHSG memulai uptrend-nya β (beta) : Indikator sensitivitas harga saham terhadap IHSG, beta diatas 1 berarti harga makin sensitif terhadap pergerakan IHSG dan sebaliknya
Correlation : Ukuran kuat hubungan (korelasi) pergerakan harga saham dibanding dengan pergerakan IHSG
Period : Periode uptrend / downtrend yang valid dari pergerakan harga saham
r-squared : Koefisien determinasi, menunjukkan persentase gerakan yang dapat dijelaskan dengan regresi linier.Nilai R2 terletak antara 0 – 1, dan kecocokan model dikatakan lebih baik kalau R2 semakin mendekati 1 (validitas uptrend atau downtrend makin valid) Volatility (+/-%) : Besaran volatilitas normal maksimal/minimal dari pergerakan harga harian selama harga saham bergerak normal pada trend channel dalam persentase.
Volatility (+/- point or Rp) : Besaran volatilitas normal maksimal/minimal dari pergerakan harga harian selama Harga saham bergerak
Buy : Beli, harga sudah menyentuh atau jatuh di bawah support dan indikator teknikal berada di oversold area.
Sell : Jual, harga sudah menyentuh atau tembus resistance normal dan indikator berada di overbought area.
BoW : Buy on Weakness, beli ketika harga sudah melemah, dimana volume tekanan jual mulai berkurang dan harga mendekatisupport, serta indikator teknikal sudah berada di oversold area.
SoS : Sell on Strength, jual ketika kenaikan harga sudah mulai terbatas dimana volume beli mulai berkurang dan harga mendekati resistance, serta indikator teknikal sudah berada di overbought area.
Trading Buy : Beli dan jual kembali secepatnya jika harga sudah mencapai level resistance terdekat, karena kenaikan harga relatif tidak stabil atau hanya sementara.
Trading Sell : Jual dan beli kembali secepatnya jika harga sudah mencapai level support terdekat karena koreksi harga relative tidak stabil atau hanya sementara.
Created w ith AmiBroker - advanced charting and technical analysis sof tw are. http://w w w .amibroker.com 6,192
Bank Negara Indo [ BBNI.JK ] - Daily - 4/25/2017 Open:
Prev. Avg. Price: 6,192 Volatility (+) : 0.0111 Volatility (-) : -0.0123 V-Ratio : 0.90 UpperBand: 6,260.09 LowerBand: 6,115.35
6,200
6,115.35 6,260.09
13 20 27 Apr 10 17 25
BBNI.JK - Volume = 57,465,800.00 57,465,800
Created w ith AmiBroker - advanced charting and technical analysis sof tw are. http://w w w .amibroker.com 6,192
Bank Negara Indo [ BBNI.JK ] - Weekly - 4/30/2017 Open:
Prev. Avg. Price: 6,192 Volatility (+) : 0.0278 Volatility (-) : -0.0257 V-Ratio : 1.08 UpperBand: 6,363.77 LowerBand: 6,032.65
6,200 6,032.65 6,363.77
Oct 2017 Apr
BBNI.JK - Volume = 57,465,800.00
57,465,800
Created w ith AmiBroker - advanced charting and technical analysis sof tw are. http://w w w .amibroker.com 6,325
Bank Negara Indo [ BBNI.JK ] - Monthly - 4/25/2017 Open:
Prev. Avg. Price: 6,325 Volatility (+) : 0.0975 Volatility (-) : -0.0768 V-Ratio : 1.27 UpperBand: 6,941.60 LowerBand: 5,838.93
6,200
5,838.93 6,941.6
2015 2016 2017
BBNI.JK - Volume = 436,023,488.00
436,023,488
Chart 21. JCI Vs. USD/IDR Chart 22. JCI performance (absolute vs. relative)
Source: Bloomberg, Mirae Asset Sekuritas Indonesia Note: Relative to MSCI EM Index
Source: Bloomberg, Mirae Asset Sekuritas Indonesia
Chart 23. Foreigner’s net purchase (EM) Chart 24. Energy price
Note: The latest figure for India are April 24th, 2017
Source: Bloomberg, Mirae Asset Sekuritas Indonesia Source: Bloomberg, Mirae Asset Sekuritas Indonesia
Chart 25. Non-ferrous metal price Chart 26. Precious metal price
Source: Bloomberg, Mirae Asset Sekuritas Indonesia Source: Bloomberg, Mirae Asset Sekuritas Indonesia 13,100
13,300 13,500 13,700
4,800 5,000 5,200 5,400 5,600 5,800
1/24 2/21 3/21 4/18
(IDR)
(pt) JCI (L) USD/IDR (R)
0.3 1.1 2.0
18.0
-0.9
-2.0
0.6 1.4
-4 0 4 8 12 16 20
1D 1W 1M 1Y
Absolute Relative (%, %p)
0
448
99
33 29
-35 1,144
219
348
-6 14
-200 -72 0 200 400 600 800 1,000 1,200 1,400
Korea Taiwan Indonesia Thailand Philippines India
1 Day 5 Days
(USDmn) (USDmn) (USDmn) (USDmn)
75 80 85 90 95 100 105 110
1/24 2/21 3/21 4/18
CPO WTI Coal
(D-3M=100)
80 85 90 95 100 105 110 115 120
1/24 2/21 3/21 4/18
(D-3M=100) Copper Nickel Tin
90 95 100 105 110
1/24 2/21 3/21 4/18
Silver Gold Platinum
(D-3M=100)
Table. Key valuation metrics
Company Name Ticker
Price Market Cap Price Performance (%) P/E(X)* P/B(X)* ROE(%)*
(IDR) (IDRbn) 1D 1W 1M 1Y FY16 FY17 FY16 FY17 FY16 FY17
Jakarta Composite Index JCI 5,681 6,186,013 0.3 1.1 2.0 15.6 16.2 14.1 2.5 2.3 18.0 17.9
FINANCIALS
Bank Central Asia BBCA 17,400 428,997 -0.4 0.3 5.1 32.8 18.5 18.7 3.4 3.3 20.4 18.9
Bank Mandiri Persero BMRI 11,550 269,500 1.3 -0.9 -2.9 19.4 19.6 13.5 1.8 1.7 10.3 12.4
Bank Rakyat Indonesia Persero BBRI 13,125 323,783 1.5 3.3 -0.2 25.0 10.9 11.5 1.9 2.0 20.2 18.2
Bank Negara Indonesia Persero BBNI 6,200 115,622 0.8 -1.2 -8.8 29.3 9.1 8.6 1.2 1.2 13.9 14.5
Bank Tabungan Negara Persero BBTN 2,350 24,887 0.9 3.1 1.3 35.8 13.3 11.1 1.0 1.1 7.6 10.1
CONSUMER
HM Sampoerna HMSP 3,880 451,314 -0.3 -0.8 -3.0 1.8 34.8 33.2 13.0 12.5 38.6 38.0
Gudang Garam GGRM 64,500 124,104 0.5 -0.3 -0.7 -5.1 18.4 16.3 3.1 2.8 17.3 17.9
Indofood CBP Sukses Makmur ICBP 8,500 99,126 1.2 4.6 -1.2 12.4 27.8 25.6 5.7 5.0 21.8 21.0
Indofood Sukses Makmur INDF 8,100 71,121 0.9 1.6 0.6 12.1 18.3 15.8 2.4 2.2 14.7 14.4
Kalbe Farma KLBF 1,600 75,000 1.3 1.3 6.3 15.1 30.9 29.4 6.0 5.6 20.6 19.2
Unilever Indonesia UNVR 45,300 345,639 -0.5 -0.1 5.0 1.2 46.3 48.3 62.9 62.1 134.1 136.4
AGRICULTURAL
Astra Agro Lestari AALI 14,500 27,908 0.0 -0.5 -3.2 -3.4 14.8 14.4 1.9 1.6 14.1 11.1
PP London Sumatera Indonesia LSIP 1,370 9,347 0.0 -1.8 -6.5 -15.2 20.0 12.4 1.6 1.1 7.9 9.6
Sawit Sumbermas Sarana SSMS 1,640 15,621 -1.5 -4.4 6.5 -13.0 22.5 21.3 3.9 3.9 18.3 18.4
INFRASTRUCTURE
XL Axiata EXCL 3,190 34,095 6.3 5.3 -2.4 -11.4 60.8 70.9 1.2 1.6 2.1 1.7
Jasa Marga JSMR 4,460 32,370 -0.2 -3.9 -2.0 -15.7 15.6 17.1 2.3 2.2 15.7 12.7
Perusahaan Gas Negara PGAS 2,500 60,604 3.7 -1.2 1.6 -5.3 15.3 11.1 1.5 1.4 9.8 12.6
Tower Bersama Infrastructure TBIG 6,075 27,528 0.8 1.3 11.0 5.2 17.4 21.3 14.3 8.6 83.6 49.3
Telekomunikasi Indonesia TLKM 4,420 445,536 0.0 8.1 8.3 17.5 20.3 19.4 4.7 4.6 24.3 24.0
Soechi Lines SOCI 370 2,612 -1.1 -1.1 17.8 -22.9 8.2 5.6 0.9 N/A 15.9 10.1
Garuda Indonesia GIAA 368 9,526 -0.5 -3.2 6.4 -23.2 31.7 21.4 2.6 2.6 8.6 13.2
BASIC-INDUSTRIES
Semen Indonesia SMGR 8,975 53,235 3.2 1.1 0.3 -14.9 12.0 13.7 1.9 1.7 16.3 12.9
Charoen Pokphand Indonesia CPIN 3,370 55,261 2.1 4.7 5.3 -8.9 22.6 16.1 3.6 3.3 16.5 21.5
Indocement Tunggal Prakarsa INTP 16,300 60,004 1.9 -1.2 0.2 -18.3 14.6 16.9 2.2 2.1 15.5 12.8
Japfa Comfeed Indonesia JPFA 1,555 17,743 2.0 -0.3 0.6 57.9 7.7 8.9 1.9 1.7 28.6 20.2
MINING
Indo Tambangraya Megah ITMG 19,100 21,582 1.6 -3.5 -3.9 148.9 10.4 7.9 1.5 1.7 15.0 20.0
Adaro Energy ADRO 1,845 59,014 0.3 -0.8 4.2 146.0 12.0 11.6 1.3 1.3 11.1 11.0
Aneka Tambang ANTM 700 16,822 0.0 -4.8 -4.1 -2.1 298.3 61.0 1.2 0.9 0.4 2.6
Vale Indonesia INCO 2,150 21,363 0.0 -3.6 -7.3 13.2 N/A 32.4 1.1 0.8 0.1 2.5
Tambang Batubara Bukit Asam PTBA 12,675 29,205 1.8 1.4 7.2 69.0 13.1 9.8 2.5 2.2 20.5 24.3
TRADE
United Tractors UNTR 26,600 99,222 -1.2 -5.5 -4.2 66.3 15.8 15.4 1.9 2.2 12.7 14.9
AKR Corporindo AKRA 6,600 26,401 0.0 0.8 0.0 -0.8 23.5 21.2 3.5 3.4 15.7 16.4
Global Mediacom BMTR 530 7,525 -1.9 -0.9 1.0 -50.2 41.8 N/A 0.9 N/A 2.0 N/A
Matahari Department Store LPPF 13,450 39,246 1.1 0.0 -3.2 -24.0 21.9 17.5 23.8 14.0 136.4 91.3
Media Nusantara Citra MNCN 1,805 25,768 0.8 -0.6 0.8 -17.0 14.3 12.5 2.3 2.1 17.0 17.5
Matahari Putra Prima MPPA 920 4,948 -0.5 -8.0 -19.7 -42.1 211.4 30.1 3.3 1.9 1.6 5.2
Surya Citra Media SCMA 2,890 42,256 0.7 5.1 8.2 -8.7 27.2 23.4 11.9 10.3 45.7 46.6
Siloam International Hospital SILO 13,625 17,721 -3.5 0.4 -4.0 61.5 150.3 122.3 4.5 5.5 3.5 4.7
PROPERTY
Bumi Serpong Damai BSDE 1,810 34,837 -0.5 2.5 -2.9 -6.7 18.8 14.6 1.6 1.5 9.1 10.5
Adhi Karya ADHI 2,270 8,083 -0.9 -2.6 -3.8 -20.9 23.6 13.7 1.4 1.3 5.9 10.0
Alam Sutera Realty ASRI 348 6,838 0.6 -1.7 -3.9 -13.9 13.6 8.6 1.0 0.9 7.5 11.1
Ciputra Development CTRA 1,300 24,128 0.0 4.4 2.4 -1.3 19.9 17.2 2.2 1.8 9.8 11.7
Lippo Karawaci LPKR 805 18,578 3.9 6.6 9.5 -22.6 18.6 16.7 0.9 0.9 5.0 6.1
Pembangunan Perumahan PTPP 3,230 20,026 0.6 -6.9 -4.7 -9.1 23.1 13.9 2.4 1.9 14.4 15.0
Pakuwon Jati PWON 635 30,581 4.1 8.5 5.8 19.8 16.3 15.1 3.1 2.9 21.0 19.8
Summarecon Agung SMRA 1,395 20,125 0.4 3.7 4.1 -13.9 61.3 44.5 3.1 2.9 5.1 6.9
Wijaya Karya WIKA 2,360 21,169 -0.4 -0.8 -4.1 -5.3 14.4 17.4 1.8 1.7 12.9 10.3
Waskita Karya WSKT 2,380 32,305 -0.8 0.4 -2.5 5.1 17.3 13.6 3.1 2.1 16.6 16.9
MISCELLANEOUS
Astra International ASII 9,025 365,364 -1.4 6.2 5.9 22.8 22.1 18.5 3.0 3.0 14.2 16.4
Source: Bloomberg, Mirae Asset Sekuritas Indonesia
*Note: Valuation metrics based on Bloomberg consensus estimates
Sector performance Top 10 market cap performance
Name Index Chg (%) Ticker Price Market Cap (IDRbn) Chg (%)
Agricultural 1,818.6 -0.3 BFIN IJ 4790 7,648 11.40
Mining 1,530.3 0.2 MAYA IJ 2750 13,528 6.59
Basic-Industry 610.8 1.0 EXCL IJ 3190 34,095 6.33
Miscellaneous Industry 1,517.6 -1.2 BJTM IJ 700 10,462 5.26
Consumer Goods 2,440.9 0.1 TOWR IJ 4000 40,812 5.3
Property & Construction 510.1 0.4 VIVA IJ 392 6,454 4.81
Infrastructure 1,154.6 0.9 RALS IJ 1175 8,338 4.44
Finance 882.6 0.7 PWON IJ 635 30,581 4.10
Trade 914.6 -0.3 LPKR IJ 805 18,578 3.9
Composite 5,680.8 0.3 PGAS IJ 2500 60,604 3.73
Source: Bloomberg
Top 5 leading movers Top 5 lagging movers
Name Chg (%) Close Name Chg (%) Close
BBRI IJ 1.6 13,125 ASII IJ -1.4 9,025
BMRI IJ 1.3 11,550 EMTK IJ -4.8 10,000
PGAS IJ 3.7 2,500 BBCA IJ -0.4 17,400
TOWR IJ 5.3 4,000 UNVR IJ -0.5 45,300
EXCL IJ 6.3 3,190 UNTR IJ -1.2 26,600
Source: Bloomberg
Economic Calendar
Time Currency Detail Forecast Previous
5:45am NZD Visitor Arrivals m/m -1.9%
8:30am AUD CPI q/q 0.6% 0.5%
8:30am AUD Trimmed Mean CPI q/q 0.5% 0.4%
10:00am NZD Credit Card Spending y/y 5.3%
11:30am JPY All Industries Activity m/m 0.8% 0.1%
1:00pm CHF UBS Consumption Indicator 1.50
3:00pm CHF Credit Suisse Economic Expectations 29.6
7:30pm CAD Core Retail Sales m/m 1.7%
7:30pm CAD Retail Sales m/m 2.2%
9:30pm USD Crude Oil Inventories -1.0M
Note: Time is based on Indonesian local time Source: Forex Factory
Disclaimers
This report is prepared strictly for private circulation only to clients of PT Mirae Asset Sekuritas Indonesia (MASI). It is purposed only to person having professional experience in matters relating to investments. The information contained in this report has been taken from sources which we deem reliable. No warranty (express or implied) is made to the accuracy or completeness of the information. All opinions and estimates included in this report constitute our judgments as of this date, without regards to its fairness, and are subject to change without notice. However, none of MASI and/or its affiliated companies and/or their respective employees and/or agents makes any representation or warranty (express or implied) or accepts any responsibility or liability as to, or in relation to, the accuracy or completeness of the information and opinions contained in this report or as to any information contained in this report or any other such information or opinions remaining unchanged after the issue thereof. We expressly disclaim any responsibility or liability (express or implied) of MASI, its affiliated companies and their respective employees and agents whatsoever and howsoever arising (including, without limitation for any claims, proceedings, action, suits, losses, expenses, damages or costs) which may be brought against or suffered by any person as a results of acting in reliance upon the whole or any part of the contents of this report and neither MASI, its affiliated companies or their respective employees or agents accepts liability for any errors, omissions or misstatements, negligent or otherwise, in the report and any liability in respect of the report or any inaccuracy therein or omission there from which might otherwise arise is hereby expresses disclaimed.
This document is not an offer to sell or a solicitation to buy any securities. This firms and its affiliates and their officers and employees may have a position, make markets, act as principal or engage in transaction in securities or related investments of any company mentioned herein, may perform services for or solicit business from any company mentioned herein, and may have acted upon or used any of the recommendations herein before they have been provided to you. © PT Mirae Asset Sekuritas Indonesia 2016.