Christine Natasya +62-21-515-1140 [email protected] To subscribe to our Daily Focus, please contact us at [email protected]
Mirae Asset Sekuritas Indonesia
SCMA vs MNCN revenue gap
Source: : Company data, Mirae Asset Sekuritas Indonesia Research
March 2, 2017
SCMA: New sinetrons to boost audience share
4 dari sinetron baru yang diproduksi oleh Sinemart telah tayang perdana bersamaan sejak 20 Februari 2017 di SCTV, stasiun utama SCMA dan membukukan lonjakan audience share rating. Sebagai strategi pemasaran, Sinemart telah bekerjasama dengan aktor yang dikenal karena peran mereka dalam sinetron ditayangkan oleh RCTI sebelumnya. Aktor-aktor mempopulerkan sinetron SCTV dengan hashtag
#SayaDiSCTV pada platform media sosial dan banner iklan. Sementara itu, RCTI juga memasarkan sinetron yang baru diproduksi oleh MNC Pictures dengan menggunakan hashtag #DramaSeriesTerbaik.
SCTV wins a greater audience share than RCTI for first time since 2014
Setelah tayang hari pertama, sinetron SCTV Anak Langit (tayang pukul 18.30), mencatat audience share tertinggi sebesar 31.9%, dan pada 21 Februari mencapai 32.3% (+0.4%p). Angka ini mengalahkan drama RCTI (MNCN), Roman Picisan, yang disiarkan pada waktu yang sama (18.00-18.30). Di sisi lain, sinetron SCTV Orang- Orang Kampung Duku, tayang pukul 20.00 membukukan audience share -5.1%p pada hari kedua, dikarenakan sinetron RCTI Dunia Terbalik lebih disukai. Namun secara rata-rata, audience share SCMA naik lebih dari dua kali lipat dari 11.4% (rata- rata di Januari 2017) menjadi 24.7% sekarang (rata-rata rating pada tanggal 20-28 Februari 2017).
SCMA, our top pick in media sector
Jika SCMA mempertahankan rating yang tinggi, kami percaya ini akan mendorong rate card yang tinggi, yang akan memungkinkan SCMA untuk mengejar pendapatan MNCN, meskipun akan memakan waktu (mengingat bahwa MNCN memiliki 4 channel, sementara SCMA hanya 2). Terakhir kali SCTV memperoleh rating audience share tinggi adalah di 2014, dengan sinetron Ganteng-Ganteng Serigala. Pada periode 1Q14-2Q14, kami melihat gap pendapatan MNCN yang lebih premium dibandingkan SCMA mempersempit, dibandingkan kuartal sebelumnya. Dalam pandangan kami, kemampuan SCMA untuk menaikkan audience share rating menjadi katalis yang kuat bagi perusahaan. SCMA adalah top pick kami dalam sektor media. Target harga kami di IDR3,290, yang mengimplikasikan PE 26.2x di 2017.
Market Index
Last Trade Chg (%) MoM YoY
JCI 5,363.1 -0.4 0.6 11.4
MSCI Indonesia 24.6 0.4 0.0 5.7
MSCI EM 938.5 0.2 2.6 24.4
HANG SENG 23,776.5 0.2 2.4 18.7
KOSPI 2,091.6 1.0 0.5 9.1
FTSE 7,382.9 1.6 1.7 18.2
DJIA 21,115.6 1.5 4.7 23.2
NASDAQ 5,904.0 1.3 3.4 23.9
Valuation
2017F P/E (x) P/B (x) ROE (%)
JCI 15.5 2.3 17.9
Key Rates
Last Trade Chg (bps) MoM YoY
BI 7-Day RR 4.75 0 0 -50*
3yr 7.20 0 -3 -72
10yr 7.54 0 -11 -61
*since introduced in Aug 2016
FX
Last Trade Chg (%) MoM YoY
USD/IDR 13,363.00 0.2 -0.2 -0.1
USD/KRW 1,130.35 0.0 -1.4 -7.9
USD/JPY 113.73 0.9 0.8 0.2
USD/CNY 6.88 -0.1 -0.2 4.8
Commodities
Last Trade Chg (%) MoM YoY
WTI 53.8 -0.3 -0.6 28.4
Gold 1,249.7 0.1 2.8 0.8
Coal 82.8 3.8 0.1 62.7
Palm Oil 705.0 0.0 5.0 21.3
Rubber 194.9 0.0 -15.4 83.2
Nickel 10,980.0 -0.6 7.1 26.5
Copper 5,973.0 0.7 0.5 26.7
Tin 19,525.0 1.6 -3.1 20.2
JCI Index VS MSCI Emerging Markets
650 800 950 1,100
3,500 4,500 5,500
04/13 01/14 10/14 07/15 04/16 01/17
(pt) JCI MSCI EM (pt)
1,100 5,500
(pt) JCI MSCI EM (pt)
Mirae Asset Sekuritas Indonesia cartoon
Local flashes
JPFA: Laba Japfa 2016 meroket 340%. Pada 2016, emiten perunggasan PT Japfa Comfeed Tbk., membukukan kenaikan pendapatan sebesar 8,15% menjadi Rp27,06 triliun, dan lonjakan laba 340,94% yoy menuju Rp2,06 triliun. Dalam laporan keuangan per Desember 2016, emiten bersandi saham JPFA itu meraup total penjualan bersih sebesar Rp27,06 triliun, naik 18,15% year on year/ yoy dari Rp25,02 triliun pada 2015.
Adapun jumlah pendapatan sebelum potongan atau penjualan kotor mencapai Rp27,37 triliun, meningkat 7,35% yoy dari Rp25,49 triliun di tahun sebelumnya. (Bisnis Indonesia)
ANTM: Setelah merugi, kini Antam raih laba Rp64,81 miliar. PT Aneka Tambang Persero Tbk. (ANTM) berhasil mencatat laba sebesar Rp64,81 miliar pada 2016 setelah pada tahun sebelumnya mencatatkan rugi. Berdasarkan laporan keuangan per Desember 2016 yang dipublikasikan Rabu (1/3/2017), penjualan emiten tambang ini tercatat Rp9,11 triliun atau turun 13,48% dibandingkan dengan 2015 yang sebesar Rp10,53 triliun. Penurunan penjualan terbesar dikontribusi dari produk emas yang turun menjadi Rp5,54 triliun dari Rp7,31 triliun di 2015. (Bisnis Indonesia)
PTPP: PP berharap bisa bagi dividen 30% dari laba 2016. PT PP (Persero) Tbk (PTPP) berkomitmen untuk memberikan apresiasi kepada pemegang sahamnya melalui pembayaran dividen. Hal itu disampaikan oleh Direktur PTPP, Agus Pubrianto. Pasalnya, pihak PTPP sudah mengajukan usulan ke Kementerian atas rencana pembagian dividen tersebut. Terkait besaran dividen, kata Agus, sekitar 30% dari total laba bersih yang diperoleh PTPP pada akhir tahun 2016. (Iqplus)
SILO: Siloam segera operasikan tiga rumah sakit anyar. PT Siloam International Hospitals Tbk segera mengoperasikan tiga rumah sakit anyar. Kini, perusahaan tengah menunggu izin operasional untuk menerima pasien. Perusahaan yang mencatatkan diri di Bursa Efek Indonesia (BEI) dengan kode SILO itu telah merampungkan proses kontruksi tiga rumah sakit tersebut pada 31 Desember 2016. (Kontan)
SOCI: Perkuat armada, Soechi tambah kapal baru. Emiten pengelola kapal tanker dan pemilik galangan kapal PT Soechi Lines Tbk. (SOCI) mengumumkan telah kembali membeli satu unit kapal ukuran sedang pada Januari lalu, setelah memperoleh dua tangker dengan ukuran yang sama pada Desember 2016 lalu. Berdasarkan publikasi yang dirilis perseroan, kapal tanker ukuran sedang yang baru diperoleh perseroan memiliki daya dukung 37.000 tonase bobot mati atau dead weight tonnage (DWT).
Kapal tersebut telah berusia 14 tahun yang dibeli di pasar internasional. (Bisnis Indonesia)
BDMN: Danamon bukukan pendapatan komisi naik 7%. PT Bank Danamon Tbk mencatat pertumbuhan pendapatan berbasis biaya alias komisi (fee based income) cukup bagus pada 2016. Hal ini tercermin dari realisasi fee based yang berhasil dikumpulkan sepanjang 2016 sebesar Rp 3,91 triliun. Angka tersebut naik 7% secara year on year (yoy). Direktur Keuangan Bank Danamon Vera Eve Lim mengatakan, kenaikan fee based didorong tiga lini bisnis. Salah satunya, pertumbuhan bisnis bancassurance sebesar 13% yoy menjadi Rp 281 miliar. (Kontan)
ACST: Acset sudah tembus target kontrak anyar 2017. Tahun 2017, tampaknya tahun yang cerah bagi PT Acset Indonusa Tbk(ACST). Baru berjalan dua bulan, perusahaan konstruksi yang tergabung dalam Astra Grup ini telah berhasil melampaui target kontrak baru tahun ini yang dipatok Rp 4,5 triliun. ACST berhasil melampaui target kontrak baru, setelah mendapatkan proyek pembangunan jalan tol Jakarta-Cikampek II Elevated. Kontrak proyek tol tersebut dimenangkan bersama PT Waskita Karya Tbk (WSKT). (Kontan)
Technical analysis
Tasrul +62-21-515-1140 [email protected] Jakarta Composite Index (JCI) – Tendency to rise
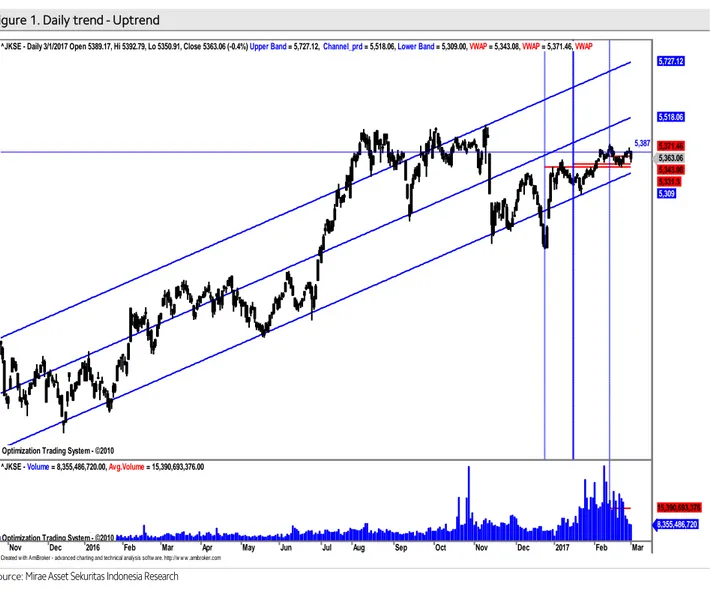
IHSG akan menguji resistance di 5,387
IHSG saat masih dalam pola uptrend jangka panjang relatif valid yang dimulai sejak selama 378 hari terakhir dengan r-squared = 0.8474 dan bergerak normal dalam rentang +/-1.43 std.deviasi dari centerline. Peluang IHSG bergerak di luar pergerakan normal sekitar 15.26% atau sekitar 58 bar chart. Volatilitas normal pergerakan IHSG saat ini sebesar +/-0.49% atau sekitar +/-26.0 point. IHSG akan coba menguji resistance di 5,387 sebagaimana terlihat pada Figure 1.
Summary
Item Data Item Data
Close (March 1, 2017) 5,363(-0.4%) Trading range 5,343-5,387 Average index performance (%) 5.35 Target
Period 378 - Daily 5,400
r-squared 0.8474 - Weekly 5,411
Volatility (+/-, %) 0.49 - Monthly 5,453 Volatility (+/-, point) 26.0 Stop loss 5,331 Source: Mirae Asset Sekuritas Indonesia Research
Figure 1. Daily trend - Uptrend
Source: Mirae Asset Sekuritas Indonesia Research
Created w ith AmiBroker - advanced charting and technical analysis softw are. http://w w w .amibroker.com Optimization Trading System - ©2010
Optimization Trading System - ©2010 Optimization Trading System - ©2010 Optimization Trading System - ©2010
5,387
^JKSE - Daily 3/1/2017 Open 5389.17, Hi 5392.79, Lo 5350.91, Close 5363.06 (-0.4%) Upper Band = 5,727.12, Channel_prd = 5,518.06, Lower Band = 5,309.00, VWAP = 5,343.08, VWAP = 5,371.46, VWAP
5,363.06 5,343.08 5,331.3 5,309 5,371.46 5,518.06 5,727.12
Nov Dec 2016 Feb Mar Apr May Jun Jul Aug Sep Oct Nov Dec 2017 Feb Mar
Optimization Trading System - ©2010
^JKSE - Volume = 8,355,486,720.00, Avg.Volume = 15,390,693,376.00
8,355,486,720 15,390,693,376
Aliran dana keluar dan volatilitas indeks turun masih terlihat.
Pada Figure 2, terlihat dari hasil optimalisasi terakhir, indikator MFI Optimized dan indikator RSI optimized masih cenderung turun namun volume masih di bawah rata-rata, dengan demikian potensi koreksi masih terlihat namun terbatas. Resistance terdekat di 5,387. Sementara support terdekat di 5,34. Stop loss level di 5,331.
Figure 2. Daily MFI optimized & RSI optimized
Source: Mirae Asset Sekuritas Indonesia Research
Created w ith AmiBroker - advanced charting and technical analysis softw are. http://w w w .amibroker.com
^JKSE - MFI Smoothed = 51.33
51.3288
^JKSE - RSI Smoothed = 37.73
37.7273
Optimization Trading System - ©2010 Optimization Trading System - ©2010 Optimization Trading System - ©2010
5,387
^JKSE - Daily 3/1/2017 Open 5389.17, Hi 5392.79, Lo 5350.91, Close 5363.06 (-0.4%) VWAP = 5,331.30, VWAP = 5,371.46, VWAP = 5,343.08
5,363.06 5,343.08 5,331.3 5,371.46
26 Oct 10 17 24 31Nov 7 14 21 28 Dec 13 19 27 2017 9 16 23 30 Feb 6 13 20 27 Mar
Optimization Trading System - ©2010
^JKSE - Volume = 8,355,486,720.00, Avg.Volume = 15,390,693,376.00
8,355,486,720 15,390,693,376
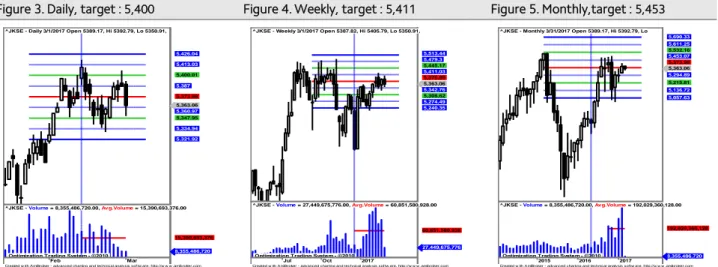
IHSG akan coba bertahan sekitar rata-rata pada masing-masing periode.
Untuk mampu naik lebih lanjut IHSG saat ini harus mampu bertahan minimal sekitar rata-rata masing-masing periode dengan target terdekat berikutnya resistance 2 pada periode masing-masing sebagaimana terlihat pada Figure 3,4 dan 5.
Figure 3. Daily, target : 5,400 Figure 4. Weekly, target : 5,411 Figure 5. Monthly,target : 5,453
x
Source: Mirae Asset Sekuritas Indonesia Research Source: Mirae Asset Sekuritas Indonesia Research Source: Mirae Asset Sekuritas Indonesia Research
Created w ith AmiBroker - advanced charting and technical analysis sof tw are. http://w w w .amibroker.com
^JKSE - Weekly 3/1/2017 Open 5387.82, Hi 5405.79, Lo 5350.91,
5,363.06 5,342.76 5,308.62 5,274.49 5,240.35 5,376.89 5,411.03 5,445.17 5,479.3 5,513.44
Jul Oct 2017
Optimization Trading System - ©2010
^JKSE - Volume = 27,449,675,776.00, Avg.Volume = 60,851,580,928.00
27,449,675,776 60,851,580,928
Created w ith AmiBroker - advanced charting and technical analysis sof tw are. http://w w w .amibroker.com
^JKSE - Daily 3/1/2017 Open 5389.17, Hi 5392.79, Lo 5350.91,
5,363.06 5,360.97 5,347.95 5,334.94 5,321.92 5,373.98 5,387 5,400.01 5,413.03 5,426.04
Feb Mar
Optimization Trading System - ©2010
^JKSE - Volume = 8,355,486,720.00, Avg.Volume = 15,390,693,376.00
8,355,486,720 15,390,693,376
Created w ith AmiBroker - advanced charting and technical analysis sof tw are. http://w w w .amibroker.com
^JKSE - Monthly 3/31/2017 Open 5389.17, Hi 5392.79, Lo
5,363.06 5,294.89 5,215.81 5,136.72 5,057.63 5,373.98 5,453.07 5,532.16 5,611.25 5,690.33
2015 2016 2017
Optimization Trading System - ©2010
^JKSE - Volume = 8,355,486,720.00, Avg.Volume = 192,029,360,128.00
8,355,486,720 192,029,360,128
Stocks on our focus list
Japfa Comfeed Indonesia (JPFA) – Trading Buy
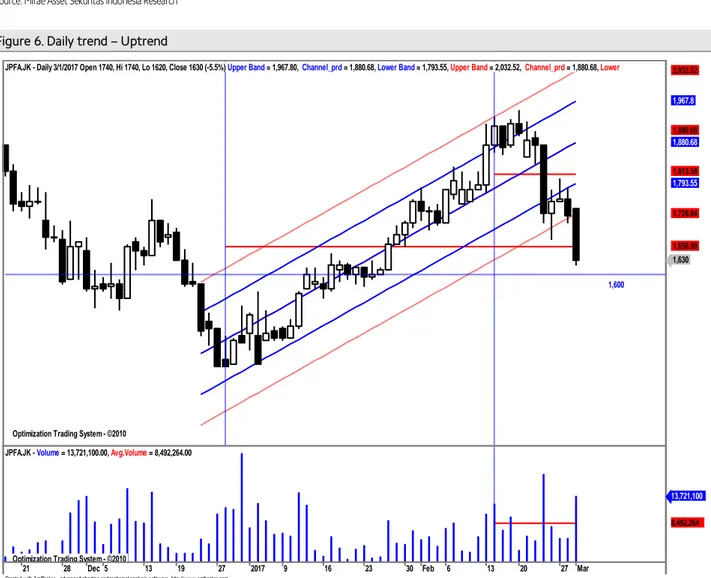
Harga akan coba naik mendekati abnormal lower band pada trend channel.
Secara umum harga saham ini masih bergerak pada uptrend channel yang masih relatif valid (r-squared = 0.78) selama 47 hari terakhir yang bergerak normal dalam rentang +/- 1.21 std.deviasi dari center line. Peluang harga keluar dari pergerakan normal sekitar 22.1 % (sekitar 10 bar chart ). Volatilitas normal pergerakkan harga saham ini sepanjang uptrend channel sebesar +/- 2.39% atau sekitar +/-38.97 (potensi naik dan turun secara normal maksimum/minimum sebesar 35-40 rupiah) dari level penutupan terakhir. Saat ini harga akan coba naik mendekati abnormal lower band pada uptrend channel sebagaimana terlihat pada Figure 6.
Summary
Item Data Item Data
Close (March 1, 2017) 1,630(-5.5%) Trading range 1,600-1,680
Relative Avg. Price performance to JCI (%) 42.34 Target
β (beta) 1.39 - Daily 1,680
Corelation 0.96 - Weekly 1,750
Period 47 - Monthly 1,790
r-squared 0.78 Stop loss 1,600
Volatility (+/-, %) 2.39
Volatility (+/-, Rp.) 38.97
Source: Mirae Asset Sekuritas Indonesia Research
Figure 6. Daily trend – Uptrend
Source: Mirae Asset Sekuritas Indonesia Research
Created w ith AmiBroker - advanced charting and technical analysis softw are. http://w w w .amibroker.com Optimization Trading System - ©2010
Optimization Trading System - ©2010 Optimization Trading System - ©2010 Optimization Trading System - ©2010
1,600 JPFA.JK - Daily 3/1/2017 Open 1740, Hi 1740, Lo 1620, Close 1630 (-5.5%) Upper Band = 1,967.80, Channel_prd = 1,880.68, Lower Band = 1,793.55, Upper Band = 2,032.52, Channel_prd = 1,880.68, Lower
1,630 1,658.99 1,728.84 1,793.55 1,813.58 1,880.68 1,880.68 1,967.8 2,032.52
21 28 Dec 5 13 19 27 2017 9 16 23 30 Feb 6 13 20 27 Mar
Optimization Trading System - ©2010
JPFA.JK - Volume = 13,721,100.00, Avg.Volume = 8,492,264.00
13,721,100
8,492,264
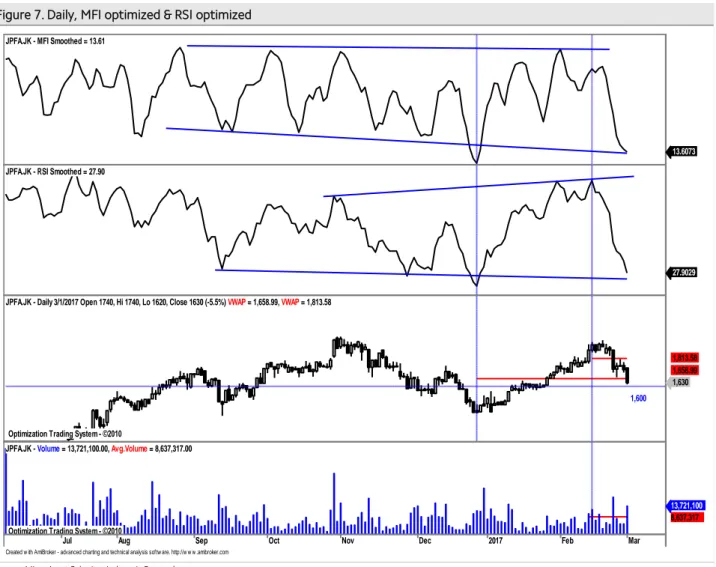
Aliran dana keluar dan volatilitas harga turun mulai terbatas dengan kecenderungan menguat .
Pada Figure 7, terlihat dari hasil optimalisasi terakhir, indikator MFI Optimized dan indikator RSI optimized akan menguji support trend line volume tembus rata-rata. Hal ini mengindikasikan potensi koreksi sudah terbatas. Resistance terdekat di 1,740 sebelum lanjut ke 1,790-1,810. Support terdekat di 1,600 yang sekaligus sebagai stop loss level.
Figure 7. Daily, MFI optimized & RSI optimized
Source: Mirae Asset Sekuritas Indonesia Research
Created w ith AmiBroker - advanced charting and technical analysis softw are. http://w w w .amibroker.com JPFA.JK - MFI Smoothed = 13.61
13.6073 JPFA.JK - RSI Smoothed = 27.90
27.9029
Optimization Trading System - ©2010 Optimization Trading System - ©2010
1,600 JPFA.JK - Daily 3/1/2017 Open 1740, Hi 1740, Lo 1620, Close 1630 (-5.5%) VWAP = 1,658.99, VWAP = 1,813.58
1,630 1,658.99 1,813.58
Jul Aug Sep Oct Nov Dec 2017 Feb Mar
Optimization Trading System - ©2010
JPFA.JK - Volume = 13,721,100.00, Avg.Volume = 8,637,317.00
13,721,100 8,637,317
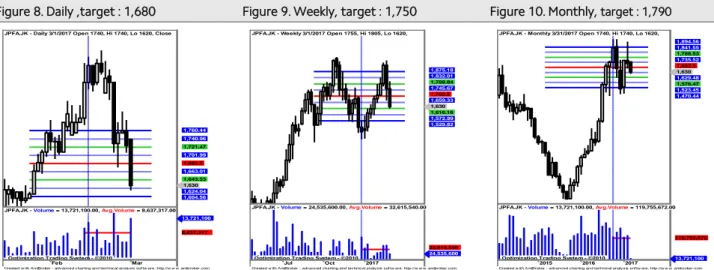
Harga akan naik dan bertahan sekitar rata-rata pada masing-masing periode.
Untuk naik lebih lanjut harga harus mampu bertahan minimal sekitar rata-rata masing- masing periodedengan target berikutnya mendekati resistance 2 pada masing-masing periode sebagaimana terlihat pada Figure 8,9 dan 10.
Figure 8. Daily ,target : 1,680 Figure 9. Weekly, target : 1,750 Figure 10. Monthly, target : 1,790
Source: Mirae Asset Sekuritas Indonesia Research Source: Mirae Asset Sekuritas Indonesia Research Source: Mirae Asset Sekuritas Indonesia Research
Created w ith AmiBroker - advanced charting and technical analysis sof tw are. http://w w w .amibroker.com JPFA.JK - Daily 3/1/2017 Open 1740, Hi 1740, Lo 1620, Close
1,630 1,624.04 1,604.56 1,643.53 1,663.01 1,682.5 1,701.99 1,721.47 1,740.96 1,760.44
Feb Mar
Optimization Trading System - ©2010
JPFA.JK - Volume = 13,721,100.00, Avg.Volume = 8,637,317.00 13,721,100 8,637,317
Created w ith AmiBroker - advanced charting and technical analysis sof tw are. http://w w w .amibroker.com JPFA.JK - Weekly 3/1/2017 Open 1755, Hi 1805, Lo 1620,
1,630 1,616.16 1,572.99 1,529.82 1,659.33 1,702.5 1,745.67 1,788.84 1,832.01 1,875.18
Jul Oct 2017
Optimization Trading System - ©2010
JPFA.JK - Volume = 24,535,600.00, Avg.Volume = 32,615,540.00
24,535,600 32,615,540
Created w ith AmiBroker - advanced charting and technical analysis sof tw are. http://w w w .amibroker.com JPFA.JK - Monthly 3/31/2017 Open 1740, Hi 1740, Lo 1620,
1,630 1,629.48 1,576.47 1,523.45 1,470.44 1,682.5 1,735.52 1,788.53 1,841.55 1,894.56
2015 2016 2017
Optimization Trading System - ©2010
JPFA.JK - Volume = 13,721,100.00, Avg.Volume = 119,755,672.00
13,721,100 119,755,672
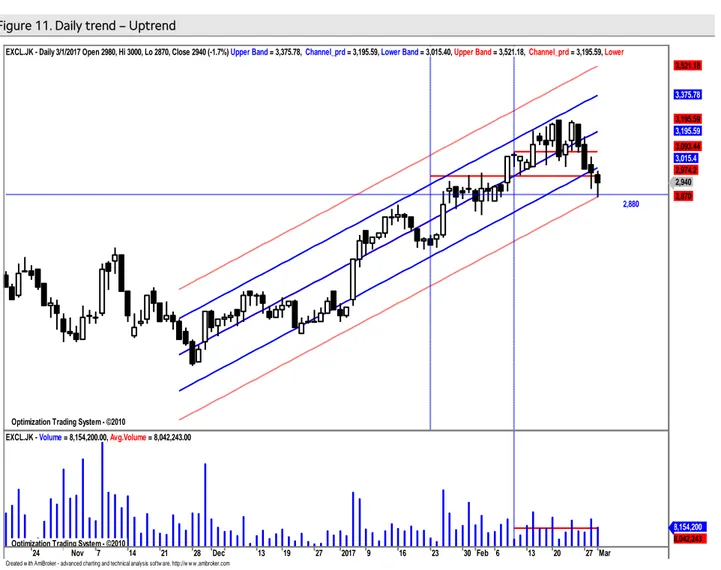
XL Axiata (EXCL) – Trading Buy
Harga akan coba naik dan tembus normal lower band pada uptrend channel . Secara umum harga saham ini juga masih bergerak dalam pola uptrend channel yang masih relatif valid (r-squared = 0.90) selama 66 hari terakhir dan bergerak normal dalam rentang +/- 1.66 std.deviasi dari center line. Peluang harga keluar dari pergerakan normal sekitar 9.72% (sekitar 6 bar chart ). Volatilitas normal pergerakan harga saham ini sepanjang uptrend channel sebesar +/ 2.28 % atau sekitar +/- 66.97 (potensi naik dan turun secara normal maksimum/minimum sebesar 65-70 rupiah) dari level penutupan terakhir. Saat ini harga akan coba naik dan tembus normal lower band pada uptrend channel sebagaimana terlihat pada Figure 11.
Summary
Item Data Item Data
Close (March 1, 2017) 2,940(-1.7%) Trading range 2,880-3,090 Relative Avg. Price performance to JCI (%) (4.88) Target
β (beta) 1.10 - Daily 3,010
Corelation (0.32) - Weekly 3,140
Period 66 - Monthly 3,160
r-squared 0.90 Stop loss 2,880
Volatility (+/-, %) 2.28
Volatility (+/-, Rp.) 66.97
Source: Mirae Asset Sekuritas Indonesia Research
Figure 11. Daily trend – Uptrend
Source: Mirae Asset Sekuritas Indonesia Research
Created w ith AmiBroker - advanced charting and technical analysis softw are. http://w w w .amibroker.com Optimization Trading System - ©2010
Optimization Trading System - ©2010 Optimization Trading System - ©2010 Optimization Trading System - ©2010
2,880 EXCL.JK - Daily 3/1/2017 Open 2980, Hi 3000, Lo 2870, Close 2940 (-1.7%) Upper Band = 3,375.78, Channel_prd = 3,195.59, Lower Band = 3,015.40, Upper Band = 3,521.18, Channel_prd = 3,195.59, Lower
2,940 2,870 2,974.2 3,015.4 3,093.44 3,195.59 3,195.59 3,375.78 3,521.18
24 31Nov 7 14 21 28 Dec 13 19 27 2017 9 16 23 30 Feb 6 13 20 27 Mar
Optimization Trading System - ©2010
EXCL.JK - Volume = 8,154,200.00, Avg.Volume = 8,042,243.00
8,154,200 8,042,243
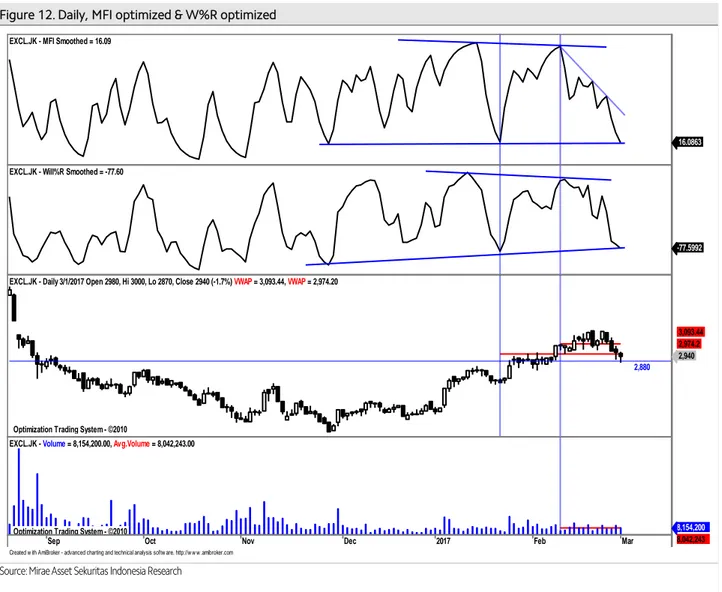
Aliran dana keluar dan volatilitas harga turun mulai terbatas dengan kecenderungan menguat.
Pada Figure 12, terlihat dari hasil optimalisasi indikator MFI Optimized dan indikator W%R Optimized masih cenderung turun dengan volume sekitar rata-rata. Hal ini mengindikasikan potensi koreksi masih terlihat namun sudah mulai terbatas dengan kecenderungan menguat. Resistance terdekat di 3,020. Support saat ini di 2,880 yang sekaligus sebagai stop loss level.
Figure 12. Daily, MFI optimized & W%R optimized
Source: Mirae Asset Sekuritas Indonesia Research
Created w ith AmiBroker - advanced charting and technical analysis softw are. http://w w w .amibroker.com EXCL.JK - MFI Smoothed = 16.09
16.0863
EXCL.JK - Will%R Smoothed = -77.60
-77.5992
Optimization Trading System - ©2010 Optimization Trading System - ©2010
2,880 EXCL.JK - Daily 3/1/2017 Open 2980, Hi 3000, Lo 2870, Close 2940 (-1.7%) VWAP = 3,093.44, VWAP = 2,974.20
2,940 2,974.2 3,093.44
Sep Oct Nov Dec 2017 Feb Mar
Optimization Trading System - ©2010
EXCL.JK - Volume = 8,154,200.00, Avg.Volume = 8,042,243.00
8,154,200 8,042,243
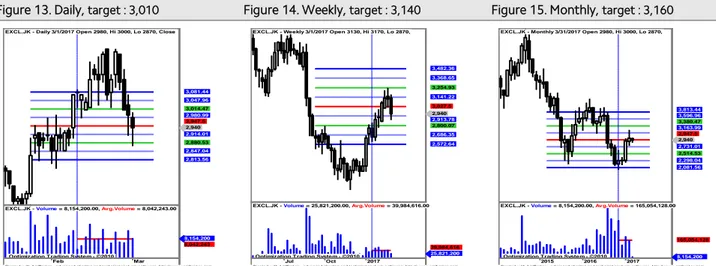
Harga akan coba naik dan bertahan diatas level rata-rata masing-masing periode.
Untuk naik lebih lanjut harga harus mampu bertahan minimal sekitar rata-rata masing- masing periode dengan target berikutnya ke resistance 2 sebagaimana terlihat pada Figure 14,15 dan 16.
Figure 13. Daily, target : 3,010 Figure 14. Weekly, target : 3,140 Figure 15. Monthly, target : 3,160 x
Source: Mirae Asset Sekuritas Indonesia Research Source: Mirae Asset Sekuritas Indonesia Research Source: Mirae Asset Sekuritas Indonesia Research
Created w ith AmiBroker - advanced charting and technical analysis sof tw are. http://w w w .amibroker.com EXCL.JK - Daily 3/1/2017 Open 2980, Hi 3000, Lo 2870, Close
2,940 2,914.01 2,880.53 2,847.04 2,813.56 2,947.5 2,980.99 3,014.47 3,047.96 3,081.44
Feb Mar
Optimization Trading System - ©2010
EXCL.JK - Volume = 8,154,200.00, Avg.Volume = 8,042,243.00
8,154,200 8,042,243
Created w ith AmiBroker - advanced charting and technical analysis sof tw are. http://w w w .amibroker.com EXCL.JK - Weekly 3/1/2017 Open 3130, Hi 3170, Lo 2870,
2,940 2,913.78 2,800.07 2,686.35 2,572.64 3,027.5 3,141.22 3,254.93 3,368.65 3,482.36
Jul Oct 2017
Optimization Trading System - ©2010
EXCL.JK - Volume = 25,821,200.00, Avg.Volume = 39,984,616.00
25,821,200 39,984,616
Created w ith AmiBroker - advanced charting and technical analysis sof tw are. http://w w w .amibroker.com EXCL.JK - Monthly 3/31/2017 Open 2980, Hi 3000, Lo 2870,
2,940 2,731.01 2,514.53 2,298.04 2,081.56 2,947.5 3,163.99 3,380.47 3,596.96 3,813.44
2015 2016 2017
Optimization Trading System - ©2010
EXCL.JK - Volume = 8,154,200.00, Avg.Volume = 165,054,128.00
8,154,200 165,054,128
Bank Negara Indonesia (BBNI) – Trading Buy
Harga akan coba naik dan tembus normal lower band pada uptrend channel.
Secara umum harga saham ini akan coba naik dan tembus normal lower band pada uptrend channel yang masih relatif valid dengan r-squared = 0.87 selama 33 hari terakhir dan bergerak normal dalam rentang +/-1.52 std.deviasi dari centerline. Peluang harga keluar dari pergerakan normalnya sekitar 12.95 % (sekitar 4 bar chart ).
Volatilitas normal pergerakan harga saham ini sepanjang uptrend channel sebesar +/- 1.17 % atau sekitar +/-72.68 (potensi naik dan turun secara normal maksimum/minimum sebesar 70-75 rupiah) dari level penutupan terakhir sebagaimana terlihat pada Figure 16.
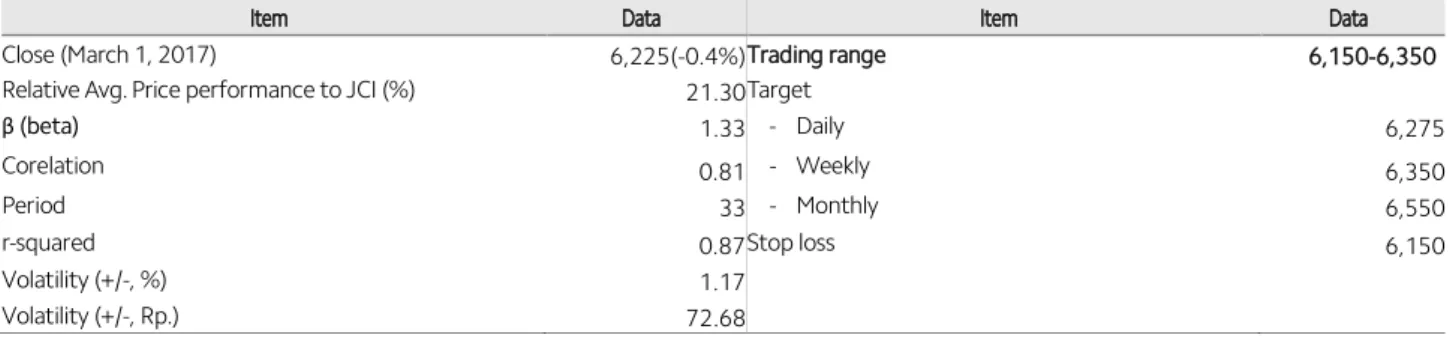
Summary
Item Data Item Data
Close (March 1, 2017) 6,225(-0.4%) Trading range 6,150-6,350
Relative Avg. Price performance to JCI (%) 21.30 Target
β (beta) 1.33 - Daily 6,275
Corelation 0.81 - Weekly 6,350
Period 33 - Monthly 6,550
r-squared 0.87 Stop loss 6,150
Volatility (+/-, %) 1.17
Volatility (+/-, Rp.) 72.68
Source: Mirae Asset Sekuritas Indonesia Research
Figure 16. Daily Trend – Uptrend
Source: Mirae Asset Sekuritas Indonesia Research
Created w ith AmiBroker - advanced charting and technical analysis softw are. http://w w w .amibroker.com Optimization Trading System - ©2010
Optimization Trading System - ©2010 Optimization Trading System - ©2010
6,350
6,150 BBNI.JK - Daily 3/1/2017 Open 6150, Hi 6250, Lo 6150, Close 6225 (-0.4%) Upper Band = 6,646.92, Channel_prd = 6,461.23, Lower Band = 6,275.54, VWAP = 6,012.19, VWAP = 6,243.75
6,225
6,012.19 6,243.75 6,275.54 6,461.23 6,646.92
Dec 5 13 19 27 2017 9 16 23 30 Feb 6 13 20 27 Mar
Optimization Trading System - ©2010
BBNI.JK - Volume = 21,821,200.00, Avg.Volume = 22,775,384.00
21,821,200 22,775,384
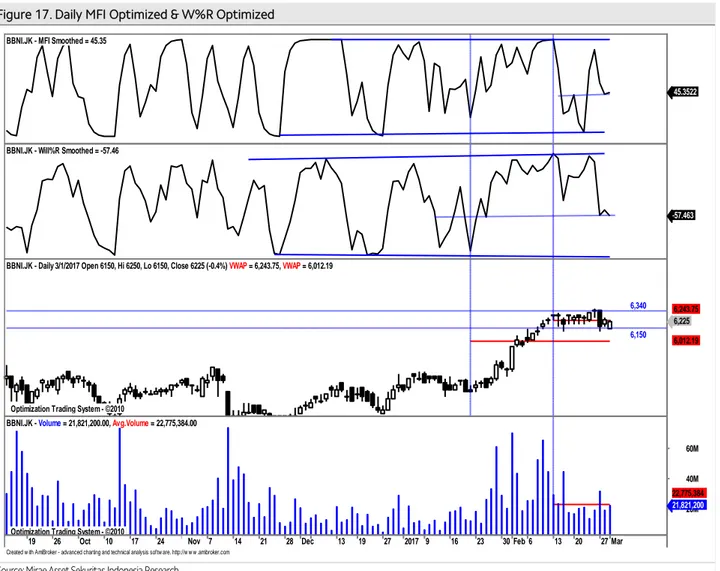
Aliran dana keluar dan volatilitas harga turun mulai tertahan dan cenderung menguat.
Pada Figure 17, terlihat dari hasil optimalisasi, indikator MFI Optimized dan indikator W%R Optimized akan menguji support trend line dengan volume mendekati rata-rata.
Dengan demikian diperkirakan potensi koreksi sudah mulai tertahan. Perkiraan resistance terdekat ke 6,275 sebelum lanjut ke 6,350. Support terdekat di 6,150 yang sekaligus sebagai stop loss level.
Figure 17. Daily MFI Optimized & W%R Optimized
Source: Mirae Asset Sekuritas Indonesia Research
Created w ith AmiBroker - advanced charting and technical analysis softw are. http://w w w .amibroker.com BBNI.JK - MFI Smoothed = 45.35
45.3522
BBNI.JK - Will%R Smoothed = -57.46
-57.463
Optimization Trading System - ©2010 Optimization Trading System - ©2010
6,340
6,150 BBNI.JK - Daily 3/1/2017 Open 6150, Hi 6250, Lo 6150, Close 6225 (-0.4%) VWAP = 6,243.75, VWAP = 6,012.19
6,225
6,012.19 6,243.75
19 26 Oct 10 17 24 31Nov 7 14 21 28 Dec 13 19 27 2017 9 16 23 30 Feb 6 13 20 27 Mar
20M 40M 60M
Optimization Trading System - ©2010
BBNI.JK - Volume = 21,821,200.00, Avg.Volume = 22,775,384.00
21,821,200 22,775,384
Harga akan coba naik mendekati resistance 2 pada masing-masing periode.
Untuk naik lebih lanjut harga harus mampu bertahan sekitar rata-rata masing-masing periode dengan targetterdekat minimal resistance 2 sebagaimana terlihat pada Figure 18,19 dan 20.
Figure 18. Daily, target : 6,275 Figure 19. Weekly, target : 6,350 Figure 20. Monthly, target : 6,550
Source: Mirae Asset Sekuritas Indonesia Research Source: Mirae Asset Sekuritas Indonesia Research Source: Mirae Asset Sekuritas Indonesia Research
analyzed by : Tasrul, [email protected], +62-21- 5151140
Relative Avg.Price Performance to JCI (%) : Persentase kenaikan harga saham dari rata-rata sejak IHSG memulai uptrend-nya β (beta) : Indikator sensitivitas harga saham terhadap IHSG, beta diatas 1 berarti harga makin sensitif terhadap pergerakan IHSG dan sebaliknya
Correlation : Ukuran kuat hubungan (korelasi) pergerakan harga saham dibanding dengan pergerakan IHSG
Period : Periode uptrend / downtrend yang valid dari pergerakan harga saham
r-squared : Koefisien determinasi, menunjukkan persentase gerakan yang dapat dijelaskan dengan regresi linier.Nilai R2 terletak antara 0 – 1, dan kecocokan model dikatakan lebih baik kalau R2 semakin mendekati 1 (validitas uptrend atau downtrend makin valid) Volatility (+/-%) : Besaran volatilitas normal maksimal/minimal dari pergerakan harga harian selama harga saham bergerak normal pada trend channel dalam persentase.
Volatility (+/- point or Rp) : Besaran volatilitas normal maksimal/minimal dari pergerakan harga harian selama Harga saham bergerak
Buy: : Beli, harga sudah menyentuh atau jatuh di bawah support dan indikator teknikal berada di oversold area.
Sell: : Jual, harga sudah menyentuh atau tembus resistance normal dan indikator berada di overbought area.
BoW: : Buy on Weakness, beli ketika harga sudah melemah, dimana Volume tekanan jual mulai berkurang dan harga mendekati support, serta indikator teknikal sudah berada di oversold area.
SoS: : Sell on Strength, jual ketika kenaikan harga sudah mulai terbatas dimana volume beli mulai berkurang dan harga mendekati resistance, serta indikator teknikal sudah berada di overbought area.
Trading Buy: : Beli dan jual kembali secepatnya jika harga sudah mencapai level resistance terdekat, karena kenaikan harga relatif tidak stabil atau hanya sementara.
Trading Sell : Jual dan beli kembali secepatnya jika harga sudah mencapai level support terdekat karena koreksi harga relative tidak stabil atau hanya sementara.
Created w ith AmiBroker - advanced charting and technical analysis sof tw are. http://w w w .amibroker.com BBNI.JK - Daily 3/1/2017 Open 6150, Hi 6250, Lo 6150, Close
6,225 6,193.75 6,157.41 6,121.07 6,084.73 6,048.4 6,230.09 6,266.43 6,302.77 6,339.1
Feb Mar
Optimization Trading System - ©2010
BBNI.JK - Volume = 21,821,200.00, Avg.Volume = 22,775,384.00
21,821,200 22,775,384
Created w ith AmiBroker - advanced charting and technical analysis sof tw are. http://w w w .amibroker.com BBNI.JK - Weekly 3/1/2017 Open 6350, Hi 6350, Lo 6125,
6,225 6,179.36 6,096.21 6,013.07 5,929.92 6,262.5 6,345.64 6,428.79 6,511.93 6,595.08
Jul Oct 2017
Optimization Trading System - ©2010
BBNI.JK - Volume = 71,721,696.00, Avg.Volume = 98,979,432.00
71,721,696 98,979,432
Created w ith AmiBroker - advanced charting and technical analysis sof tw are. http://w w w .amibroker.com BBNI.JK - Monthly 3/31/2017 Open 6150, Hi 6250, Lo 6150,
6,225 6,193.75 6,012.08 5,830.42 5,648.75 5,467.08 6,375.42 6,557.08 6,738.75 6,920.42
2015 2016 2017
Optimization Trading System - ©2010 - Powered by AMTA BBNI.JK - Volume = 21,821,200.00, Avg.Volume = 363,363,776.00
21,821,200 363,363,776
Chart 21. JCI Vs. USD/IDR Chart 22. JCI performance (absolute vs. relative)
Source: Bloomberg, Mirae Asset Sekuritas Indonesia Note: Relative to MSCI EM Index
Source: Bloomberg, Mirae Asset Sekuritas Indonesia
Chart 23. Foreigner’s net purchase (EM) Chart 24. Energy price
Note: The latest figure for India are Feb 28, 2017
Source: Bloomberg, Mirae Asset Sekuritas Indonesia Source: Bloomberg, Mirae Asset Sekuritas Indonesia
Chart 25. Non-ferrous metal price Chart 26. Precious metal price
Source: Bloomberg, Mirae Asset Sekuritas Indonesia Source: Bloomberg, Mirae Asset Sekuritas Indonesia 12,800
13,000 13,200 13,400 13,600 13,800 14,000
4,300 4,500 4,700 4,900 5,100 5,300 5,500
11/30 12/28 1/25 2/22
(IDR)
(pt) JCI (L) USD/IDR (R)
-0.4
0.1 0.2
10.9
-0.7
1.4
-2.6
-13.7 -16
-12 -8 -4 0 4 8 12 16
1D 1W 1M 1Y
Absolute Relative (%, %p)
0
-132
-26 -27 -16
155
-100 321
-75 -69
-16 -18
-200 -150 -100 -50 0 50 100 150 200 250 300 350
Korea Taiwan Indonesia Thailand Philippines India
1 Day 5 Days
(USDmn) (USDmn) (USDmn) (USDmn)
80 85 90 95 100 105 110
11/16 12/16 12/16 1/17 1/17 2/17 2/17
CPO WTI Coal
(
( (D-3M=100)
70 75 80 85 90 95 100 105 110
11/16 12/16 12/16 1/17 1/17 2/17 2/17
(D-3M=100) Copper Nickel Tin
( ( ( (
80 85 90 95 100 105 110 115
11/16 12/16 12/16 1/17 1/17 2/17 2/17
Silver Gold Platinum
Table. Key valuation metrics
Company Name Ticker
Price Market Cap Price Performance (%) P/E(X)* P/B(X)* ROE(%)*
(IDR) (IDRbn) 1D 1W 1M 1Y FY16 FY17 FY16 FY17 FY16 FY17
Jakarta Composite Index JCI 5,363 5,881,272 -0.4 0.1 0.7 12.2 15.5 13.6 2.3 2.1 18.0 15.1
FINANCIALS
Bank Central Asia BBCA 15,500 382,153 0.3 0.0 0.5 15.7 17.0 15.0 3.0 2.6 18.9 18.5
Bank Mandiri Persero BMRI 11,350 264,833 0.4 0.4 3.4 20.1 19.6 13.1 1.8 1.6 10.3 13.0
Bank Rakyat Indonesia Persero BBRI 11,950 294,796 0.0 -0.4 0.0 11.7 10.9 10.5 1.9 1.8 20.2 18.6
Bank Negara Indonesia Persero BBNI 6,225 116,088 -0.4 -0.8 4.6 24.7 9.1 8.9 1.2 1.2 13.9 14.4
Bank Tabungan Negara Persero BBTN 2,060 21,815 -3.7 -8.0 9.0 28.8 12.3 10.9 1.2 1.1 10.1 10.6
CONSUMER
HM Sampoerna HMSP 3,850 447,825 -0.5 0.0 -0.3 -13.6 33.9 30.7 12.4 11.4 37.0 38.4
Gudang Garam GGRM 64,625 124,344 -1.9 3.9 3.1 2.3 16.4 14.3 2.8 2.5 17.8 18.0
Indofood CBP Sukses Makmur ICBP 8,275 96,502 -0.6 0.3 -1.8 5.8 24.0 21.5 4.9 4.4 21.5 21.8
Indofood Sukses Makmur INDF 8,000 70,243 -1.5 -1.5 0.9 11.9 15.8 13.9 2.2 2.0 13.8 14.7
Kalbe Farma KLBF 1,495 70,078 -2.3 0.0 0.7 14.6 27.5 24.5 5.2 4.8 20.0 20.4
Unilever Indonesia UNVR 42,175 321,795 0.0 -1.6 2.2 -7.1 44.7 39.5 55.6 51.9 131.0 138.5
AGRICULTURAL
Astra Agro Lestari AALI 15,175 29,207 1.5 2.7 -5.2 6.3 14.8 15.5 1.9 1.7 14.1 11.2
PP London Sumatera Indonesia LSIP 1,520 10,371 3.1 0.7 -3.5 2.7 20.0 13.5 1.6 1.3 7.9 9.7
Sawit Sumbermas Sarana SSMS 1,500 14,288 -1.6 -2.0 -6.3 -25.0 20.4 16.3 3.6 3.1 17.5 18.8
INFRASTRUCTURE
XL Axiata EXCL 2,940 31,423 -1.7 -6.1 3.2 -23.6 60.8 68.8 1.2 1.4 2.1 1.7
Jasa Marga JSMR 4,660 33,822 -2.5 -1.5 9.9 -13.5 15.6 18.2 2.3 2.3 15.7 12.3
Perusahaan Gas Negara PGAS 2,790 67,634 -1.4 3.7 -3.1 7.9 11.6 11.0 1.5 1.3 12.9 12.6
Tower Bersama Infrastructure TBIG 4,950 22,430 -1.0 -6.2 0.2 -12.8 17.1 14.8 7.2 5.2 47.0 39.2
Telekomunikasi Indonesia TLKM 3,850 388,080 0.0 -0.8 -2.3 17.4 16.6 15.1 4.0 3.6 24.1 24.4
Soechi Lines SOCI 276 1,948 3.0 -4.8 -8.0 -42.3 3.4 N/A N/A N/A 11.3 N/A
Garuda Indonesia GIAA 342 8,853 0.0 1.8 1.2 -19.7 20.7 14.7 2.5 2.3 11.8 15.1
BASIC-INDUSTRIES
Semen Indonesia SMGR 9,400 55,756 -2.3 1.9 4.2 -8.3 12.0 14.1 1.9 1.8 16.3 13.2
Charoen Pokphand Indonesia CPIN 3,030 49,686 -2.3 -4.7 -3.8 -11.4 14.6 12.1 2.9 2.5 21.2 21.5
Indocement Tunggal Prakarsa INTP 15,325 56,415 1.2 -2.1 0.2 -23.4 15.4 14.4 2.0 1.9 13.4 13.9
Japfa Comfeed Indonesia JPFA 1,630 18,599 -5.5 -13.1 -6.1 96.4 9.8 7.9 1.9 1.5 21.2 20.4
MINING
Indo Tambangraya Megah ITMG 17,500 19,774 -0.6 7.2 15.3 151.8 10.4 8.6 1.5 1.6 15.0 17.0
Adaro Energy ADRO 1,675 53,576 -1.2 -1.8 -4.3 150.0 11.4 11.4 1.1 1.1 9.4 10.4
Aneka Tambang ANTM 750 18,023 0.7 -4.5 -7.4 105.5 298.3 36.5 1.2 1.0 0.4 2.5
Vale Indonesia INCO 2,510 24,940 -1.6 -6.0 -2.0 56.4 N/A 37.6 1.1 1.0 0.1 2.6
Tambang Batubara Bukit Asam PTBA 11,125 25,633 -0.4 -0.7 -4.9 112.9 9.2 8.8 2.0 1.8 21.5 20.9
TRADE
United Tractors UNTR 23,900 89,150 -3.0 -1.9 7.2 59.1 15.8 15.2 1.9 2.0 12.7 13.5
AKR Corporindo AKRA 6,250 24,949 -1.6 -1.6 -6.0 -21.1 19.5 17.0 3.3 2.9 17.4 17.8
Global Mediacom BMTR 545 7,738 0.9 2.8 -9.2 -38.4 N/A N/A N/A N/A N/A N/A
Matahari Department Store LPPF 11,725 34,213 -14.1 -20.5 -20.6 -33.6 21.9 14.4 23.8 11.9 136.4 95.1
Media Nusantara Citra MNCN 1,660 23,698 0.0 7.4 -2.6 -10.3 12.9 11.4 2.1 1.9 17.2 17.7
Matahari Putra Prima MPPA 1,185 6,373 -1.7 -2.9 -2.9 -34.2 32.8 26.4 2.3 2.1 5.9 7.9
Surya Citra Media SCMA 2,870 41,964 -2.7 -2.0 -1.0 -1.0 23.0 20.0 10.1 8.8 47.0 46.8
Siloam International Hospital SILO 13,300 17,298 0.8 2.3 11.8 69.5 150.3 111.0 6.5 6.3 4.1 5.3
PROPERTY
Bumi Serpong Damai BSDE 1,790 34,452 -2.2 -6.0 -2.5 3.8 14.2 13.0 1.5 1.3 10.6 10.8
Adhi Karya ADHI 2,150 7,656 0.9 -0.5 3.9 -17.9 23.6 12.1 1.4 1.2 5.9 10.7
Alam Sutera Realty ASRI 366 7,192 -1.6 -3.2 -5.2 0.8 8.4 6.2 0.9 0.8 10.9 12.7
Ciputra Development CTRA 1,305 24,221 -4.7 -5.8 -1.1 -0.1 16.5 13.6 1.9 1.7 12.5 12.8
Lippo Karawaci LPKR 710 16,385 -3.4 -7.8 -2.7 -32.4 18.6 14.2 1.4 0.9 3.3 6.6
Pembangunan Perumahan PTPP 3,470 21,514 -0.3 -2.0 -3.6 -0.8 23.1 15.1 2.4 2.1 14.4 17.0
Pakuwon Jati PWON 590 28,414 0.0 -0.8 4.4 26.1 13.8 11.3 2.7 2.2 20.5 20.9
Summarecon Agung SMRA 1,370 19,765 0.0 -3.9 5.4 -14.4 38.8 30.0 3.0 2.8 7.6 9.6
Wijaya Karya WIKA 2,500 22,425 0.0 0.8 -0.8 3.6 14.4 18.3 1.8 1.8 12.9 11.4
Waskita Karya WSKT 2,420 32,848 -2.4 -2.0 -5.5 25.7 17.3 14.8 3.1 2.0 16.6 16.4
MISCELLANEOUS
Astra International ASII 8,325 337,026 1.5 4.4 3.4 18.9 22.1 17.6 3.0 2.8 14.2 15.9
Source: Bloomberg, Mirae Asset Sekuritas Indonesia
Sector performance Top 10 market cap performance
Name Index Chg (%) Ticker Price Market Cap (IDRbn) Chg (%)
Agricultural 1,850.7 0.7 NIKL IJ 2260 5,703 24.86
Mining 1,414.6 -1.1 SIMP IJ 565 8,936 11.88
Basic-Industry 556.8 -0.4 DNET IJ 1575 22,340 8.62
Miscellaneous Industry 1,404.3 1.0 KRAS IJ 730 14,123 6.57
Consumer Goods 2,360.9 -0.6 KAEF IJ 1845 10,247 5.4
Property & Construction 510.8 -1.2 EMTK IJ 9300 52,452 5.08
Infrastructure 1,056.7 -0.4 SDRA IJ 1050 5,326 5.00
Finance 829.7 -0.1 AGRO IJ 1020 15,632 3.55
Trade 854.7 -1.3 INAF IJ 2170 6,725 3.3
Composite 5,363.1 -0.4 TOWR IJ 3650 37,241 3.11
Source: Bloomberg
Top 5 leading movers Top 5 lagging movers
Name Chg (%) Close Name Chg (%) Close
ASII IJ 2.2 8,200 HMSP IJ -2.0 3,870
PPRO IJ 21.5 328 TLKM IJ -0.5 3,850
BMRI IJ 1.1 11,300 INTP IJ -2.9 15,150
EMTK IJ 4.1 8,850 CPIN IJ -3.1 3,100
BBRI IJ 0.6 11,950 SCMA IJ -3.6 2,950
Source: Bloomberg
Economic Calendar
Time Currency Detail Forecast Previous
1:00am USD FOMC Member Kaplan Speaks
2:00am USD Beige Book
3:00am NZD RBNZ Gov Wheeler Speaks
6:00am USD FOMC Member Brainard Speaks
6:50am JPY Monetary Base y/y 23.2% 22.6%
7:30am AUD Building Approvals m/m -0.1% -1.2%
7:30am AUD Trade Balance 3.82B 3.51B
10:45am JPY 10-y Bond Auction 0.09|3.6
1:45pm CHF GDP q/q 0.5% 0.0%
2:00pm EUR German Import Prices m/m 0.5% 1.9%
3:00pm EUR Spanish Unemployment Change 5.2K 57.3K
3:15pm CHF Retail Sales y/y -2.0% -3.5%
4:00pm EUR Italian Monthly Unemployment Rate 12.0% 12.0%
4:30pm GBP Construction PMI 52.2 52.2
5:00pm EUR CPI Flash Estimate y/y 1.8% 1.8%
5:00pm EUR Core CPI Flash Estimate y/y 0.9% 0.9%
5:00pm EUR PPI m/m 0.5% 0.7%
5:00pm EUR Unemployment Rate 9.6% 9.6%
Tentative EUR French 10-y Bond Auction
Tentative EUR Spanish 10-y Bond Auction
7:30pm USD Challenger Job Cuts y/y -38.8%
8:30pm CAD GDP m/m 0.3% 0.4%
8:30pm USD Unemployment Claims 243K 244K
10:30pm USD Natural Gas Storage -5B -89B
Note: Time is based on Indonesian local time Source: Forex Factory
Disclaimers
This report is prepared strictly for private circulation only to clients of PT Mirae Asset Sekuritas Indonesia (MASI). It is purposed only to person having professional experience in matters relating to investments. The information contained in this report has been taken from sources which we deem reliable. No warranty (express or implied) is made to the accuracy or completeness of the information. All opinions and estimates included in this report constitute our judgments as of this date, without regards to its fairness, and are subject to change without notice. However, none of MASI and/or its affiliated companies and/or their respective employees and/or agents makes any representation or warranty (express or implied) or accepts any responsibility or liability as to, or in relation to, the accuracy or completeness of the information and opinions contained in this report or as to any information contained in this report or any other such information or opinions remaining unchanged after the issue thereof. We expressly disclaim any responsibility or liability (express or implied) of MASI, its affiliated companies and their respective employees and agents whatsoever and howsoever arising (including, without limitation for any claims, proceedings, action, suits, losses, expenses, damages or costs) which may be brought against or suffered by any person as a results of acting in reliance upon the whole or any part of the contents of this report and neither MASI, its affiliated companies or their respective employees or agents accepts liability for any errors, omissions or misstatements, negligent or otherwise, in the report and any liability in respect of the report or any inaccuracy therein or omission there from which might otherwise arise is hereby expresses disclaimed.
This document is not an offer to sell or a solicitation to buy any securities. This firms and its affiliates and their officers and employees may have a position, make markets, act as principal or engage in transaction in securities or related investments of any company mentioned herein, may perform services for or solicit business from any company mentioned herein, and may have acted upon or used any of the recommendations herein before they have been provided to you. © PT Mirae Asset Sekuritas Indonesia 2016.