Andy Wibowo Gunawan +62-21-515-1140 [email protected] To subscribe to our Daily Focus, please contact us at [email protected]
Mirae Asset Sekuritas Indonesia
LSIP’s trailing PE band
Source: Bloomberg, Mirae Asset Sekuritas Indonesia Research
March 14, 2017
LSIP: A conservative target
Kami masih mempertahankan target harga saham 12 bulan kedepan kami untuk PP London Sumatera (LSIP pada IDR1.950/saham dan mengulangi rekomendasi Beli kami karena kami tidak merubah estimasi pendapatan LSIP. Meskipun target 2017F laba bersih kami lebih rendah dari laba bersih 2016 setahun penuh, kontraksi pertumbuhan YoY mengalami penurunan, LSIP telah menetapkan target konservatif (5,0% - 10,0% YoY) untuk target produksi 2017F inti awal. Bagaimanapun juga, kami masih memiliki pemikiran positif terhadap perkebunan inti perusahaan yang dapat menghasilkan lebih dari yang ditargetkan kami.
Initial 2017 FFB nucleus production target: +5.0-10.0% YoY
Berdasarkan diskusi kami dengan manajemen, perusahaan menetapkan target awal produksi TBS inti tumbuh maksimal 10.0% YoY di 2017F dan sesuai dengan perkiraan kami yang sebesar 1,3 juta ton.
2017F and 2018F earnings remain unchanged
Secara keseluruhan kami masih mempertahankan perkiraan net profit kami untuk di 2017F dan 2018F yang masing-masing mencapai IDR577,5 miliar dan IDR837,2 miliar. Walaupun secara nominal perkiraan net profit kami mengalami penurunan dibandingkan tahun 2016, tetapi kontraksi mengalami penurunan.
1,000 hectare new planting program to be implemented this year
LSIP berencana melakukan penanaman lahan kelapa sawit baru sebesar 1.000 hektar dan ini merupakan bagian dari strategi pertumbuhan organic perusahaan.
Maintain TP at IDR1,950/share and recommend Buy
Kami masih mempertahankan target harga saham LSIP di IDR1.950/saham karena kami tidak merubah proyeksi keuangan kami.
Market Index
Last Trade Chg (%) MoM YoY
JCI 5,409.4 0.3 0.2 10.5
MSCI Indonesia 24.8 0.6 -1.4 3.1
MSCI EM 938.5 1.3 -0.8 15.3
HANG SENG 23,829.7 1.1 -0.6 15.3
KOSPI 2,117.6 0.4 2.1 7.4
FTSE 7,367.1 0.3 1.0 18.9
DJIA 20,881.5 -0.1 1.9 21.3
NASDAQ 5,875.8 0.2 1.4 23.4
Valuation
2017F P/E (x) P/B (x) ROE (%)
JCI 15.6 2.3 18.1
Key Rates
Last Trade Chg (bps) MoM YoY
BI 7-Day RR 4.75 0 0 -50*
3yr 7.10 -2 0 -38
10yr 7.48 -4 -7 -26
*since introduced in Aug 2016
FX
Last Trade Chg (%) MoM YoY
USD/IDR 13,356.00 -0.1 0.4 2.4
USD/KRW 1,144.28 -1.1 0.6 -3.5
USD/JPY 114.88 0.1 0.5 0.9
USD/CNY 6.91 0.0 0.4 6.3
Commodities
Last Trade Chg (%) MoM YoY
WTI 48.4 -0.2 -9.9 11.1
Gold 1,204.3 0.0 -1.9 -2.5
Coal 81.1 1.1 1.5 57.5
Palm Oil 705.0 0.0 5.0 21.3
Rubber 186.4 0.0 -15.2 66.3
Nickel 9,895.0 -2.5 -7.8 12.1
Copper 5,732.0 0.7 -6.1 15.3
Tin 19,450.0 0.5 -3.2 15.9
JCI Index VS MSCI Emerging Markets
650 800 950 1,100
3,500 4,500 5,500
03/13 03/14 03/15 03/16 03/17
(pt) JCI MSCI EM (pt)
1,100 5,500
(pt) JCI MSCI EM (pt)
2
Mirae Asset Sekuritas Indonesia cartoon
Local flashes
BBCA: 2016, BCA catatkan laba bersih Rp 20,6 triliun. PT Bank Central Asia Tbk berhasil mencatatkan laba bersih Rp 20,6 triliun sepanjang 2016. Itu artinya, laba bersih BCA naik 14,4% secara tahunan atau year on year (yoy). Kenaikan laba bersih ini didorong oleh kenaikan pendapatan bunga bersih sebesar 12% yoy. Kenaikan pendapatan bunga bersih BCA sepanjang 2016 ini melebihi kenaikan beban operasional sebesar 7,7% yoy. Jahja Setiaatmadja Direktur Utama BCA mengatakan kinerja BCA sepanjang 2016 salah satunya didorong oleh langkah efisiensi operasional yang dilakukan. (Kontan)
WTON: Wika Beton bagi dividen Rp81,7 miliar. PT Wika Beton Tbk. akan membagikan dividen tunai kepada pemegang saham senilai Rp81,7 miliar atau sekitar 30% dari laba bersih perseroan sepanjang 2016. Hadian Pramudita, Direktur Utama Wika Beton mengatakan, pada 2016 lalu emiten dengan kode saham WTON tersebut berhasil mencatatkan penjualan Rp3,48 triliun, tumbuh 31,25% dari capaian 2015. Dari capaian tersebut, perseroan berhasil membukukan laba bersih yang dapat diatribusikan pada pemilik entitas induk senilai Rp272,4 miliar. (Bisnis Indonesia)
RALS: Cuaca buruk sebabkan penjualan Ramayana turun 7%. Cuaca buruk yang terjadi sepanjang Februari kemarin memberikan dampak negatif bagi PT Ramayana Lestari Sentosa Tbk (RALS). Penjualan emiten ritel tersebut mengalami penurunan 7%
menjadi sekitar Rp 421 miliar dari sebelumnya sekitar Rp 453 miliar. Akses yang tertutup banjir menghalangi minat beli konsumen dan distribusi barang. (Kontan)
TPIA: Laba bersih Chandra Asri naik tajam. PT Chandra Asri Petrochemical Tbk. atau TPIA mencatatkan pertumbuhan laba yang naik secara drastic year on year pada tahun lalu. Berdasarkan laporan keuangan perusahaan, TPIA mencatatkan laba bersih sebesar US$300,1 juta pada tahun lalu. Dengan kinerja tersebut, TPIA menorehkan pertumbuhan luar biasa, mengingat pada periode tahun sebelumnya, laba bersih US$26,3 juta. (Bisnis Indonesia)
ANTM: Antam bidik produksi feronikel 24.100 Tni. PT Aneka Tambang (persero) Tbk membidik target produksi feronikel tahun 2017 sebanyak 24.100 ton nikel dalam feronikel (Tni). Saat ini, Antam juga telah menyelesaikan penggantian roof electric smelting furnace (ESF)-3 dan optimasi peralatan produksi pabrik FeNi III. Optimasi yang dilakukan Antam, diantaranya mencakup relining rotary kiln,rotary dryer dan modifikasi slag pond untuk pabrik FeNi III yang berlokasi di Pomalaa, Sulawesi Tenggara. (Kontan)
LEAD: Logindo incar US$ 4 juta dari penjualan 14 kapal. Perusahaan pelayaran, PT Logindo Samudramakmur Tbk melego 14 kapalnya. Saat ini, Logindo mencari pembeli, baik dari dalam maupun luar negeri. Pada tahun lalu, LEAD berhasil menjual satu kapal jenis landing craft tank seharga US$ 120.000. Pembeli kapal ini berasal dari luar negeri.
Nah, 14 kapal yang dijajakan Logindo tahun ini, sebelumnya juga sempat dijajakan pada tahun lalu. (Kontan)
ISSP: Steel Pipe terbitkan obligasi US$ 250 juta. PT Steel Pipe Industry of Indonesia Tbk (ISSP) berencana menerbitkan obligasi global senilai US$ 250 juta atau sekitar Rp 3,2 triliun. Notes ini akan diterbitkan dan diperdagangkan di Bursa Efek Singapura (SGX-ST). Nilai obligasi ini lebih dari 124% dari total ekuitas perseroan. Dalam prospektus resmi ISSP yang terbit Senin (13/3), perseroan berencana menggunakan dana penerbitan obligasi itu untuk melunasi kewajiban utang jangka pendek, ekspansi, dan modal kerja. (Kontan)
4
Technical analysis
Tasrul +62-21-515-1140 [email protected] Jakarta Composite Index (JCI) – Limited Upside
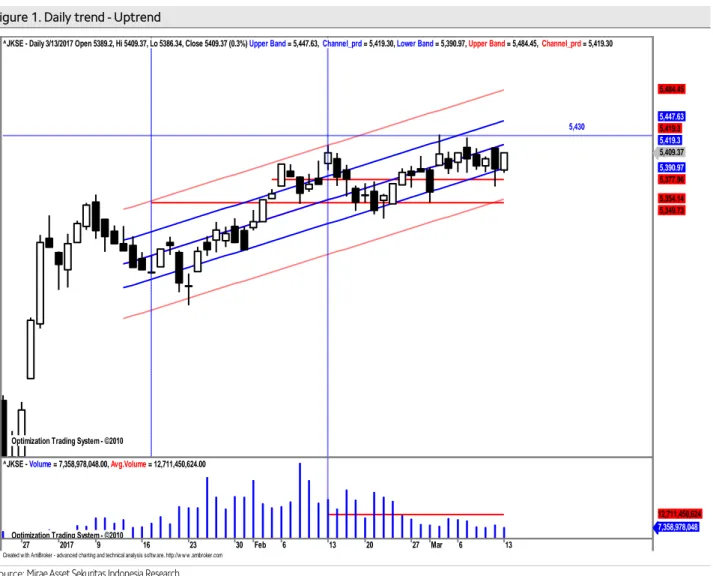
IHSG akan coba naik dan tembus center line pada uptrend channel
IHSG saat masih dalam pola uptrend jangka pendek relatif valid yang dimulai sejak selama 42 hari terakhir dengan r-squared = 0.7585 dan bergerak normal dalam rentang +/-1.19 std.deviasi dari centerline. Peluang IHSG bergerak di luar pergerakan normal sekitar 24.15% atau sekitar 10 bar chart. Volatilitas normal pergerakan IHSG saat ini sebesar +/-0.38% atau sekitar +/- 20.7 point. IHSG akan coba tembus center line sebagaimana terlihat pada Figure 1.
Summary
Item Data Item Data
Close (March 13, 2017) 5,409.37(+0.3%) Trading range 5,378-5,430 Average index performance (%) 0.82 Target
Period 42 - Daily 5,419
r-squared 0.7585 - Weekly 5,432
Volatility (+/-, %) 0.38 - Monthly 5,474 Volatility (+/-, point) 20.7 Stop loss 5,378 Source: Mirae Asset Sekuritas Indonesia Research
Figure 1. Daily trend - Uptrend
Source: Mirae Asset Sekuritas Indonesia Research
Created w ith AmiBroker - advanced charting and technical analysis softw are. http://w w w .amibroker.com Optimization Trading System - ©2010
Optimization Trading System - ©2010 Optimization Trading System - ©2010 Optimization Trading System - ©2010
5,430
^JKSE - Daily 3/13/2017 Open 5389.2, Hi 5409.37, Lo 5386.34, Close 5409.37 (0.3%) Upper Band = 5,447.63, Channel_prd = 5,419.30, Lower Band = 5,390.97, Upper Band = 5,484.45, Channel_prd = 5,419.30
5,409.37 5,390.97 5,377.96 5,354.14 5,349.73 5,419.3 5,419.3 5,447.63 5,484.45
27 2017 9 16 23 30 Feb 6 13 20 27 Mar 6 13
Optimization Trading System - ©2010
^JKSE - Volume = 7,358,978,048.00, Avg.Volume = 12,711,450,624.00
7,358,978,048 12,711,450,624
Aliran dana masuk dan volatilitas indeks naik masih terlihat.
Pada Figure 2, terlihat dari hasil optimalisasi terakhir, indikator MFI optimized dan indikator W%R optimized cenderung naik namun volume masih di bawah rata-rata, dengan demikian potensi kenaikkan masih terlihat namun terbatas . Resistance terdekat di 5,430 dan support di 5,378 yang sekaligus sebagaistop loss level.
Figure 2. Daily MFI optimized & W%R optimized
Source: Mirae Asset Sekuritas Indonesia Research
Created w ith AmiBroker - advanced charting and technical analysis softw are. http://w w w .amibroker.com
^JKSE - MFI Smoothed = 27.10
27.1025
^JKSE - Will%R Smoothed = -41.65
-41.652
Optimization Trading System - ©2010 - Powered by AMTA Optimization Trading System - ©2010 - Powered by AMTA Optimization Trading System - ©2010 - Powered by AMTA
5,430
^JKSE - Daily 3/13/2017 Open 5389.2, Hi 5409.37, Lo 5386.34, Close 5409.37 (0.3%) VWAP = 5,338.08, VWAP = 5,379.45, VWAP = 5,349.73
5,409.37 5,379.45 5,349.73 5,338.08
17 24 31Nov 7 14 21 28 Dec 13 19 27 2017 9 16 23 30 Feb 6 13 20 27 Mar 6 13
Optimization Trading System - ©2010 - Powered by AMTA
^JKSE - Volume = 7,358,978,048.00, Avg.Volume = 12,711,450,624.00
7,358,978,048 12,711,450,624
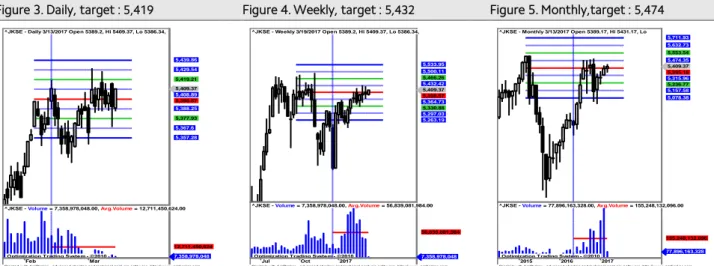
6 IHSG akan coba bertahan sekitar rata-rata masing-masing periode.
Untuk mampu naik lebih lanjut IHSG saat ini harus mampu bertahan minimal sekitar rata-rata masing-masing periode dengan target terdekat berikutnya resistance 2 pada periode masing-masing sebagaimana terlihat pada Figure 3,4 dan 5.
Figure 3. Daily, target : 5,419 Figure 4. Weekly, target : 5,432 Figure 5. Monthly,target : 5,474
x
Source: Mirae Asset Sekuritas Indonesia Research Source: Mirae Asset Sekuritas Indonesia Research Source: Mirae Asset Sekuritas Indonesia Research
Created w ith AmiBroker - advanced charting and technical analysis sof tw are. http://w w w .amibroker.com
^JKSE - Daily 3/13/2017 Open 5389.2, Hi 5409.37, Lo 5386.34,
5,409.37 5,408.89 5,398.57 5,388.25 5,377.93 5,367.6 5,357.28 5,419.21 5,429.54 5,439.86
Feb Mar
Optimization Trading System - ©2010
^JKSE - Volume = 7,358,978,048.00, Avg.Volume = 12,711,450,624.00
7,358,978,048 12,711,450,624
Created w ith AmiBroker - advanced charting and technical analysis sof tw are. http://w w w .amibroker.com
^JKSE - Weekly 3/19/2017 Open 5389.2, Hi 5409.37, Lo 5386.34,
5,409.37 5,398.57 5,364.73 5,330.88 5,297.03 5,263.19 5,432.42 5,466.26 5,500.11 5,533.95
Jul Oct 2017
Optimization Trading System - ©2010
^JKSE - Volume = 7,358,978,048.00, Avg.Volume = 56,839,081,984.00
7,358,978,048 56,839,081,984
Created w ith AmiBroker - advanced charting and technical analysis sof tw are. http://w w w .amibroker.com
^JKSE - Monthly 3/13/2017 Open 5389.17, Hi 5431.17, Lo
5,409.37 5,395.16 5,315.96 5,236.77 5,157.58 5,078.38 5,474.35 5,553.54 5,632.73 5,711.93
2015 2016 2017
Optimization Trading System - ©2010
^JKSE - Volume = 77,896,163,328.00, Avg.Volume = 155,248,132,096.00
77,896,163,328 155,248,132,096
Stocks on our focus list
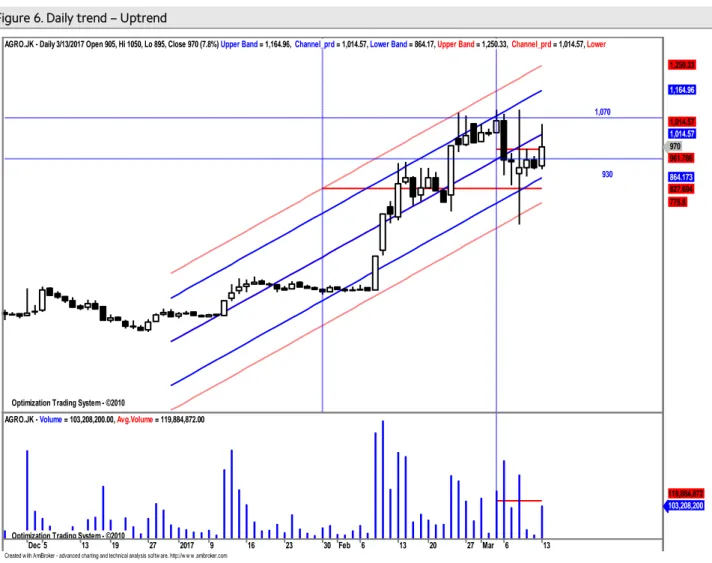
Bank Rakyat Indonesia Agroniaga (AGRO) – Sell on Strength Harga akan coba naik dan tembus center line pada trend channel.
Secara umum harga saham ini masih bergerak pada uptrend channel yang masih relatif valid (r-squared = 0.84) selama 50 hari terakhir yang bergerak normal dalam rentang +/- 1.62 std.deviasi dari center line. Peluang harga keluar dari pergerakan normal sekitar 15.75 % (sekitar 8 bar chart ). Volatilitas normal pergerakkan harga saham ini sepanjang uptrend channel sebesar +/- 5.76 % atau sekitar +/-55.91 (potensi naik dan turun secara normal maksimum/minimum sebesar 55 rupiah) dari level penutupan terakhir. Saat ini harga akan coba naik dan tembus center line pada uptrend channel sebagaimana terlihat pada Figure 6.
Summary
Item Data Item Data
Close (March 13, 2017) 970(+7.8%) Trading range 930-1,070
Relative Avg. Price performance to JCI (%) 27.59 Target
β (beta) 0.72 - Daily 1,010
Corelation 0.76 - Weekly 1,030
Period 50 - Monthly 1,060
r-squared 0.84 Stop loss 780
Volatility (+/-, %) 5.76
Volatility (+/-, Rp.) 55.91
Source: Mirae Asset Sekuritas Indonesia Research
Figure 6. Daily trend – Uptrend
Source: Mirae Asset Sekuritas Indonesia Research
Created w ith AmiBroker - advanced charting and technical analysis softw are. http://w w w .amibroker.com Optimization Trading System - ©2010
Optimization Trading System - ©2010 Optimization Trading System - ©2010 Optimization Trading System - ©2010
1,070
930 AGRO.JK - Daily 3/13/2017 Open 905, Hi 1050, Lo 895, Close 970 (7.8%) Upper Band = 1,164.96, Channel_prd = 1,014.57, Lower Band = 864.17, Upper Band = 1,250.33, Channel_prd = 1,014.57, Lower
970 961.786 864.173 827.694 778.8 1,014.57 1,014.57 1,164.96 1,250.33
Dec 5 13 19 27 2017 9 16 23 30 Feb 6 13 20 27 Mar 6 13
Optimization Trading System - ©2010
AGRO.JK - Volume = 103,208,200.00, Avg.Volume = 119,884,872.00
103,208,200 119,884,872
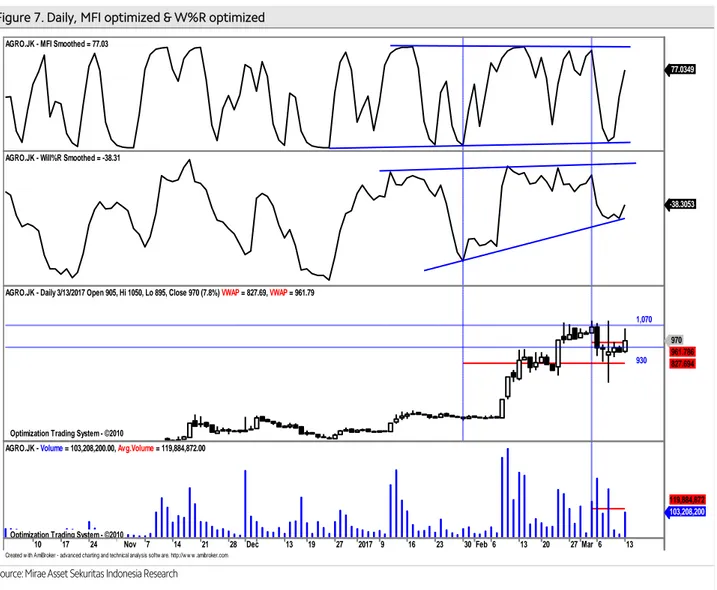
8 Aliran dana masuk dan volatilitas harga naik masih terlihat.
Pada Figure 7, terlihat dari hasil optimalisasi terakhir, indikator MFI Optimized dan indikator W%R optimized cenderung naik dengan volume mendekati rata-rata. Hal ini mengindikasikan potensi kenaikkan masih terlihat namun mulai terbatas. Resistance terdekat di 1,070. Support terdekat di 930 dan stop loss level di 780.
Figure 7. Daily, MFI optimized & W%R optimized
Source: Mirae Asset Sekuritas Indonesia Research
Created w ith AmiBroker - advanced charting and technical analysis softw are. http://w w w .amibroker.com AGRO.JK - MFI Smoothed = 77.03
77.0349
AGRO.JK - Will%R Smoothed = -38.31
-38.3053
Optimization Trading System - ©2010 Optimization Trading System - ©2010
930 1,070 AGRO.JK - Daily 3/13/2017 Open 905, Hi 1050, Lo 895, Close 970 (7.8%) VWAP = 827.69, VWAP = 961.79
970 961.786 827.694
10 17 24 31Nov 7 14 21 28 Dec 13 19 27 2017 9 16 23 30 Feb 6 13 20 27 Mar 6 13
Optimization Trading System - ©2010
AGRO.JK - Volume = 103,208,200.00, Avg.Volume = 119,884,872.00
103,208,200 119,884,872
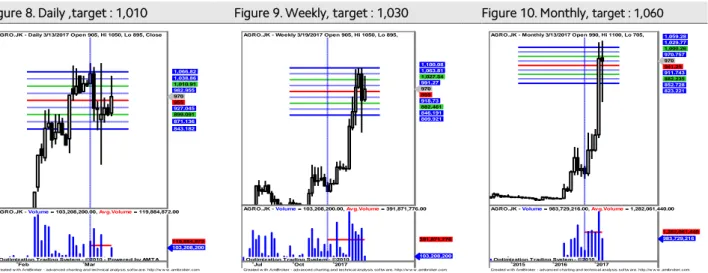
Harga akan coba bertahan diatas rata-rata masing-masing periode.
Untuk naik lebih lanjut harga harus mampu bertahan minimal sekitar rata-rata masing- masing periode dengan target kenaikkan ke resistance 2 pada masing-masing periode sebagaimana terlihat pada Figure 8,9 dan 10.
Figure 8. Daily ,target : 1,010 Figure 9. Weekly, target : 1,030 Figure 10. Monthly, target : 1,060
Source: Mirae Asset Sekuritas Indonesia Research Source: Mirae Asset Sekuritas Indonesia Research Source: Mirae Asset Sekuritas Indonesia Research
Created w ith AmiBroker - advanced charting and technical analysis sof tw are. http://w w w .amibroker.com AGRO.JK - Daily 3/13/2017 Open 905, Hi 1050, Lo 895, Close
970 955 927.045 899.091 871.136 843.182 982.955 1,010.91 1,038.86 1,066.82
Feb Mar
Optimization Trading System - ©2010 - Powered by AMTA AGRO.JK - Volume = 103,208,200.00, Avg.Volume = 119,884,872.00
103,208,200 119,884,872
Created w ith AmiBroker - advanced charting and technical analysis sof tw are. http://w w w .amibroker.com AGRO.JK - Weekly 3/19/2017 Open 905, Hi 1050, Lo 895,
970 955 918.73 882.461 846.191 809.921 991.27 1,027.54 1,063.81 1,100.08
Jul Oct 2017
Optimization Trading System - ©2010
AGRO.JK - Volume = 103,208,200.00, Avg.Volume = 391,871,776.00
103,208,200 391,871,776
Created w ith AmiBroker - advanced charting and technical analysis sof tw are. http://w w w .amibroker.com AGRO.JK - Monthly 3/13/2017 Open 990, Hi 1100, Lo 705,
970 941.25 911.743 882.235 852.728 823.221 970.757 1,000.26 1,029.77 1,059.28
2015 2016 2017
Optimization Trading System - ©2010
AGRO.JK - Volume = 983,729,216.00, Avg.Volume = 1,282,061,440.00
983,729,216 1,282,061,440
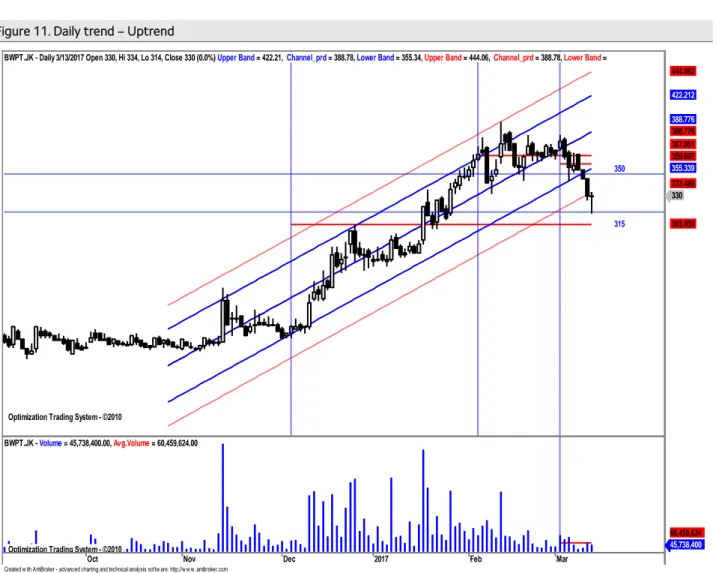
10 Eagle High Plantations (BWPT) – Trading Buy
Harga akan coba naik dan tembus normal lower band pada uptrend channel . Secara umum harga saham ini juga masih bergerak dalam pola uptrend channel yang masih relatif valid (r-squared = 0,91) selama 94 hari terakhir dan bergerak normal dalam rentang +/- 1.71 std.deviasi dari center line. Peluang harga keluar dari pergerakan normal sekitar 8.74 % (sekitar 8 bar chart ). Volatilitas normal pergerakan harga saham ini sepanjang uptrend channel sebesar +/ 3.40 % atau sekitar +/- 11.23 (potensi naik dan turun secara normal maksimum/minimum sebesar 11-12 rupiah) dari level penutupan terakhir. Saat ini harga akan coba naik dan tembus normal lower band pada uptrend channnel sebagaimana terlihat pada Figure 11.
Summary
Item Data Item Data
Close (March 13, 2017) 330(+0.0%) Trading range 315-350 Relative Avg. Price performance to JCI (%) (2.59) Target
β (beta) 2.50 - Daily 338
Corelation 0.75 - Weekly 348
Period 94 - Monthly 394
r-squared 0.91 Stop loss 304
Volatility (+/-, %) 3.40
Volatility (+/-, Rp.) 11.23
Source: Mirae Asset Sekuritas Indonesia Research
Figure 11. Daily trend – Uptrend
Source: Mirae Asset Sekuritas Indonesia Research
Created w ith AmiBroker - advanced charting and technical analysis softw are. http://w w w .amibroker.com Optimization Trading System - ©2010
Optimization Trading System - ©2010 Optimization Trading System - ©2010 Optimization Trading System - ©2010 Optimization Trading System - ©2010
315 350 BWPT.JK - Daily 3/13/2017 Open 330, Hi 334, Lo 314, Close 330 (0.0%) Upper Band = 422.21, Channel_prd = 388.78, Lower Band = 355.34, Upper Band = 444.06, Channel_prd = 388.78, Lower Band =
330
303.939 333.489 355.339 359.607 367.051 388.776 388.776 422.212 444.062
Oct Nov Dec 2017 Feb Mar
Optimization Trading System - ©2010
BWPT.JK - Volume = 45,738,400.00, Avg.Volume = 60,459,624.00
45,738,400 60,459,624
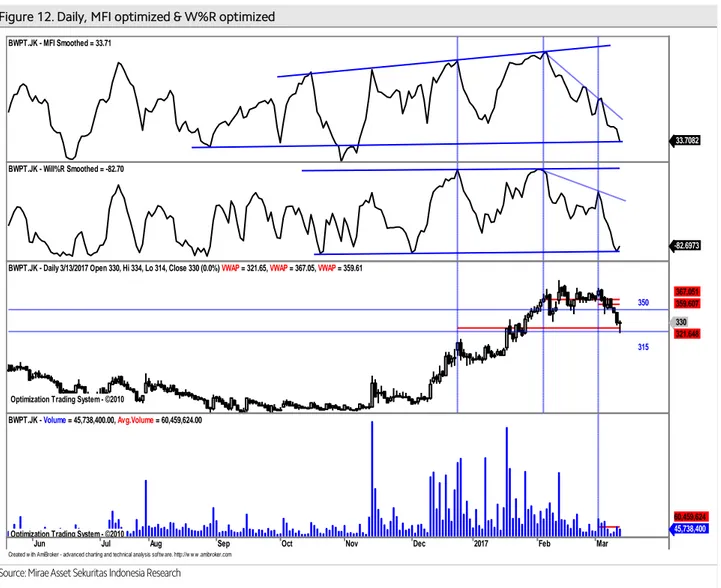
Aliran dana naik dan volatilitas harga naik mulai terlihat.
Pada Figure 12, terlihat dari hasil optimalisasi indikator MFI Optimized akan menguji support trend line dan indikator W%R Optimized masih cenderung naik namun volume masih di bawah rata-rata. Hal ini mengindikasikan potensi kenaikkan masih terlihat.
Resistance berikutnya di 350. Support saat ini di 315. Stop loss level di 304.
Figure 12. Daily, MFI optimized & W%R optimized
Source: Mirae Asset Sekuritas Indonesia Research
Created w ith AmiBroker - advanced charting and technical analysis softw are. http://w w w .amibroker.com BWPT.JK - MFI Smoothed = 33.71
33.7082
BWPT.JK - Will%R Smoothed = -82.70
-82.6973
Optimization Trading System - ©2010 Optimization Trading System - ©2010 Optimization Trading System - ©2010
350
315 BWPT.JK - Daily 3/13/2017 Open 330, Hi 334, Lo 314, Close 330 (0.0%) VWAP = 321.65, VWAP = 367.05, VWAP = 359.61
330 321.648 359.607 367.051
Jun Jul Aug Sep Oct Nov Dec 2017 Feb Mar
Optimization Trading System - ©2010
BWPT.JK - Volume = 45,738,400.00, Avg.Volume = 60,459,624.00
45,738,400 60,459,624
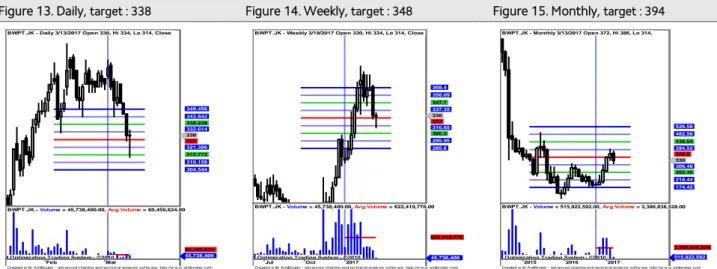
12 Harga akan coba bertahan minimal sekitar rata-rata pada masing-masing periode.
Untuk naik lebih lanjut harga harus mampu bertahan sekitar rata-rata masing-masing periode dengan target berikutnya tembus resistance 2 sebagaimana terlihat pada Figure 14,15 dan 16.
Figure 13. Daily, target : 338 Figure 14. Weekly, target : 348 Figure 15. Monthly, target : 394 x
Source: Mirae Asset Sekuritas Indonesia Research Source: Mirae Asset Sekuritas Indonesia Research Source: Mirae Asset Sekuritas Indonesia Research
Created w ith AmiBroker - advanced charting and technical analysis sof tw are. http://w w w .amibroker.com BWPT.JK - Daily 3/13/2017 Open 330, Hi 334, Lo 314, Close
330 327 321.386 315.772 310.158 304.544 332.614 338.228 343.842 349.456
Feb Mar
Optimization Trading System - ©2010
BWPT.JK - Volume = 45,738,400.00, Avg.Volume = 60,459,624.00
45,738,400 60,459,624
Created w ith AmiBroker - advanced charting and technical analysis sof tw are. http://w w w .amibroker.com BWPT.JK - Weekly 3/19/2017 Open 330, Hi 334, Lo 314, Close
330 327 316.65 306.3 295.95 285.6 337.35 347.7 358.05 368.4
Jul Oct 2017
Optimization Trading System - ©2010
BWPT.JK - Volume = 45,738,400.00, Avg.Volume = 622,419,776.00
45,738,400 622,419,776
Created w ith AmiBroker - advanced charting and technical analysis sof tw are. http://w w w .amibroker.com BWPT.JK - Monthly 3/13/2017 Open 372, Hi 386, Lo 314,
330 306.48 262.46 218.44 174.42 350.5 394.52 438.54 482.56 526.58
2015 2016 2017
Optimization Trading System - ©2010
BWPT.JK - Volume = 515,922,592.00, Avg.Volume = 2,386,838,528.00
515,922,592 2,386,838,528
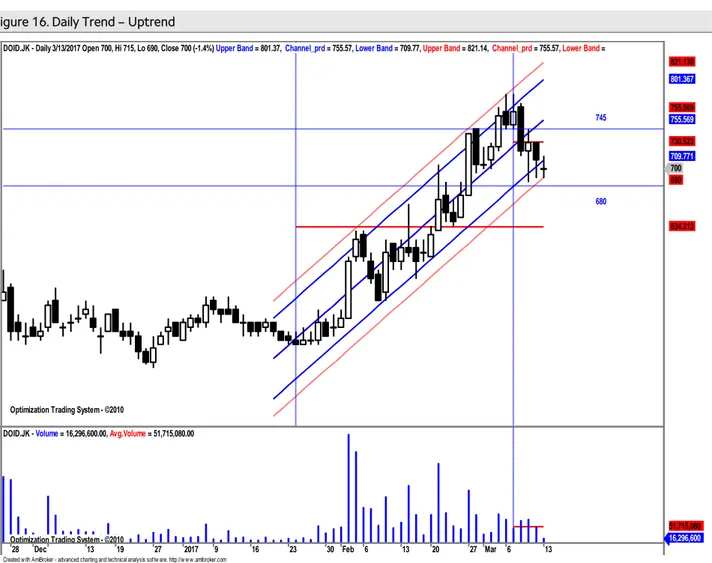
Delta Dunia Makmur (DOID) – Trading Buy
Harga akan coba naik dari normal lower band pada uptrend channel.
Secara umum harga saham ini akan coba naik dari normal lower band pada uptrend channel yang masih relatif valid dengan r-squared = 0.90 selama 37 hari terakhir dan bergerak normal dalam rentang +/-1.63 std.deviasi dari centerline. Peluang harga keluar dari pergerakan normalnya sekitar 10.33 % (sekitar 4 bar chart ). Volatilitas normal pergerakan harga saham ini sepanjang uptrend channel sebesar +/- 3.15 % atau sekitar +/- 22.03 (potensi naik dan turun secara normal maksimum/minimum sebesar 22 rupiah) dari level penutupan terakhir sebagaimana terlihat pada Figure 16.
Summary
Item Data Item Data
Close (March 13, 2017) 700 (-1,4%) Trading range 690-745
Relative Avg. Price performance to JCI (%) 11.17 Target
β (beta) 1.88 - Daily 725
Corelation 0.84 - Weekly 740
Period 37 - Monthly 760
r-squared 0.90 Stop loss 680
Volatility (+/-, %) 3.15
Volatility (+/-, Rp.) 22.03
Source: Mirae Asset Sekuritas Indonesia Research
Figure 16. Daily Trend – Uptrend
Source: Mirae Asset Sekuritas Indonesia Research
Created w ith AmiBroker - advanced charting and technical analysis softw are. http://w w w .amibroker.com Optimization Trading System - ©2010
Optimization Trading System - ©2010 Optimization Trading System - ©2010 Optimization Trading System - ©2010
680 745 DOID.JK - Daily 3/13/2017 Open 700, Hi 715, Lo 690, Close 700 (-1.4%) Upper Band = 801.37, Channel_prd = 755.57, Lower Band = 709.77, Upper Band = 821.14, Channel_prd = 755.57, Lower Band =
700 690
634.213 709.771 730.523 755.569 755.569 801.367 821.138
28 Dec 13 19 27 2017 9 16 23 30 Feb 6 13 20 27 Mar 6 13
Optimization Trading System - ©2010
DOID.JK - Volume = 16,296,600.00, Avg.Volume = 51,715,080.00
16,296,600 51,715,080
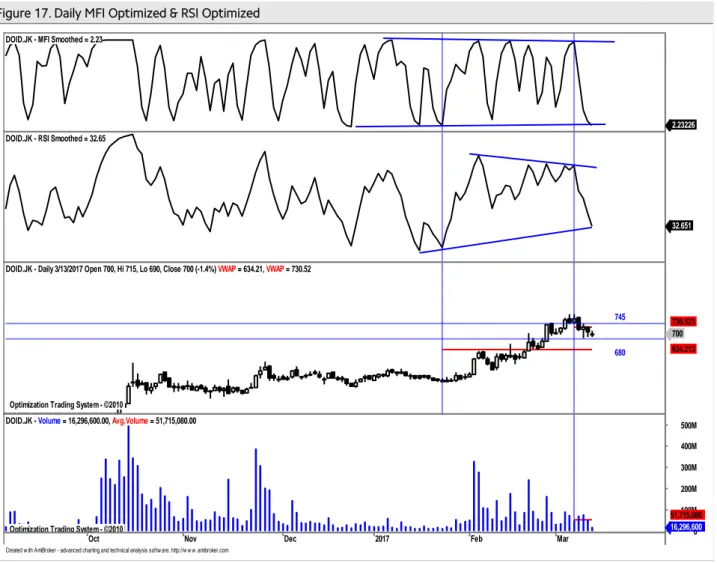
14 Aliran dana keluar dan volatilitas harga turun mulai tertahan.
Pada Figure 17, terlihat dari hasil optimalisasi, indikator MFI Optimized dan indikator RSI Optimized akan menguji support trend line dengan volume di bawah rata-rata. Dengan demikian diperkirakan potensi koreksi sudah terbatas. Perkiraan resistance terdekat ke 745. Support terdekat di 690.Stop loss level di 680.
Figure 17. Daily MFI Optimized & RSI Optimized
Source: Mirae Asset Sekuritas Indonesia Research
Created w ith AmiBroker - advanced charting and technical analysis softw are. http://w w w .amibroker.com DOID.JK - MFI Smoothed = 2.23
2.23226 DOID.JK - RSI Smoothed = 32.65
32.651
Optimization Trading System - ©2010 Optimization Trading System - ©2010
680 745 DOID.JK - Daily 3/13/2017 Open 700, Hi 715, Lo 690, Close 700 (-1.4%) VWAP = 634.21, VWAP = 730.52
700 634.213 730.523
Oct Nov Dec 2017 Feb Mar 0
100M 200M 300M 400M 500M
Optimization Trading System - ©2010
DOID.JK - Volume = 16,296,600.00, Avg.Volume = 51,715,080.00
16,296,600 51,715,080
Harga akan coba naik mendekti resistance 2 pada masing-masing periode.
Untuk naik lebih lanjut harga harus mampu bertahan sekitar rata-rata masing-masing periode dengan target terdekat berikutnya minimal ke resistance 2 sebagaimana terlihat pada Figure 18,19 dan 20.
Figure 18. Daily, target : 725 Figure 19. Weekly, target : 740 Figure 20. Monthly, target : 760
Source: Mirae Asset Sekuritas Indonesia Research Source: Mirae Asset Sekuritas Indonesia Research Source: Mirae Asset Sekuritas Indonesia Research
analyzed by : Tasrul, [email protected], +62-21- 5151140
Relative Avg.Price Performance to JCI (%) : Persentase kenaikan harga saham dari rata-rata sejak IHSG memulai uptrend-nya β (beta) : Indikator sensitivitas harga saham terhadap IHSG, beta diatas 1 berarti harga makin sensitif terhadap pergerakan IHSG dan sebaliknya
Correlation : Ukuran kuat hubungan (korelasi) pergerakan harga saham dibanding dengan pergerakan IHSG
Period : Periode uptrend / downtrend yang valid dari pergerakan harga saham
r-squared : Koefisien determinasi, menunjukkan persentase gerakan yang dapat dijelaskan dengan regresi linier.Nilai R2 terletak antara 0 – 1, dan kecocokan model dikatakan lebih baik kalau R2 semakin mendekati 1 (validitas uptrend atau downtrend makin valid) Volatility (+/-%) : Besaran volatilitas normal maksimal/minimal dari pergerakan harga harian selama harga saham bergerak normal pada trend channel dalam persentase.
Volatility (+/- point or Rp) : Besaran volatilitas normal maksimal/minimal dari pergerakan harga harian selama Harga saham bergerak
Buy: : Beli, harga sudah menyentuh atau jatuh di bawah support dan indikator teknikal berada di oversold area.
Sell: : Jual, harga sudah menyentuh atau tembus resistance normal dan indikator berada di overbought area.
BoW: : Buy on Weakness, beli ketika harga sudah melemah, dimana Volume tekanan jual mulai berkurang dan harga mendekati support, serta indikator teknikal sudah berada di oversold area.
SoS: : Sell on Strength, jual ketika kenaikan harga sudah mulai terbatas dimana volume beli mulai berkurang dan harga mendekati resistance, serta indikator teknikal sudah berada di overbought area.
Trading Buy: : Beli dan jual kembali secepatnya jika harga sudah mencapai level resistance terdekat, karena kenaikan harga relatif tidak stabil atau hanya sementara.
Trading Sell : Jual dan beli kembali secepatnya jika harga sudah mencapai level support terdekat karena koreksi harga relative tidak stabil atau hanya sementara.
Created w ith AmiBroker - advanced charting and technical analysis sof tw are. http://w w w .amibroker.com DOID.JK - Daily 3/13/2017 Open 700, Hi 715, Lo 690, Close
700 690.234 679.218 668.202 657.185 701.25 712.266 723.282 734.298 745.315
Feb Mar
Optimization Trading System - ©2010
DOID.JK - Volume = 16,296,600.00, Avg.Volume = 51,715,080.00
16,296,600 51,715,080
Created w ith AmiBroker - advanced charting and technical analysis sof tw are. http://w w w .amibroker.com DOID.JK - Weekly 3/19/2017 Open 700, Hi 715, Lo 690, Close
700 680.393 659.535 638.678 617.82 701.25 722.107 742.965 763.822 784.68
Jul Oct 2017
Optimization Trading System - ©2010
DOID.JK - Volume = 16,296,600.00, Avg.Volume = 362,801,408.00
16,296,600 362,801,408
Created w ith AmiBroker - advanced charting and technical analysis sof tw are. http://w w w .amibroker.com DOID.JK - Monthly 3/13/2017 Open 705, Hi 785, Lo 685, Close
700 681.125 643.499 605.874 568.249 718.75 756.375 794.001 831.626 869.251
2015 2016 2017
Optimization Trading System - ©2010
DOID.JK - Volume = 485,738,048.00, Avg.Volume = 1,753,355,264.00
485,738,048 1,753,355,264
16
Chart 21. JCI Vs. USD/IDR Chart 22. JCI performance (absolute vs. relative)
Source: Bloomberg, Mirae Asset Sekuritas Indonesia Note: Relative to MSCI EM Index
Source: Bloomberg, Mirae Asset Sekuritas Indonesia
Chart 23. Foreigner’s net purchase (EM) Chart 24. Energy price
Note: The latest figure for India are March 9th, 2017
Source: Bloomberg, Mirae Asset Sekuritas Indonesia Source: Bloomberg, Mirae Asset Sekuritas Indonesia
Chart 25. Non-ferrous metal price Chart 26. Precious metal price
Source: Bloomberg, Mirae Asset Sekuritas Indonesia Source: Bloomberg, Mirae Asset Sekuritas Indonesia 12,800
13,000 13,200 13,400 13,600 13,800 14,000
4,300 4,500 4,700 4,900 5,100 5,300 5,500
12/12 1/9 2/6 3/6
(IDR)
(pt) JCI (L) USD/IDR (R)
0.3
0.0
0.5
10.9
-1.0 -0.2
0.1
-5.9 -8
-4 0 4 8 12
1D 1W 1M 1Y
Absolute Relative (%, %p)
43
194
30 7
-6
290 1,133
-245 68
-132 -22
1,299
-400 -200 0 200 400 600 800 1,000 1,200 1,400
Korea Taiwan Indonesia Thailand Philippines India
1 Day 5 Days
(USDmn) (USDmn) (USDmn) (USDmn)
80 85 90 95 100 105 110
12/16 12/16 1/17 1/17 2/17 2/17 3/17
CPO WTI Coal
(
( (D-3M=100)
70 75 80 85 90 95 100 105 110
12/16 12/16 1/17 1/17 2/17 2/17 3/17
(D-3M=100) Copper Nickel Tin
( ( ( (
80 85 90 95 100 105 110 115
12/16 12/16 1/17 1/17 2/17 2/17 3/17
Silver Gold Platinum
Table. Key valuation metrics
Company Name Ticker
Price Market Cap Price Performance (%) P/E(X)* P/B(X)* ROE(%)*
(IDR) (IDRbn) 1D 1W 1M 1Y FY16 FY17 FY16 FY17 FY16 FY17
Jakarta Composite Index JCI 5,409 5,884,021 0.3 0.0 0.0 12.4 15.6 13.6 2.3 2.1 18.1 14.6
FINANCIALS
Bank Central Asia BBCA 15,550 383,385 -0.5 0.5 0.2 15.6 17.2 15.1 3.0 2.6 18.9 18.5
Bank Mandiri Persero BMRI 11,400 266,000 0.0 0.9 -0.4 12.3 19.6 13.2 1.8 1.6 10.3 12.7
Bank Rakyat Indonesia Persero BBRI 12,075 297,880 0.0 1.0 0.0 8.5 10.9 10.7 1.9 1.8 20.2 18.4
Bank Negara Indonesia Persero BBNI 6,350 118,419 0.8 0.8 0.8 18.7 9.1 9.0 1.2 1.2 13.9 14.5
Bank Tabungan Negara Persero BBTN 2,120 22,451 -0.9 2.4 8.2 24.7 13.3 12.1 1.0 1.2 7.6 10.0
CONSUMER
HM Sampoerna HMSP 4,030 468,762 1.0 2.0 3.6 -0.7 34.8 35.1 13.0 13.1 38.6 37.5
Gudang Garam GGRM 63,000 121,218 -0.8 -0.6 1.6 -3.1 15.9 14.0 2.7 2.4 17.8 18.0
Indofood CBP Sukses Makmur ICBP 8,325 97,085 2.1 0.3 -2.1 8.1 24.1 21.6 5.0 4.5 21.5 21.8
Indofood Sukses Makmur INDF 7,950 69,804 0.3 -1.5 -0.6 8.9 15.7 13.9 2.1 2.0 13.7 14.7
Kalbe Farma KLBF 1,485 69,610 1.0 -2.6 -0.7 14.2 27.3 24.4 5.2 4.7 20.0 20.5
Unilever Indonesia UNVR 42,400 323,512 0.2 0.1 -0.1 -1.4 44.6 39.6 56.1 52.2 131.9 139.0
AGRICULTURAL
Astra Agro Lestari AALI 15,025 28,918 -1.2 -1.8 -3.8 -7.5 14.8 15.3 1.9 1.7 14.1 11.0
PP London Sumatera Indonesia LSIP 1,485 10,132 1.0 -1.7 -5.4 -13.2 20.0 13.2 1.6 1.2 7.9 9.7
Sawit Sumbermas Sarana SSMS 1,480 14,097 0.0 7.2 -10.3 -26.4 20.1 16.1 3.5 3.0 17.5 18.8
INFRASTRUCTURE
XL Axiata EXCL 3,000 32,064 0.7 3.4 -1.3 -25.6 60.8 70.2 1.2 1.5 2.1 1.7
Jasa Marga JSMR 4,510 32,733 1.6 -1.5 -5.8 -15.1 15.6 17.7 2.3 2.2 15.7 12.3
Perusahaan Gas Negara PGAS 2,730 66,179 0.7 -3.5 -4.9 4.8 11.4 10.8 1.4 1.3 12.7 12.4
Tower Bersama Infrastructure TBIG 5,125 23,223 1.5 3.1 -1.4 -13.9 17.7 15.3 7.4 5.3 47.0 39.2
Telekomunikasi Indonesia TLKM 3,950 398,160 0.0 0.8 0.8 17.4 20.3 17.3 4.7 4.1 24.3 23.8
Soechi Lines SOCI 272 1,920 -1.4 -6.2 -9.9 -43.5 3.4 N/A N/A N/A 11.3 N/A
Garuda Indonesia GIAA 340 8,801 -0.6 -0.6 -4.5 -21.1 20.7 14.7 2.5 2.3 11.7 15.1
BASIC-INDUSTRIES
Semen Indonesia SMGR 9,400 55,756 -0.3 -1.1 -4.3 -10.9 12.0 14.3 1.9 1.8 16.3 13.1
Charoen Pokphand Indonesia CPIN 3,200 52,474 1.6 2.2 -9.3 -3.6 15.4 12.8 3.1 2.6 21.2 21.5
Indocement Tunggal Prakarsa INTP 15,500 57,059 0.2 0.2 -2.8 -24.4 15.6 14.6 2.0 1.9 13.4 13.9
Japfa Comfeed Indonesia JPFA 1,595 18,200 -0.9 -7.3 -14.9 104.5 7.7 9.8 1.9 1.8 28.6 20.1
MINING
Indo Tambangraya Megah ITMG 16,300 18,418 0.0 -4.5 8.5 143.3 10.4 7.7 1.5 1.4 15.0 18.1
Adaro Energy ADRO 1,625 51,977 1.6 -3.6 -3.3 124.1 12.0 10.1 1.3 1.1 11.1 10.3
Aneka Tambang ANTM 725 17,422 -0.7 -4.6 -10.5 62.9 298.3 35.3 1.2 1.0 0.4 2.5
Vale Indonesia INCO 2,320 23,052 0.0 -9.0 -17.4 24.1 N/A 34.8 1.1 0.9 0.1 2.5
Tambang Batubara Bukit Asam PTBA 10,400 23,963 0.2 -3.3 -6.1 65.1 8.5 8.3 1.9 1.7 21.7 20.7
TRADE
United Tractors UNTR 25,400 94,745 -1.4 -3.1 8.9 66.0 15.8 15.1 1.9 2.1 12.7 14.3
AKR Corporindo AKRA 6,275 25,048 2.4 -0.8 -5.6 -20.1 23.5 19.7 3.5 3.3 15.7 16.9
Global Mediacom BMTR 520 7,383 -1.9 -2.8 -15.4 -41.9 N/A N/A N/A N/A N/A N/A
Matahari Department Store LPPF 13,050 38,079 -1.1 -0.2 -13.9 -27.3 21.9 16.7 23.8 13.7 136.4 91.8
Media Nusantara Citra MNCN 1,750 24,983 0.9 6.1 2.9 -7.9 13.8 12.2 2.2 2.1 16.8 17.4
Matahari Putra Prima MPPA 1,165 6,265 -2.1 -2.9 -12.1 -33.8 32.2 26.0 2.2 2.1 5.9 7.9
Surya Citra Media SCMA 2,770 40,502 2.2 1.1 -5.1 -4.5 22.2 19.4 9.8 8.4 46.6 46.0
Siloam International Hospital SILO 13,300 17,298 1.5 3.9 -5.0 68.9 150.3 115.4 4.5 6.1 3.5 4.8
PROPERTY
Bumi Serpong Damai BSDE 1,730 33,297 -1.7 -2.0 -9.2 1.5 13.7 12.6 1.4 1.3 10.6 10.8
Adhi Karya ADHI 2,310 8,226 2.7 -2.9 7.9 -14.8 23.6 13.6 1.4 1.3 5.9 10.5
Alam Sutera Realty ASRI 366 7,192 0.0 -0.5 -6.6 0.8 8.4 6.2 0.9 0.8 10.9 12.7
Ciputra Development CTRA 1,265 23,479 0.8 -2.3 -11.5 -2.5 16.0 13.2 1.8 1.7 12.5 12.8
Lippo Karawaci LPKR 725 16,731 0.0 -0.7 -3.3 -31.3 18.6 14.4 0.9 0.9 5.0 6.5
Pembangunan Perumahan PTPP 3,410 21,142 0.9 -3.9 -7.6 -8.8 23.1 15.0 2.4 2.0 14.4 16.3
Pakuwon Jati PWON 570 27,451 -1.7 2.7 0.0 14.0 13.5 11.1 2.6 2.2 20.3 20.5
Summarecon Agung SMRA 1,355 19,548 -0.4 -3.2 -6.6 -15.0 38.4 29.7 2.9 2.7 7.6 9.6
Wijaya Karya WIKA 2,470 22,156 0.0 -0.8 -2.0 4.6 14.4 18.2 1.8 1.8 12.9 11.0
Waskita Karya WSKT 2,380 32,305 -0.4 -2.5 -7.4 23.3 17.3 14.0 3.1 2.0 16.6 16.6
MISCELLANEOUS
Astra International ASII 8,250 333,989 1.2 -3.5 1.9 17.0 22.1 17.2 3.0 2.7 14.2 16.1
Source: Bloomberg, Mirae Asset Sekuritas Indonesia
18
Sector performance Top 10 market cap performance
Name Index Chg (%) Ticker Price Market Cap (IDRbn) Chg (%)
Agricultural 1,836.5 0.6 BTEK IJ 1125 6,529 11.39
Mining 1,371.3 0.5 BNLI IJ 740 16,532 8.82
Basic-Industry 569.7 1.0 BUMI IJ 322 11,794 8.05
Miscellaneous Industry 1,394.6 1.0 SMBR IJ 2700 26,562 8.00
Consumer Goods 2,400.6 0.4 AGRO IJ 970 14,866 7.8
Property & Construction 499.7 -0.3 BRPT IJ 2650 18,497 6.00
Infrastructure 1,072.7 0.2 DNET IJ 1910 27,091 5.82
Finance 836.8 0.1 NIKL IJ 2010 5,072 4.69
Trade 877.4 0.4 BCAP IJ 1550 8,483 3.7
Composite 5,409.4 0.3 BSIM IJ 860 13,072 3.61
Source: Bloomberg
Top 5 leading movers Top 5 lagging movers
Name Chg (%) Close Name Chg (%) Close
HMSP IJ 1.0 4,030 BBCA IJ -0.5 15,550
ASII IJ 1.2 8,250 MYOR IJ -3.2 2,130
ICBP IJ 2.2 8,325 UNTR IJ -1.4 25,400
SMBR IJ 8.0 2,700 GGRM IJ -0.8 63,000
RIMO IJ 34.3 184 BDMN IJ -1.7 4,770
Source: Bloomberg
Economic Calendar
Time Currency Detail Forecast Previous
7:30am AUD NAB Business Confidence 10
9:00am CNY Industrial Production y/y 6.2% 6.0%
9:00am CNY Fixed Asset Investment ytd/y 8.2% 8.1%
9:00am CNY Retail Sales y/y 10.5% 10.9%
2:00pm EUR German Final CPI m/m 0.6% 0.6%
5:00pm EUR German ZEW Economic Sentiment 13.2 10.4
5:00pm EUR Industrial Production m/m 1.2% -1.6%
5:00pm EUR ZEW Economic Sentiment 19.3 17.1
5:00pm USD NFIB Small Business Index 106.1 105.9
Tentative GBP 10-y Bond Auction 1.18|2.3
7:30pm USD PPI m/m 0.1% 0.6%
7:30pm USD Core PPI m/m 0.2% 0.4%
8:30pm GBP CB Leading Index m/m 0.0%
Note: Time is based on Indonesian local time Source: Forex Factory
Disclaimers
This report is prepared strictly for private circulation only to clients of PT Mirae Asset Sekuritas Indonesia (MASI). It is purposed only to person having professional experience in matters relating to investments. The information contained in this report has been taken from sources which we deem reliable. No warranty (express or implied) is made to the accuracy or completeness of the information. All opinions and estimates included in this report constitute our judgments as of this date, without regards to its fairness, and are subject to change without notice. However, none of MASI and/or its affiliated companies and/or their respective employees and/or agents makes any representation or warranty (express or implied) or accepts any responsibility or liability as to, or in relation to, the accuracy or completeness of the information and opinions contained in this report or as to any information contained in this report or any other such information or opinions remaining unchanged after the issue thereof. We expressly disclaim any responsibility or liability (express or implied) of MASI, its affiliated companies and their respective employees and agents whatsoever and howsoever arising (including, without limitation for any claims, proceedings, action, suits, losses, expenses, damages or costs) which may be brought against or suffered by any person as a results of acting in reliance upon the whole or any part of the contents of this report and neither MASI, its affiliated companies or their respective employees or agents accepts liability for any errors, omissions or misstatements, negligent or otherwise, in the report and any liability in respect of the report or any inaccuracy therein or omission there from which might otherwise arise is hereby expresses disclaimed.
This document is not an offer to sell or a solicitation to buy any securities. This firms and its affiliates and their officers and employees may have a position, make markets, act as principal or engage in transaction in securities or related investments of any company mentioned herein, may perform services for or solicit business from any company mentioned herein, and may have acted upon or used any of the recommendations herein before they have been provided to you. © PT Mirae Asset Sekuritas Indonesia 2016.