Franky Rivan +62-21-515-1140 [email protected] To subscribe to our Daily Focus, please contact us at [email protected]
Mirae Asset Sekuritas Indonesia
Mortgage loan trend and NPL rate
Source: : OJK, Mirae Asset Sekuritas Indonesia Research
March 6, 2017
Developers 4Q16 preview: Earnings to meet our estimates Unfavorable property market haunted marketing sales
Kami mengumpulkan data marketing sales developer di bawah coverage kami, yaitu BSDE, SMRA, PWON, dan LPKR untuk melihat kekuatan permintaan pasar properti.
Marketing sales FY16 masih cukup mengecewakan karena hanya sebesar 65,2% dari target setahun penuh perusahaan secara kumulatif, dan turun 28,6% YoY. Secara kuartalan, kami juga lihat adanya pelemahan marketing sales, dengan turun 17%
YoY secara kumulatif.
Oasis: Improved revenue recognition
Namun, di sisi positifnya, kami yakin kondisi moneter dan fiskal yang lebih baik terhadap pasar properti telah sedikit memperbaiki kondisi pasar. Data KPR terbaru dari OJK menunjukkan data yang menggembirakan karena rasio NPL KPR turun menjadi 2,45% per Desember 2016 (vs 2,84% puncaknya di Mei 2016). Angka cash conversion cycle paling baru yang dikeluarkan LPKR juga menunjukkan peningkatan, sebesar 1.410 hari (vs 1.536 hari di 2015), yang kami percaya akan membuat pengakuan pendapatan yang lebih baik untuk developer properti. Karena itu, kami percaya pengakuan pendapatan yang lebih baik dapat memulihkan pendapatan developer di 4Q16, yang mengimbangi pelemahan marketing sales di 4Q16.
Earnings to meet our estimates
Factoring-in hal yang kami sebutkan di atas, kami optimis bahwa earnings 4Q16 developer akan sesuai estimasi kami, sesuai dengan view Neutral kami di sektor ini.
Developer yang telah merilis laporan keuangannya yaitu LPKR sangat sesuai dengan estimasi kami, dengan memenuhi 102,4% (pendapatannya) dan 99,8% (laba bersihnya) terhadap estimasi setahun penuh kami. Karena itu, kami lihat sedikit kemungkinan akan adanya potensi upside/downside untuk harga saham developer yang disebabkan oleh rilis laporan keuangan 4Q16 nya.
Market Index
Last Trade Chg (%) MoM YoY
JCI 5,391.2 -0.3 0.2 11.5
MSCI Indonesia 24.7 0.8 -1.8 2.7
MSCI EM 931.1 -0.6 1.4 18.4
HANG SENG 23,552.7 -0.7 1.6 17.6
KOSPI 2,078.8 -0.4 0.1 6.3
FTSE 7,374.3 -0.1 2.9 19.1
DJIA 21,005.7 0.0 4.7 23.5
NASDAQ 5,870.8 0.2 3.5 24.3
Valuation
2017F P/E (x) P/B (x) ROE (%)
JCI 15.6 2.3 17.9
Key Rates
Last Trade Chg (bps) MoM YoY
BI 7-Day RR 4.75 0 0 -50*
3yr 7.15 -5 -5 -72
10yr 7.51 -3 -9 -54
*since introduced in Aug 2016
FX
Last Trade Chg (%) MoM YoY
USD/IDR 13,383.00 0.2 0.1 0.9
USD/KRW 1,156.22 1.3 1.6 -3.8
USD/JPY 114.04 -0.3 2.1 0.5
USD/CNY 6.90 0.1 0.3 5.4
Commodities
Last Trade Chg (%) MoM YoY
WTI 53.3 1.4 -0.6 22.8
Gold 1,234.8 0.0 -0.1 -2.6
Coal 81.0 1.2 -2.5 58.4
Palm Oil 705.0 0.0 5.0 21.3
Rubber 195.4 0.0 -11.4 84.4
Nickel 10,780.0 -2.3 5.4 19.8
Copper 5,930.0 -1.4 2.7 22.1
Tin 19,500.0 0.8 -2.1 17.5
JCI Index VS MSCI Emerging Markets
650 800 950 1,100
3,500 4,500 5,500
03/13 03/14 03/15 03/16 03/17
(pt) JCI MSCI EM (pt)
1,100 5,500
(pt) JCI MSCI EM (pt)
2
Mirae Asset Sekuritas Indonesia cartoon
Local flashes
WTON: Wika Beton operasikan pabrik crushing plant di Palu. PT Wijaya Karya Beton Tbk (WTON) meresmikan pengoperasikan pabrik crushing plant (pemecah batu material alam) di Kabupaten Donggala, Palu, Sulawesi Tengah. Pabrik crushing plant ini merupakan pabrik ketiga yang dimiliki anak usaha PT Wijaya Karya Tbk ini. Sebelumnya, WTON telah membuka pabrik crushing plantdi wilayah Lampung dan Bogor. Pabrik ini memiliki kapasitas terpasang sebesar 240.000 ton per tahun. Pabrik diperkirakan dapat menyuplai kebutuhan bahan baku split hingga 30 tahun mendatang. (Kontan)
PPRO: PP Properti-Aryan Indonesia bentuk usaha patungan. PT PP Properti Tbk (PPRO) membentuk usaha patungan dengan PT Aryan Indonesia pada 1 Maret 2017.
Indaryanto, Sekretaris Perusahaan Perseroan menyebutkan perusahaan patungan ini akan menjalankan usaha dan pembangunan proyek taman rekreasi KidZania di proyek Laggon Avenue Sungkono Surabaya. (Iqplus)
MNCN: MNC bidik pendapatan 2017 tumbuh 8%. PT Media Nusantara Citra Tbk (MNCN) menatap tahun ini lebih optimistis. Emiten media ini menargetkan pertumbuhan pendapatan sebesar 8% pada 2017. Optimisme ini didasari sentimen perbaikan ekonomi. Direktur Utama MNCN, David F Audy menyebut, outlook tahun 2017 akan positif dibandingkan tahun lalu yang pertumbuhan pendapatannya diprediksi mencapai 5,5% year on year menjadi Rp 6,8 triliun. Hal ini juga didorong pendapatan MNCN pada kuartal empat lalu yang tumbuh 8,6%. (Kontan)
MBTO: Martina Berto bidik laba tumbuh 20%. PT Martina Berto Tbk menargetkan pertumbuhan laba bersih 20% tahun sepanjang tahun 2017. Bagi produsen kosmetik Sariayu Martha Tilaar itu, target yang dicanangkan itu termasuk agresif. Sebab, tahun 2015 lalu bottom line mereka merah. Tahun 2015, Martina Berto mencatatkan rugi bersih Rp 14,06 miliar. Padahal pendapatan bersih mereka masih tumbuh 3,48%
menjadi Rp 694,78 miliar. (Kontan)
TBLA: Pangkas pinjaman bank, TBLA refinancing lewat global bonds US$200 juta. PT Tunas Baru Lampung Tbk. berencana untuk menerbitkan surat utang global senilai maksimal US$200 juta melalui anak usahanya yang berbasis di Singapura, TBLA International Pte. Ltd. Melalui prospektus ringkas yang dipublikasikan Jumat (3/3), direksi Tunas Baru Lampung menjabarkan dana hasil emisi global bond akan digunakan perseroan untuk menurunkan saldo pinjaman jangka menengah dan/atau jangka pendek. (Bisnis Indonesia)
BINA: Bank Ina Perdana punya dua investor baru. Pemegang saham di PT Bank Ina Perdana Tbk (INA) terjadi perombakan. Berdasarkan laporan keterbukaan di Bursa Efek Indonesia (BEI), investor terbaru yang akan masuk ke saham Bank Ina Perdana adalah PT Gaya Hidup Masa Kini dan PT Samura Biru. Kedua investor tersebut menjadi angin segar bagi perusahaan. Edy Kuntardjo, Direktur Utama Bank Ina Perdana mengakui, kedua investor tersebut akan masuk melalui right issue. Data terakhir sambil menunggu audit penjatahan Gaya Hidup Masa Kini akan memiliki saham 12,48% di Bank INA dan Samudra Biru akan memiliki saham 16,52% di Bank INA. (Kontan)
4
Technical analysis
Tasrul +62-21-515-1140 [email protected] Jakarta Composite Index (JCI) – Consolidation
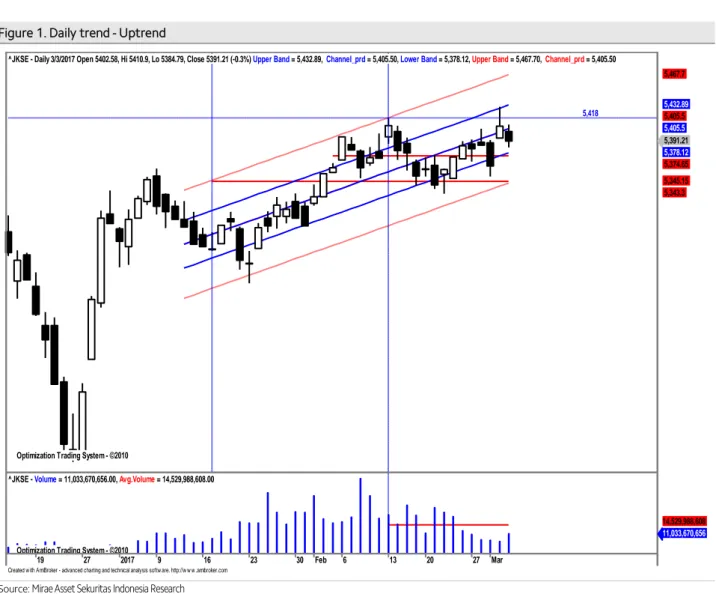
IHSG akan menguji support di5,378
IHSG saat masih dalam pola uptrend jangka pendek relatif valid yang dimulai sejak selama 356 hari terakhir dengan r-squared = 0.7263 dan bergerak normal dalam rentang +/-1.1 std.deviasi dari centerline. Peluang IHSG bergerak di luar pergerakan normal sekitar 27.37% atau sekitar 9 bar chart. Volatilitas normal pergerakan IHSG saat ini sebesar +/-0.39% atau sekitar +/- 20.8 point. IHSG akan coba menguji support di 5,378 sebagaimana terlihat pada Figure 1.
Summary
Item Data Item Data
Close (March 3, 2017) 5,391.21(-0.3%) Trading range 5,378-5,418 Average index performance (%) 0.90 Target
Period 36 - Daily 5,408
r-squared 0.7263 - Weekly 5,425
Volatility (+/-, %) 0.39 - Monthly 5,470 Volatility (+/-, point) 20.8 Stop loss 5,374 Source: Mirae Asset Sekuritas Indonesia Research
Figure 1. Daily trend - Uptrend
Source: Mirae Asset Sekuritas Indonesia Research
Created w ith AmiBroker - advanced charting and technical analysis softw are. http://w w w .amibroker.com Optimization Trading System - ©2010
Optimization Trading System - ©2010 Optimization Trading System - ©2010 Optimization Trading System - ©2010
5,418
^JKSE - Daily 3/3/2017 Open 5402.58, Hi 5410.9, Lo 5384.79, Close 5391.21 (-0.3%) Upper Band = 5,432.89, Channel_prd = 5,405.50, Lower Band = 5,378.12, Upper Band = 5,467.70, Channel_prd = 5,405.50
5,391.21 5,378.12 5,374.65 5,345.15 5,343.3 5,405.5 5,405.5 5,432.89 5,467.7
19 27 2017 9 16 23 30 Feb 6 13 20 27 Mar
Optimization Trading System - ©2010
^JKSE - Volume = 11,033,670,656.00, Avg.Volume = 14,529,988,608.00
11,033,670,656 14,529,988,608
Aliran dana keluar dan volatilitas indeks tuurn masih terlihat namun relatif terbatas.
Pada Figure 2, terlihat dari hasil optimalisasi terakhir, indikator MFI Optimized dan indikator RSI optimized akan menguji support trendline dengan volume masih di bawah rata-rata, dengan demikian potensi koreksi masih terlihat namun terbatas . Resistance terdekat di 5,418 dan support di 5,378. Stop loss level di 5,374.
Figure 2. Daily MFI optimized & RSI optimized
Source: Mirae Asset Sekuritas Indonesia Research
Created w ith AmiBroker - advanced charting and technical analysis softw are. http://w w w .amibroker.com
^JKSE - MFI Smoothed = 38.45
38.4531
^JKSE - RSI Smoothed = 56.95
56.9517
Optimization Trading System - ©2010 Optimization Trading System - ©2010 Optimization Trading System - ©2010
5,418
^JKSE - Daily 3/3/2017 Open 5402.58, Hi 5410.9, Lo 5384.79, Close 5391.21 (-0.3%) VWAP = 5,333.36, VWAP = 5,374.46, VWAP = 5,345.15
5,391.21 5,374.46 5,345.15 5,333.36
Oct 10 17 24 31Nov 7 14 21 28 Dec 13 19 27 2017 9 16 23 30 Feb 6 13 20 27 Mar
Optimization Trading System - ©2010
^JKSE - Volume = 11,033,670,656.00, Avg.Volume = 14,529,988,608.00
11,033,670,656 14,529,988,608
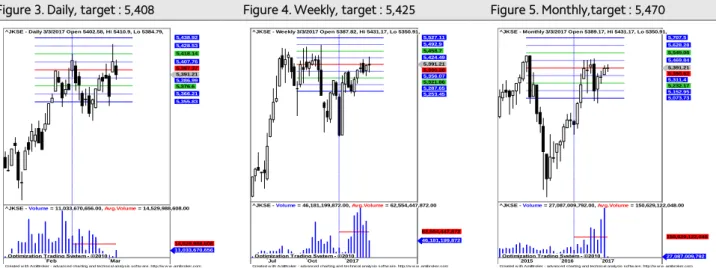
6 IHSG akan coba naik mendekati resistance 2 pada masing-masing periode.
Untuk mampu naik lebih lanjut IHSG saat ini harus mampu bertahan minimal sekitar rata-rata masing-masing periode dengan target terdekat berikutnya resistance 2 pada periode masing-masing sebagaimana terlihat pada Figure 3,4 dan 5.
Figure 3. Daily, target : 5,408 Figure 4. Weekly, target : 5,425 Figure 5. Monthly,target : 5,470
x
Source: Mirae Asset Sekuritas Indonesia Research Source: Mirae Asset Sekuritas Indonesia Research Source: Mirae Asset Sekuritas Indonesia Research
Created w ith AmiBroker - advanced charting and technical analysis sof tw are. http://w w w .amibroker.com
^JKSE - Daily 3/3/2017 Open 5402.58, Hi 5410.9, Lo 5384.79,
5,391.21 5,386.99 5,376.6 5,366.21 5,355.83 5,397.37 5,407.76 5,418.14 5,428.53 5,438.92
Feb Mar
Optimization Trading System - ©2010
^JKSE - Volume = 11,033,670,656.00, Avg.Volume = 14,529,988,608.00
11,033,670,656 14,529,988,608
Created w ith AmiBroker - advanced charting and technical analysis sof tw are. http://w w w .amibroker.com
^JKSE - Weekly 3/3/2017 Open 5387.82, Hi 5431.17, Lo 5350.91,
5,391.21 5,390.28 5,356.07 5,321.86 5,287.65 5,253.45 5,424.49 5,458.7 5,492.9 5,527.11
Jul Oct 2017
Optimization Trading System - ©2010
^JKSE - Volume = 46,181,199,872.00, Avg.Volume = 62,554,447,872.00
46,181,199,872 62,554,447,872
Created w ith AmiBroker - advanced charting and technical analysis sof tw are. http://w w w .amibroker.com
^JKSE - Monthly 3/3/2017 Open 5389.17, Hi 5431.17, Lo 5350.91,
5,391.21 5,390.62 5,311.4 5,232.17 5,152.95 5,073.73 5,469.84 5,549.06 5,628.28 5,707.5
2015 2016 2017
Optimization Trading System - ©2010
^JKSE - Volume = 27,087,009,792.00, Avg.Volume = 150,629,122,048.00
27,087,009,792 150,629,122,048
Stocks on our focus list
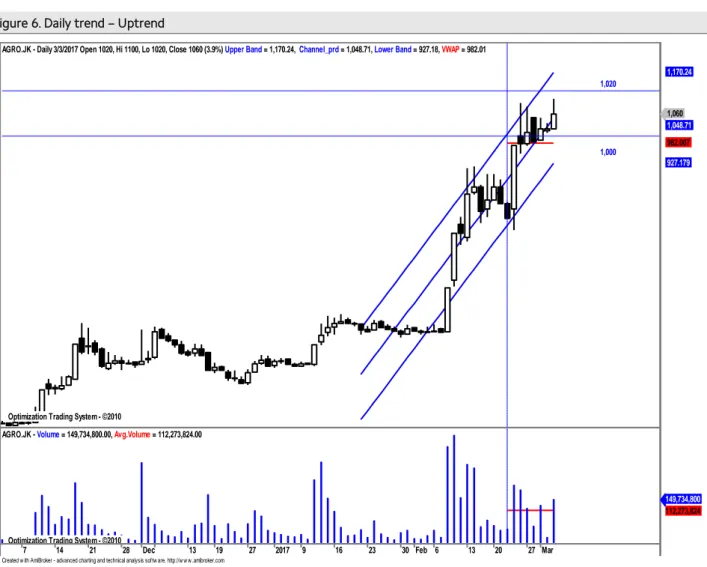
Bank Rakyat Indonesia Agroniaga (AGRO) – Sell on Strength Harga akan coba naik mendekati normal upper band pada trend channel.
Secara umum harga saham ini masih bergerak pada uptrend channel yang masih relatif valid (r-squared = 0.88) selama 30 hari terakhir yang bergerak normal dalam rentang +/- 1.56 std.deviasi dari center line. Peluang harga keluar dari pergerakan normal sekitar 11.94 % (sekitar 4bbar chart ). Volatilitas normal pergerakkan harga saham ini sepanjang uptrend channel sebesar +/- 4.45 % atau sekitar +/-47.18 (potensi naik dan turun secara normal maksimum/minimum sebesar 45-50 rupiah) dari level penutupan terakhir. Saat ini harga akan coba naik mendekati normal lower band pada uptrend channel sebagaimana terlihat pada Figure 6.
Summary
Item Data Item Data
Close (March 3,, 2017) 1,060(+3.9%) Trading range 1,000-1,120
Relative Avg. Price performance to JCI (%) 46.17 Target
β (beta) 0.76 - Daily 1,010
Corelation 0.71 - Weekly 1,080
Period 30 - Monthly 1,120
r-squared 0.88 Stop loss 980
Volatility (+/-, %) 4.45
Volatility (+/-, Rp.) 47.18
Source: Mirae Asset Sekuritas Indonesia Research
Figure 6. Daily trend – Uptrend
Source: Mirae Asset Sekuritas Indonesia Research
Created w ith AmiBroker - advanced charting and technical analysis softw are. http://w w w .amibroker.com Optimization Trading System - ©2010
Optimization Trading System - ©2010
1,000 1,020 AGRO.JK - Daily 3/3/2017 Open 1020, Hi 1100, Lo 1020, Close 1060 (3.9%) Upper Band = 1,170.24, Channel_prd = 1,048.71, Lower Band = 927.18, VWAP = 982.01
1,060 1,048.71 982.007 927.179 1,170.24
7 14 21 28 Dec 13 19 27 2017 9 16 23 30 Feb 6 13 20 27 Mar
Optimization Trading System - ©2010
AGRO.JK - Volume = 149,734,800.00, Avg.Volume = 112,273,824.00
149,734,800 112,273,824
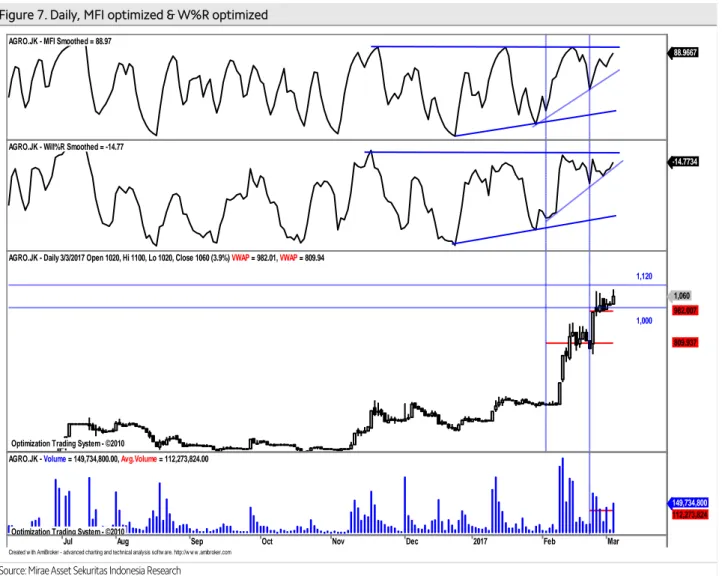
8 Aliran dana masuk dan volatilitas harga naik masih terlihat.
Pada Figure 7, terlihat dari hasil optimalisasi terakhir, indikator MFI Optimized dan indikator W%R optimized masih cenderung naik dengan volume tembus rata-rata. Hal ini mengindikasikan potensi kenaikkan masih terlihat. Resistance terdekat di 1,120 . Support terdekat di 1,000. Stop loss level di 980.
Figure 7. Daily, MFI optimized & W%R optimized
Source: Mirae Asset Sekuritas Indonesia Research
Created w ith AmiBroker - advanced charting and technical analysis softw are. http://w w w .amibroker.com AGRO.JK - MFI Smoothed = 88.97
88.9667
AGRO.JK - Will%R Smoothed = -14.77
-14.7734
Optimization Trading System - ©2010 Optimization Trading System - ©2010
1,000 1,120 AGRO.JK - Daily 3/3/2017 Open 1020, Hi 1100, Lo 1020, Close 1060 (3.9%) VWAP = 982.01, VWAP = 809.94
1,060 982.007
809.937
Jul Aug Sep Oct Nov Dec 2017 Feb Mar
Optimization Trading System - ©2010
AGRO.JK - Volume = 149,734,800.00, Avg.Volume = 112,273,824.00
149,734,800 112,273,824
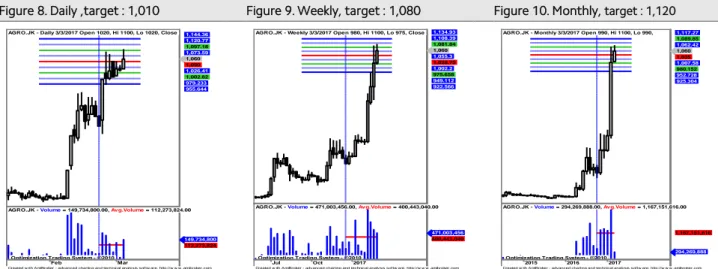
Harga akan naik dan bertahan diatas resistance 2 pada masing-masing periode.
Untuk naik lebih lanjut harga harus mampu bertahan minimal sekitar resistance 2 masing-masing periodedengan target berikutnya mendekati resistance 4 pada masing- masing periode sebagaimana terlihat pada Figure 8,9 dan 10.
Figure 8. Daily ,target : 1,010 Figure 9. Weekly, target : 1,080 Figure 10. Monthly, target : 1,120
Source: Mirae Asset Sekuritas Indonesia Research Source: Mirae Asset Sekuritas Indonesia Research Source: Mirae Asset Sekuritas Indonesia Research
Created w ith AmiBroker - advanced charting and technical analysis sof tw are. http://w w w .amibroker.com AGRO.JK - Daily 3/3/2017 Open 1020, Hi 1100, Lo 1020, Close
1,060 1,050 1,026.41 1,002.82 979.233 955.644 1,073.59 1,097.18 1,120.77 1,144.36
Feb Mar
Optimization Trading System - ©2010
AGRO.JK - Volume = 149,734,800.00, Avg.Volume = 112,273,824.00
149,734,800 112,273,824
Created w ith AmiBroker - advanced charting and technical analysis sof tw are. http://w w w .amibroker.com AGRO.JK - Weekly 3/3/2017 Open 980, Hi 1100, Lo 975, Close
1,060 1,055.3 1,028.75 1,002.2 975.658 949.112 922.566 1,081.84 1,108.39 1,134.93
Jul Oct 2017
Optimization Trading System - ©2010
AGRO.JK - Volume = 471,003,456.00, Avg.Volume = 400,443,040.00
471,003,456 400,443,040
Created w ith AmiBroker - advanced charting and technical analysis sof tw are. http://w w w .amibroker.com AGRO.JK - Monthly 3/3/2017 Open 990, Hi 1100, Lo 990,
1,060 1,035 1,007.58 980.152 952.728 925.304 1,062.42 1,089.85 1,117.27
2015 2016 2017
Optimization Trading System - ©2010
AGRO.JK - Volume = 294,269,888.00, Avg.Volume = 1,167,151,616.00
294,269,888 1,167,151,616
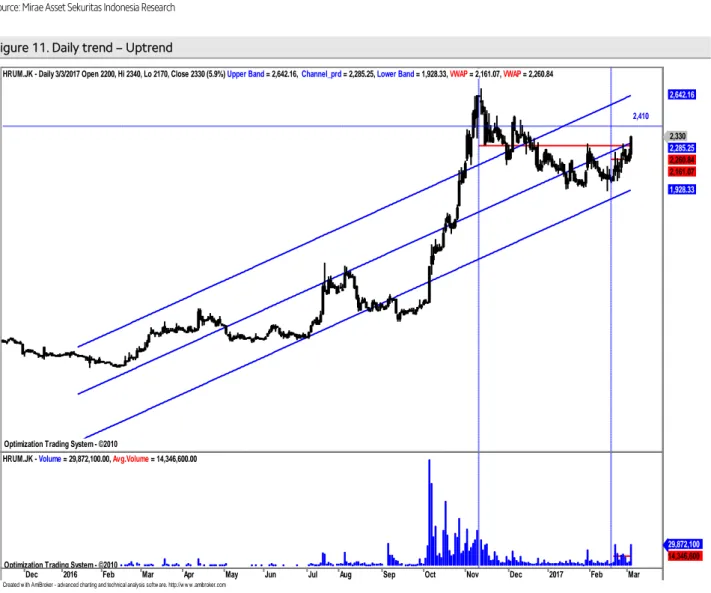
10 Harum Energy (HRUM) – Trading Buy
Harga akan coba naik dan tembus center line pada uptrend channel .
Secara umum harga saham ini juga masih bergerak dalam pola uptrend channel yang masih relatif valid (r-squared = 0.79) selama 281 hari terakhir dan bergerak normal dalam rentang +/- 1.25 std.deviasi dari center line. Peluang harga keluar dari pergerakan normal sekitar 21.02% (sekitar 59 bar chart ). Volatilitas normal pergerakan harga saham ini sepanjang uptrend channel sebesar +/ 3.24 % atau sekitar +/- 75.59 (potensi naik dan turun secara normal maksimum/minimum sebesar 75 rupiah) dari level penutupan terakhir. Saat ini harga akan coba naik dan tembus center line pada uptrend channel sebagaimana terlihat pada Figure 11.
Summary
Item Data Item Data
Close (March 3, 2017) 2,330(+5.9%) Trading range 2,260-2,410 Relative Avg. Price performance to JCI (%) 9.69 Target
β (beta) 0.20 - Daily 2,370
Corelation 0.46 - Weekly 2,430
Period 281 - Monthly 2,470
r-squared 0.79 Stop loss 2,160
Volatility (+/-, %) 3.24
Volatility (+/-, Rp.) 75.59
Source: Mirae Asset Sekuritas Indonesia Research
Figure 11. Daily trend – Uptrend
Source: Mirae Asset Sekuritas Indonesia Research
Created w ith AmiBroker - advanced charting and technical analysis softw are. http://w w w .amibroker.com Optimization Trading System - ©2010
Optimization Trading System - ©2010 Optimization Trading System - ©2010
2,410 HRUM.JK - Daily 3/3/2017 Open 2200, Hi 2340, Lo 2170, Close 2330 (5.9%) Upper Band = 2,642.16, Channel_prd = 2,285.25, Lower Band = 1,928.33, VWAP = 2,161.07, VWAP = 2,260.84
2,330 2,285.25 2,260.84 2,161.07 1,928.33 2,642.16
Dec 2016 Feb Mar Apr May Jun Jul Aug Sep Oct Nov Dec 2017 Feb Mar
Optimization Trading System - ©2010
HRUM.JK - Volume = 29,872,100.00, Avg.Volume = 14,346,600.00
29,872,100 14,346,600
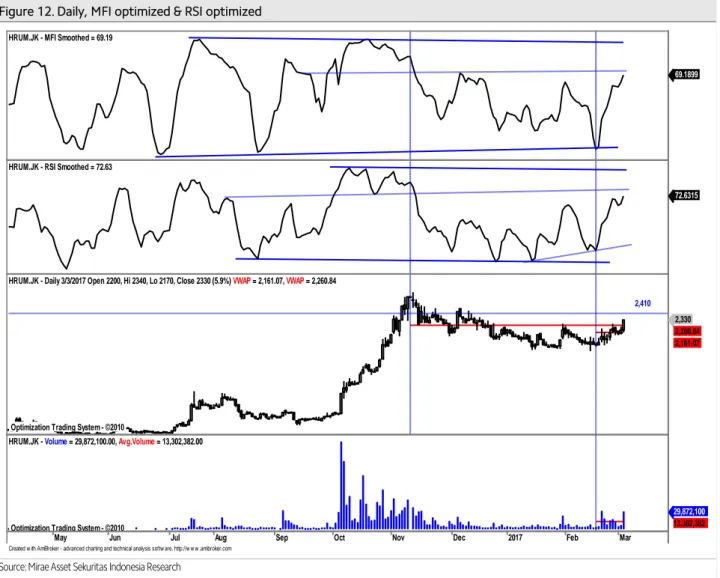
Aliran dana masuk dan volatilitas harga naik masih terlihat.
Pada Figure 12, terlihat dari hasil optimalisasi indikator MFI Optimized dan indicator RSI Optimized masih cenderung naik dengan volume tembus rata-rata. Hal ini mengindikasikan potensi kenaikkan masih terlihat. Resistance terdekat di 2,410.
Support saat ini di 2,260. Stop loss level di 2,160.
Figure 12. Daily, MFI optimized & RSI optimized
Source: Mirae Asset Sekuritas Indonesia Research
Created w ith AmiBroker - advanced charting and technical analysis softw are. http://w w w .amibroker.com HRUM.JK - MFI Smoothed = 69.19
69.1899
HRUM.JK - RSI Smoothed = 72.63
72.6315
Optimization Trading System - ©2010 Optimization Trading System - ©2010
2,410 HRUM.JK - Daily 3/3/2017 Open 2200, Hi 2340, Lo 2170, Close 2330 (5.9%) VWAP = 2,161.07, VWAP = 2,260.84
2,330 2,260.84 2,161.07
May Jun Jul Aug Sep Oct Nov Dec 2017 Feb Mar
Optimization Trading System - ©2010
HRUM.JK - Volume = 29,872,100.00, Avg.Volume = 13,302,382.00
29,872,100 13,302,382
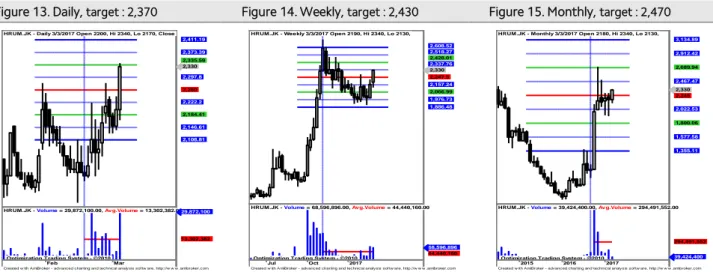
12 Harga akan coba naik dan tembus resistance 2 pada masing-masing periode.
Untuk naik lebih lanjut harga harus mampu bertahan minimal di support 1 masing- masing periode dengan target berikutnya tembus resistance 2 sebagaimana terlihat pada Figure 14,15 dan 16.
Figure 13. Daily, target : 2,370 Figure 14. Weekly, target : 2,430 Figure 15. Monthly, target : 2,470 x
Source: Mirae Asset Sekuritas Indonesia Research Source: Mirae Asset Sekuritas Indonesia Research Source: Mirae Asset Sekuritas Indonesia Research
Created w ith AmiBroker - advanced charting and technical analysis sof tw are. http://w w w .amibroker.com HRUM.JK - Daily 3/3/2017 Open 2200, Hi 2340, Lo 2170, Close
2,330 2,297.8 2,260 2,222.2 2,184.41 2,146.61 2,108.81 2,335.59 2,373.39 2,411.19
Feb Mar
Optimization Trading System - ©2010
HRUM.JK - Volume = 29,872,100.00, Avg.Volume = 13,302,382.0029,872,100
13,302,382
Created w ith AmiBroker - advanced charting and technical analysis sof tw are. http://w w w .amibroker.com HRUM.JK - Weekly 3/3/2017 Open 2190, Hi 2340, Lo 2130,
2,330 2,247.5 2,157.24 2,066.99 1,976.73 1,886.48 2,337.76 2,428.01 2,518.27 2,608.52
Jul Oct 2017
Optimization Trading System - ©2010
HRUM.JK - Volume = 68,596,896.00, Avg.Volume = 44,440,160.00
68,596,896 44,440,160
Created w ith AmiBroker - advanced charting and technical analysis sof tw are. http://w w w .amibroker.com HRUM.JK - Monthly 3/3/2017 Open 2180, Hi 2340, Lo 2130,
2,330 2,245 2,022.53 1,800.06 1,577.58 1,355.11 2,467.47 2,689.94 2,912.42 3,134.89
2015 2016 2017
Optimization Trading System - ©2010
HRUM.JK - Volume = 39,424,400.00, Avg.Volume = 294,491,552.00
39,424,400 294,491,552
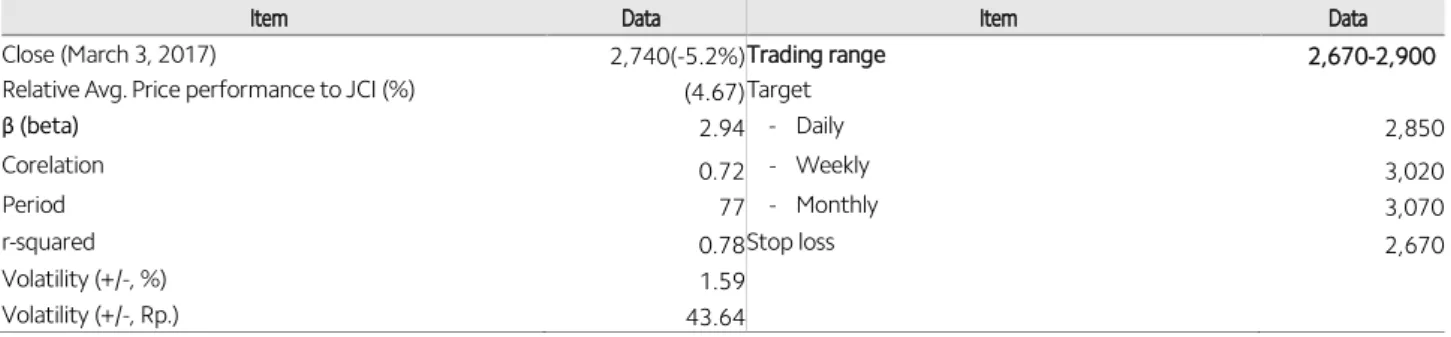
Surya Citra Media (SCMA) – Buy on Weakness
Harga akan coba naik dan tembus abnormal lower band pada uptrend channel.
Secara umum harga saham ini akan coba naik dan tembus normal lower band pada uptrend channel yang masih relatif valid dengan r-squared = 0.78 selama 77 hari terakhir dan bergerak normal dalam rentang +/-1.28 std.deviasi dari centerline. Peluang harga keluar dari pergerakan normalnya sekitar 22.23 % (sekitar 17 bar chart ).
Volatilitas normal pergerakan harga saham ini sepanjang uptrend channel sebesar +/- 1.59 % atau sekitar +/-43.64 (potensi naik dan turun secara normal maksimum/minimum sebesar 40-45 rupiah) dari level penutupan terakhir sebagaimana terlihat pada Figure 16.
Summary
Item Data Item Data
Close (March 3, 2017) 2,740(-5.2%) Trading range 2,670-2,900
Relative Avg. Price performance to JCI (%) (4.67) Target
β (beta) 2.94 - Daily 2,850
Corelation 0.72 - Weekly 3,020
Period 77 - Monthly 3,070
r-squared 0.78 Stop loss 2,670
Volatility (+/-, %) 1.59
Volatility (+/-, Rp.) 43.64
Source: Mirae Asset Sekuritas Indonesia Research
Figure 16. Daily Trend – Uptrend
Source: Mirae Asset Sekuritas Indonesia Research
Created w ith AmiBroker - advanced charting and technical analysis softw are. http://w w w .amibroker.com Optimization Trading System - ©2010
Optimization Trading System - ©2010 Optimization Trading System - ©2010 Optimization Trading System - ©2010 Optimization Trading System - ©2010
SCMA.JK - Daily 3/3/2017 Open 2860, Hi 2860, Lo 2740, Close 2740 (-5.2%) Upper Band = 3,183.95, Channel_prd = 3,042.78, Lower Band = 2,901.60, Upper Band = 3,317.26, Channel_prd = 3,042.78, Lower
2,740 2,672.29 2,768.29 2,896.38 2,901.6 2,920.29 3,042.78 3,042.78 3,183.95 3,317.26
17 24 31Nov 7 14 21 28 Dec 13 19 27 2017 9 16 23 30 Feb 6 13 20 27 Mar
Optimization Trading System - ©2010
SCMA.JK - Volume = 28,564,200.00, Avg.Volume = 12,527,683.00
28,564,200 12,527,683
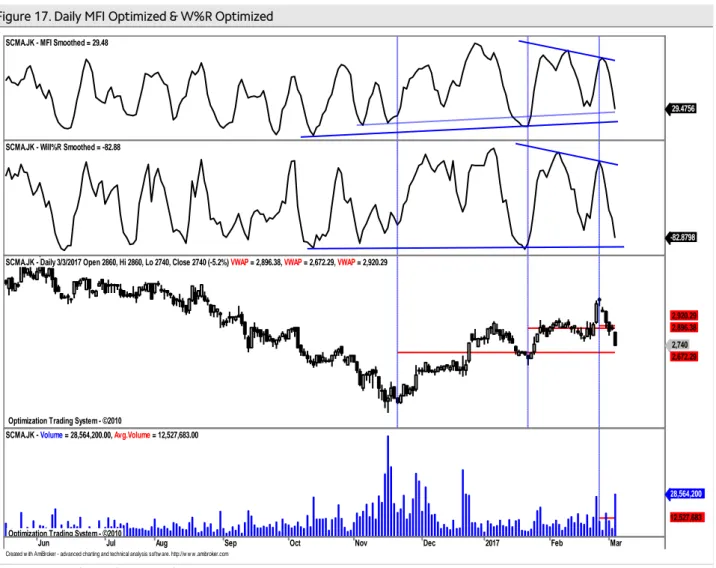
14 Aliran dana keluar dan volatilitas harga turun mulai tertahan.
Pada Figure 17, terlihat dari hasil optimalisasi, indikator MFI Optimized dan indikator W%R Optimized akan menguji support trend line dengan volume di tembus rata-rata.
Dengan demikian diperkirakan koreksi sudah mencapai selling climax. Perkiraan resistance terdekat ke 2,900. Support terdekat di 2,670 yang sekaligus sebagai stop loss level.
Figure 17. Daily MFI Optimized & W%R Optimized
Source: Mirae Asset Sekuritas Indonesia Research
Created w ith AmiBroker - advanced charting and technical analysis softw are. http://w w w .amibroker.com SCMA.JK - MFI Smoothed = 29.48
29.4756
SCMA.JK - Will%R Smoothed = -82.88
-82.8798
Optimization Trading System - ©2010 Optimization Trading System - ©2010 Optimization Trading System - ©2010
SCMA.JK - Daily 3/3/2017 Open 2860, Hi 2860, Lo 2740, Close 2740 (-5.2%) VWAP = 2,896.38, VWAP = 2,672.29, VWAP = 2,920.29
2,740 2,672.29 2,896.38 2,920.29
Jun Jul Aug Sep Oct Nov Dec 2017 Feb Mar
Optimization Trading System - ©2010
SCMA.JK - Volume = 28,564,200.00, Avg.Volume = 12,527,683.00
28,564,200 12,527,683
Harga akan coba naik dan bertahan sekitar rata-rata pada masing-masing periode.
Untuk naik lebih lanjut harga harus mampu bertahan sekitar rata-rata masing-masing periode dengan targetterdekat minimal resistance 2 sebagaimana terlihat pada Figure 18,19 dan 20.
Figure 18. Daily, target : 2,850 Figure 19. Weekly, target : 3,020 Figure 20. Monthly, target : 3,070
Source: Mirae Asset Sekuritas Indonesia Research Source: Mirae Asset Sekuritas Indonesia Research Source: Mirae Asset Sekuritas Indonesia Research
analyzed by : Tasrul, [email protected], +62-21- 5151140
Relative Avg.Price Performance to JCI (%) : Persentase kenaikan harga saham dari rata-rata sejak IHSG memulai uptrend-nya β (beta) : Indikator sensitivitas harga saham terhadap IHSG, beta diatas 1 berarti harga makin sensitif terhadap pergerakan IHSG dan sebaliknya
Correlation : Ukuran kuat hubungan (korelasi) pergerakan harga saham dibanding dengan pergerakan IHSG
Period : Periode uptrend / downtrend yang valid dari pergerakan harga saham
r-squared : Koefisien determinasi, menunjukkan persentase gerakan yang dapat dijelaskan dengan regresi linier.Nilai R2 terletak antara 0 – 1, dan kecocokan model dikatakan lebih baik kalau R2 semakin mendekati 1 (validitas uptrend atau downtrend makin valid) Volatility (+/-%) : Besaran volatilitas normal maksimal/minimal dari pergerakan harga harian selama harga saham bergerak normal pada trend channel dalam persentase.
Volatility (+/- point or Rp) : Besaran volatilitas normal maksimal/minimal dari pergerakan harga harian selama Harga saham bergerak
Buy: : Beli, harga sudah menyentuh atau jatuh di bawah support dan indikator teknikal berada di oversold area.
Sell: : Jual, harga sudah menyentuh atau tembus resistance normal dan indikator berada di overbought area.
BoW: : Buy on Weakness, beli ketika harga sudah melemah, dimana Volume tekanan jual mulai berkurang dan harga mendekati support, serta indikator teknikal sudah berada di oversold area.
SoS: : Sell on Strength, jual ketika kenaikan harga sudah mulai terbatas dimana volume beli mulai berkurang dan harga mendekati resistance, serta indikator teknikal sudah berada di overbought area.
Trading Buy: : Beli dan jual kembali secepatnya jika harga sudah mencapai level resistance terdekat, karena kenaikan harga relatif tidak stabil atau hanya sementara.
Trading Sell : Jual dan beli kembali secepatnya jika harga sudah mencapai level support terdekat karena koreksi harga relative tidak stabil atau hanya sementara.
Created w ith AmiBroker - advanced charting and technical analysis sof tw are. http://w w w .amibroker.com SCMA.JK - Daily 3/3/2017 Open 2860, Hi 2860, Lo 2740, Close
2,740 2,726.8 2,702.4 2,751.2 2,775.6 2,800 2,824.4 2,848.8 2,873.2 2,897.6
Feb Mar
Optimization Trading System - ©2010
SCMA.JK - Volume = 28,564,200.00, Avg.Volume = 12,527,683.0028,564,200
12,527,683
Created w ith AmiBroker - advanced charting and technical analysis sof tw are. http://w w w .amibroker.com SCMA.JK - Weekly 3/3/2017 Open 3050, Hi 3090, Lo 2740,
2,740 2,739.64 2,684.51 2,794.76 2,849.88 2,905 2,960.12 3,015.24 3,070.36 3,125.49
Jul Oct 2017
Optimization Trading System - ©2010
SCMA.JK - Volume = 64,960,600.00, Avg.Volume = 51,094,272.00
64,960,600 51,094,272
Created w ith AmiBroker - advanced charting and technical analysis sof tw are. http://w w w .amibroker.com SCMA.JK - Monthly 3/3/2017 Open 2950, Hi 2950, Lo 2740,
2,740 2,733.69 2,622.39 2,511.08 2,399.78 2,845 2,956.31 3,067.61 3,178.92 3,290.22
2015 2016 2017
Optimization Trading System - ©2010
SCMA.JK - Volume = 44,785,600.00, Avg.Volume = 253,852,288.00
44,785,600 253,852,288
16
Chart 21. JCI Vs. USD/IDR Chart 22. JCI performance (absolute vs. relative)
Source: Bloomberg, Mirae Asset Sekuritas Indonesia Note: Relative to MSCI EM Index
Source: Bloomberg, Mirae Asset Sekuritas Indonesia
Chart 23. Foreigner’s net purchase (EM) Chart 24. Energy price
Note: The latest figure for India are March 2nd, 2017
Source: Bloomberg, Mirae Asset Sekuritas Indonesia Source: Bloomberg, Mirae Asset Sekuritas Indonesia
Chart 25. Non-ferrous metal price Chart 26. Precious metal price
Source: Bloomberg, Mirae Asset Sekuritas Indonesia Source: Bloomberg, Mirae Asset Sekuritas Indonesia 12,800
13,000 13,200 13,400 13,600 13,800 14,000
4,300 4,500 4,700 4,900 5,100 5,300 5,500
12/5 1/2 1/30 2/27
(IDR)
(pt) JCI (L) USD/IDR (R)
-0.3
0.1
-0.1
11.1
0.3 1.4
-1.0
-6.6 -8
-4 0 4 8 12 16
1D 1W 1M 1Y
Absolute Relative (%, %p)
0
-144 3
-59
-7 4 451
-74 9
-152 -49
225
-200 -100 0 100 200 300 400 500
Korea Taiwan Indonesia Thailand Philippines India
1 Day 5 Days
(USDmn) (USDmn) (USDmn) (USDmn)
80 85 90 95 100 105 110
12/16 12/16 1/17 1/17 1/17 2/17 2/17
CPO WTI Coal
(
( (D-3M=100)
70 75 80 85 90 95 100 105
12/16 12/16 1/17 1/17 1/17 2/17 2/17
(D-3M=100) Copper Nickel Tin
( ( ( (
80 85 90 95 100 105 110 115
12/16 12/16 1/17 1/17 1/17 2/17 2/17
Silver Gold Platinum
Table. Key valuation metrics
Company Name Ticker
Price Market Cap Price Performance (%) P/E(X)* P/B(X)* ROE(%)*
(IDR) (IDRbn) 1D 1W 1M 1Y FY16 FY17 FY16 FY17 FY16 FY17
Jakarta Composite Index JCI 5,391 5,905,173 -0.3 0.1 0.6 11.3 15.6 13.6 2.3 2.1 17.9 14.0
FINANCIALS
Bank Central Asia BBCA 15,475 381,536 -0.2 -0.2 0.0 14.4 17.0 15.0 3.0 2.6 18.9 18.5
Bank Mandiri Persero BMRI 11,350 264,833 0.2 2.3 2.5 17.0 19.6 13.2 1.8 1.6 10.3 12.8
Bank Rakyat Indonesia Persero BBRI 11,850 292,330 0.0 -0.8 -1.3 6.3 10.9 10.5 1.9 1.8 20.2 18.5
Bank Negara Indonesia Persero BBNI 6,350 118,419 2.0 0.0 6.3 23.3 9.1 9.0 1.2 1.3 13.9 14.5
Bank Tabungan Negara Persero BBTN 2,110 22,345 -0.5 -1.9 11.6 26.3 13.3 11.8 1.0 1.1 7.6 10.0
CONSUMER
HM Sampoerna HMSP 3,990 464,109 -2.4 1.8 2.0 -9.4 35.1 31.8 12.8 11.8 37.0 38.4
Gudang Garam GGRM 64,475 124,056 -2.1 -0.8 4.3 -2.3 16.3 14.3 2.8 2.5 17.8 18.0
Indofood CBP Sukses Makmur ICBP 8,225 95,919 -0.3 -1.2 -2.7 3.0 23.8 21.4 4.9 4.4 21.5 21.8
Indofood Sukses Makmur INDF 8,050 70,682 0.3 -0.6 2.2 9.2 15.9 14.0 2.2 2.0 13.8 14.7
Kalbe Farma KLBF 1,485 69,610 0.7 -0.7 1.0 12.5 27.3 24.4 5.2 4.7 20.0 20.4
Unilever Indonesia UNVR 41,975 320,269 -0.3 -0.7 -0.1 -9.6 44.4 39.3 55.3 51.6 131.0 138.5
AGRICULTURAL
Astra Agro Lestari AALI 15,275 29,400 -0.3 2.0 -4.5 7.6 14.8 15.5 1.9 1.7 14.1 11.0
PP London Sumatera Indonesia LSIP 1,495 10,200 -2.0 -0.3 -5.1 3.8 20.0 13.3 1.6 1.2 7.9 9.6
Sawit Sumbermas Sarana SSMS 1,400 13,335 -5.1 -6.7 -15.2 -29.5 19.0 15.2 3.3 2.9 17.5 18.8
INFRASTRUCTURE
XL Axiata EXCL 2,890 30,888 -0.7 -7.4 -0.3 -26.8 60.8 67.6 1.2 1.4 2.1 1.7
Jasa Marga JSMR 4,680 33,967 -2.7 -3.7 9.9 -13.5 15.6 18.5 2.3 2.3 15.7 12.3
Perusahaan Gas Negara PGAS 2,830 68,603 2.2 -1.0 -1.4 7.8 11.8 11.1 1.5 1.3 12.7 12.4
Tower Bersama Infrastructure TBIG 5,000 22,657 0.8 -7.4 -2.4 -17.0 17.3 14.9 7.3 5.2 47.0 39.2
Telekomunikasi Indonesia TLKM 3,850 388,080 0.5 0.3 -2.5 12.8 16.6 15.1 4.0 3.6 24.1 24.4
Soechi Lines SOCI 280 1,977 -3.4 1.4 -8.5 -41.5 3.5 N/A N/A N/A 11.3 N/A
Garuda Indonesia GIAA 338 8,750 -0.6 0.0 -0.6 -21.9 21.0 14.8 2.5 2.3 11.8 15.1
BASIC-INDUSTRIES
Semen Indonesia SMGR 9,425 55,905 0.0 -1.6 2.4 -9.2 12.0 14.1 1.9 1.8 16.3 13.2
Charoen Pokphand Indonesia CPIN 3,220 52,802 1.6 -1.5 -0.3 -7.7 15.5 12.9 3.1 2.6 21.2 21.5
Indocement Tunggal Prakarsa INTP 15,500 57,059 0.6 -1.0 0.8 -23.6 15.6 14.6 2.0 1.9 13.4 13.9
Japfa Comfeed Indonesia JPFA 1,710 19,512 0.3 -2.6 0.0 113.8 7.7 10.6 1.9 1.9 28.6 20.1
MINING
Indo Tambangraya Megah ITMG 17,525 19,802 -2.4 1.7 10.9 154.0 10.4 9.0 1.5 1.6 15.0 16.7
Adaro Energy ADRO 1,685 53,896 0.0 -0.9 -2.0 159.2 11.5 11.5 1.2 1.1 9.7 10.4
Aneka Tambang ANTM 755 18,143 -1.9 -1.3 -9.0 95.1 298.3 36.8 1.2 1.0 0.4 2.5
Vale Indonesia INCO 2,520 25,040 -1.6 2.4 -9.0 51.8 N/A 37.7 1.1 1.0 0.1 2.6
Tambang Batubara Bukit Asam PTBA 10,975 25,288 -2.0 -1.6 -6.6 91.7 9.1 8.7 2.0 1.8 21.5 20.9
TRADE
United Tractors UNTR 25,100 93,626 0.1 -1.6 9.1 63.5 15.8 15.7 1.9 2.1 12.7 13.7
AKR Corporindo AKRA 6,200 24,749 -0.8 -8.5 -10.5 -20.5 19.3 16.8 3.2 2.9 17.4 17.8
Global Mediacom BMTR 555 7,880 0.0 9.9 -7.5 -39.7 N/A N/A N/A N/A N/A N/A
Matahari Department Store LPPF 13,100 38,225 1.4 -9.0 -13.4 -26.1 21.9 16.5 23.8 13.6 136.4 94.6
Media Nusantara Citra MNCN 1,660 23,698 0.0 4.4 -2.4 -12.9 12.9 11.4 2.1 1.9 17.2 17.7
Matahari Putra Prima MPPA 1,220 6,561 0.0 0.8 -13.5 -32.8 33.8 27.2 2.3 2.2 5.9 7.9
Surya Citra Media SCMA 2,740 40,063 -5.2 -13.0 -7.1 -5.8 22.0 19.1 9.7 8.4 47.0 46.8
Siloam International Hospital SILO 13,000 16,908 2.0 -5.5 5.9 67.7 150.3 108.5 6.5 6.1 4.1 5.3
PROPERTY
Bumi Serpong Damai BSDE 1,765 33,970 -1.1 -7.1 -6.9 1.4 14.0 12.8 1.5 1.3 10.6 10.8
Adhi Karya ADHI 2,190 7,798 0.5 0.5 4.3 -15.9 23.6 12.3 1.4 1.2 5.9 10.7
Alam Sutera Realty ASRI 366 7,192 -1.1 -3.2 -8.0 2.2 8.4 6.2 0.9 0.8 10.9 12.7
Ciputra Development CTRA 1,285 23,850 -1.5 -6.9 -6.9 -2.4 16.3 13.4 1.8 1.7 12.5 12.8
Lippo Karawaci LPKR 710 16,385 -2.1 -5.3 -2.7 -33.6 18.6 14.4 0.9 0.8 5.0 6.5
Pembangunan Perumahan PTPP 3,540 21,948 -1.1 0.6 -4.6 0.0 23.1 15.4 2.4 2.2 14.4 17.0
Pakuwon Jati PWON 560 26,969 -2.6 -5.1 -2.6 19.1 13.3 10.9 2.6 2.1 20.5 20.5
Summarecon Agung SMRA 1,380 19,909 0.4 -1.1 4.5 -15.3 39.1 30.2 3.0 2.8 7.6 9.6
Wijaya Karya WIKA 2,480 22,245 -1.2 -0.8 -0.4 9.3 14.4 18.2 1.8 1.8 12.9 11.5
Waskita Karya WSKT 2,410 32,713 -1.2 -2.4 -6.6 26.2 17.3 14.6 3.1 2.0 16.6 16.2
MISCELLANEOUS
Astra International ASII 8,400 340,062 -0.9 3.4 3.7 22.2 22.1 17.7 3.0 2.8 14.2 15.9
Source: Bloomberg, Mirae Asset Sekuritas Indonesia
18
Sector performance Top 10 market cap performance
Name Index Chg (%) Ticker Price Market Cap (IDRbn) Chg (%)
Agricultural 1,838.1 -0.7 INAF IJ 2970 9,205 24.79
Mining 1,429.8 -0.1 BUMI IJ 320 11,721 9.59
Basic-Industry 562.3 -0.1 KAEF IJ 2040 11,330 8.80
Miscellaneous Industry 1,416.6 -0.7 BFIN IJ 4000 6,387 8.11
Consumer Goods 2,393.7 -0.9 SCBD IJ 1600 5,315 6.7
Property & Construction 508.0 -0.6 HRUM IJ 2330 6,299 5.91
Infrastructure 1,060.2 0.4 DOID IJ 760 6,327 4.83
Finance 830.0 0.0 RMBA IJ 458 16,672 4.57
Trade 857.4 -0.6 JKON IJ 600 9,785 4.3
Composite 5,391.2 -0.3 AGRO IJ 1060 16,245 3.92
Source: Bloomberg
Top 5 leading movers Top 5 lagging movers
Name Chg (%) Close Name Chg (%) Close
BBNI IJ 2.0 6,350 HMSP IJ -2.4 3,990
TLKM IJ 0.5 3,850 ASII IJ -0.9 8,400
INAF IJ 24.8 2,970 GGRM IJ -2.1 64,475
PGAS IJ 2.2 2,830 SCMA IJ -5.2 2,740
BUMI IJ 9.6 320 UNVR IJ -0.3 41,975
Source: Bloomberg
Economic Calendar
Time Currency Detail Forecast Previous
4:45am NZD Building Consents m/m -7.2%
7:00am AUD MI Inflation Gauge m/m 0.6%
7:30am AUD Retail Sales m/m -0.1%
7:30am AUD ANZ Job Advertisements m/m 4.0%
4:10pm EUR Retail PMI 50.1
4:30pm EUR Sentix Investor Confidence 17.4
6:30pm GBP MPC Member Hogg Speaks
10:00pm USD Factory Orders m/m 1.3%
Note: Time is based on Indonesian local time Source: Forex Factory
Disclaimers
This report is prepared strictly for private circulation only to clients of PT Mirae Asset Sekuritas Indonesia (MASI). It is purposed only to person having professional experience in matters relating to investments. The information contained in this report has been taken from sources which we deem reliable. No warranty (express or implied) is made to the accuracy or completeness of the information. All opinions and estimates included in this report constitute our judgments as of this date, without regards to its fairness, and are subject to change without notice. However, none of MASI and/or its affiliated companies and/or their respective employees and/or agents makes any representation or warranty (express or implied) or accepts any responsibility or liability as to, or in relation to, the accuracy or completeness of the information and opinions contained in this report or as to any information contained in this report or any other such information or opinions remaining unchanged after the issue thereof. We expressly disclaim any responsibility or liability (express or implied) of MASI, its affiliated companies and their respective employees and agents whatsoever and howsoever arising (including, without limitation for any claims, proceedings, action, suits, losses, expenses, damages or costs) which may be brought against or suffered by any person as a results of acting in reliance upon the whole or any part of the contents of this report and neither MASI, its affiliated companies or their respective employees or agents accepts liability for any errors, omissions or misstatements, negligent or otherwise, in the report and any liability in respect of the report or any inaccuracy therein or omission there from which might otherwise arise is hereby expresses disclaimed.
This document is not an offer to sell or a solicitation to buy any securities. This firms and its affiliates and their officers and employees may have a position, make markets, act as principal or engage in transaction in securities or related investments of any company mentioned herein, may perform services for or solicit business from any company mentioned herein, and may have acted upon or used any of the recommendations herein before they have been provided to you. © PT Mirae Asset Sekuritas Indonesia 2016.