Taye Shim +62-21-515-3281 [email protected] To subscribe to our Daily Focus, please contact us at [email protected]
Mirae Asset Sekuritas Indonesia
May 5, 2017
Buy high, sell higher
Past performance is no guarantee of future result…
Petuah umum mengatakan bahwa investor tidak harus mendasarkan ekspektasi investasi mereka berdasarkan kinerja masa lalu. Investor harus sadar bahwa kenaikan/penurunan harga tidak akan berlanjut selamanya; Maka investor seharusnya tidak membuat keputusan investasi yang hanya berdasarkan tren.
…however, meaningfully deteriorating future expected returns
Indeks Harga Saham Gabungan (IHSG), indeks naik 7,0% YTD, naik 17,6% YoY, dan naik 34,5% dalam 5 tahun terakhir. Tampaknya jelas bahwa IHSG masih dalam siklus ekspansifnya, terbukti dengan historical high baru-baru ini (26 April 2017 di 5.726.5pt). Meskipun sebagian besar investor tidak mendasarkan ekspektasi investasi mereka berdasarkan kinerja masa lalu, kami menilai kinerja IHSG di masa lalu membatasi ekspektasi keuntungan investor (limited upside). Seiring dengan ekspektasi keuntungan yang terbatas, investor cenderung untuk take profit. Hal ini terutama berlaku bagi investor lokal, karena mereka secara aktif sell on strength, sementara investor asing masih terus membeli. Baik investor lokal maupun asing membuat keputusan investasinya berdasarkan asumsi rasional.
Past data is no guarantee for the future; but that’s all we have
Data masa lalu adalah satu-satunya hal yang kita miliki. Analis menggunakan data
"masa lalu" (historis) untuk memproyeksikan pendapatan dan dividen masa depan;
Investor akan melihat kinerja historis operasional perusahaan untuk memprediksi performa mereka di masa depan dan untuk melihat mengapa mereka diperdagangkan premium/diskon relatif terhadap pesaing mereka.
We remain bullish on JCI
Kami mengharapkan tren yang baik untuk terus berlanjut. Rilis pendapatan baru- baru ini (1Q17; "masa lalu") menunjukkan fakta bahwa pendapatan masih cenderung dalam mode ekspansi dan valuasinya tetap berada di bawah rata-rata LT historis ("masa lalu"). Meskipun kinerja masa lalu bukan merupakan indikasi terhadap masa depan, kami yakin bahwa data historis memberikan informasi yang berarti untuk membuat keputusan investasi.
Market Index
Last Trade Chg (%) MoM YoY
JCI 5,669.4 0.4 -0.5 17.1
MSCI Indonesia 26.4 0.3 -0.5 17.7
MSCI EM 980.1 -0.6 1.7 21.8
HANG SENG 24,683.9 0.0 1.2 20.8
KOSPI 2,219.7 1.0 2.7 12.3
FTSE 7,248.1 0.2 -1.3 18.3
DJIA 20,951.5 0.0 1.5 18.7
NASDAQ 6,075.3 0.0 3.5 28.7
Valuation
2017F P/E (x) P/B (x) ROE (%)
JCI 16.2 2.5 18.3
Key Rates
Last Trade Chg (bps) MoM YoY
BI 7-Day RR 4.75 0 0 -50*
3yr 6.59 0 -16 -75
10yr 7.06 1 1 -73
*since introduced in Aug 2016
FX
Last Trade Chg (%) MoM YoY
USD/IDR 13,328.00 0.2 -0.2 0.4
USD/KRW 1,130.80 0.0 0.8 -2.0
USD/JPY 112.46 -0.3 1.6 4.8
USD/CNY 6.90 0.0 0.2 6.0
Commodities
Last Trade Chg (%) MoM YoY
WTI 45.5 -4.8 -11.8 -4.2
Gold 1,228.2 -0.8 -2.2 -3.9
Coal 78.0 -8.0 -13.1 53.5
Palm Oil 2,730.0 -1.3 -5.8 3.6
Rubber 168.3 0.0 -4.4 20.1
Nickel 9,015.0 -2.3 -12.4 -0.1
Copper 5,543.0 -1.0 -6.0 15.8
Tin 19,850.0 -0.2 -0.6 14.3
JCI Index VS MSCI Emerging Markets
650 800 950 1,100
3,500 4,500 5,500
05/13 05/14 05/15 05/16 05/17
JCI MSCI EM (pt)
(pt)
800 950 1,100
4,500 5,500
(pt) JCI MSCI EM (pt)
Mirae Asset Sekuritas Indonesia cartoon
Local flashes
PGAS: PGN membagi Dividen 45% dari laba. PT Perusahaan Gas Negara Tbk (PGAS) akan membagi dividen total Rp 1,82 triliun atau Rp 75,18 per saham kepada pemegang saham. Nilai pembayaran dividen ini setara dengan 45% laba bersih PGAS tahun lalu.
Meski membagi laba besar, PGAS masih perlu dana ekspansi. PGAS mematok belanja modal atau capital expenditure (capex) US$ 500 juta secara konsolidasi tahun ini.
(Kontan)
BWPT: Eagle Plantations rampungkan pabrik baru. PT Eagle High Plantation Tbk (BWPT) akan fokus pada penyelesaian pabrik pengolahan kelapa sawit (PKS) di Kabupaten Keerom, Papua. Pabrik ini akan menjadi pabrik kesembilan BWPT. Pabrik berkapasitas pengolahan 45 ton tandan buah segar (TBS) per jam atau 270.000 ton per tahun ini ditargetkan beroperasi tahun depan. Kapasitas produksi pabrik ini bisa ditingkatkan menjadi 90 ton TBS per jam. (Kontan)
MAPI: Mitra Adiperkasa siap buka 200 gerai baru. PT Mitra Adiperkasa Tbk (MAPI) membukukan pendapatan Rp 3,62 triliun di kuartal satu, naik 14,20% ketimbang periode yang sama tahun lalu, yakni Rp 3,16 triliun. Laba MAPI di akhir Maret lalu mencapai Rp 58,62 miliar, melonjak 281,57% jika dibandingkan dengan tiga bulan pertama tahun lalu. Fetty Kwartati, Head of Corporate Communications MAPI, mengatakan, pihaknya berencana membuka sekitar 200 toko tahun ini. (Kontan)
WOMF: Penjualan WOM Finance terganjal. Harga saham PT Wahana Ottomitra Multiartha Tbk (WOMF) atau WOM Finance Kamis kemarin (4/5) mendadak longsor hingga 20,71% dari hari sebelumnya menjadi Rp 157 per saham. Kemarin, Maybank Indonesia mengumumkan perkembangan terbaru rencana penjualan dan pengalihan 68,55% saham WOMF kepada PT Reliance Capital Management. Di luar dugaan, perjanjian pembelian saham bersyarat atau conditional shares purchase agreement (CSPA) atas WOM Finance antara Maybank dengan Reliance yang ditandatangani 11 Januari 2017 lalu, batal terlaksana. penyebab gagalnya transaksi ini karena hingga batas waktu 30 April 2017, sejumlah persyaratan pendahuluan yang diperlukan untuk merealisasikan CSAP belum dapat terpenuhi. (Kontan)
LPCK: Lippo bangun “Meikarta” senilai Rp278 triliun. Grup Lippo, mengumumkan pembangunan kota baru berskala internasional dengan nama visioner "MEIKARTA"
dengan total nilai proyek melebihi Rp278 triliun. Ini merupakan proyek investasi Lippo yang terbesar yang pernah dikerjakan selama 67 tahun berdirinya Lippo. Menurut keterangan Lippo, lokasi kota berada di jantung ekonomi RI di koridor Jakarta-Bandung.
Kota raksasa modern Meikarta berada di tengah tengah koridor ini dan di kelilingi beberapa kota baru seperti Lippo Cikarang, Jababeka, MM2100. (Iqplus)
TRAM: Trada Maritime raih laba US$223,61 ribu hingga Maret 2017. PT Trada Maritime Tbk (TRAM) meraih laba sebesar US$223,61 ribu hingga periode 31 Maret 2017 usai mencatat rugi US$1,01 juta di periode sama tahun sebelumnya. Laporan keuangan perseroan menyebutkan, pendapatan usaha turun menjadi US$5,65 juta dari pendapatan US$7,53 juta tahun sebelumnya dan laba bruto turun menjadi US$1,68 juta dari laba bruto US$2,20 juta tahun sebelumnya. (Iqplus)
KBLM: Kabelindo Murni beli 99% saham PT Aruna Solar Indonesia. PT Kabelindo Murni Tbk (KBLM) telah membeli sebanyak 580 saham PT Aruna Solar Indonesia bersasarkan Akta Pernyataan Pemegang Saham pada 2 Mei 2017 yang telah ditegaskan dihadapan notaris Ronaldie Christie di Tangerang. Menurut keterangan Veronika Lukman, Direktur Perseroan, transaksi dilakukan dengan nilai Rp580 juta dimana nilai tersebut tidak melebihi dari 0,5% dari modal dasar perseroan yang sebesar Rp211,4 miliar. (Iqplus)
Technical analysis
Tasrul +62-21-515-1140 [email protected] Jakarta Composite Index (JCI) – Tendency to rise
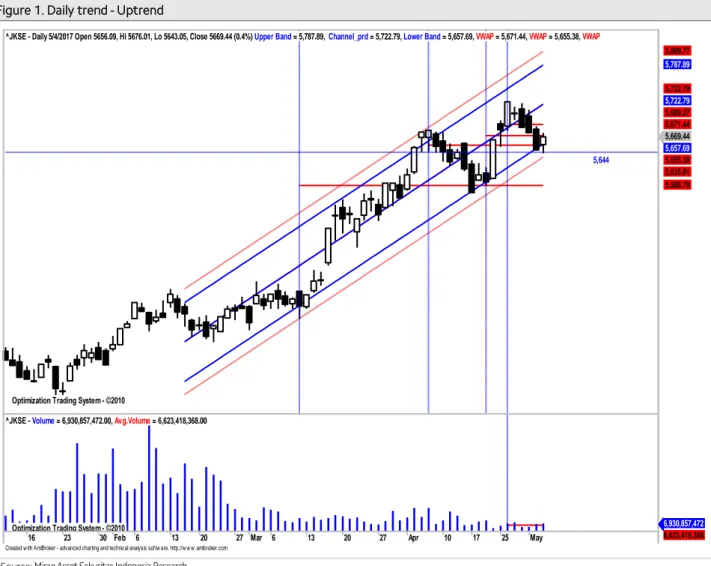
IHSG akan coba naik mendekati center line pada uptrend channel.
IHSG saat masih dalam pola uptrend jangka pendek relatif valid yang dimulai sejak selama 51 hari terakhir dengan r-squared = 0.8964 dan bergerak normal dalam rentang +/-1.63 std.deviasi dari centerline. Peluang IHSG bergerak di luar pergerakan normal sekitar 10.36% atau sekitar 5 bar chart. Volatilitas normal pergerakan IHSG saat ini sebesar +/-0.42% atau sekitar +/- 23.9 point. sebagaimana terlihat pada Figure 1.
Summary
Item Data Item Data
Close (May 4, 2017) 5,669.4 (+0.4%) Normal trading range 5,655-5,689 Average index performance (%) 3.13 Target
Period 51 - Daily 5,681
r-squared 0.8964 - Weekly 5,715
Volatility (+/-, %) 0.42 - Monthly 5,793 Volatility (+/-, point) 23.9 Stop loss 5,644 Source: Mirae Asset Sekuritas Indonesia Research
Figure 1. Daily trend - Uptrend
Source: Mirae Asset Sekuritas Indonesia Research
Created w ith AmiBroker - advanced charting and technical analysis softw are. http://w w w .amibroker.com Optimization Trading System - ©2010
Optimization Trading System - ©2010 Optimization Trading System - ©2010 Optimization Trading System - ©2010 Optimization Trading System - ©2010 Optimization Trading System - ©2010
5,644
^JKSE - Daily 5/4/2017 Open 5656.09, Hi 5676.01, Lo 5643.05, Close 5669.44 (0.4%) Upper Band = 5,787.89, Channel_prd = 5,722.79, Lower Band = 5,657.69, VWAP = 5,671.44, VWAP = 5,655.38, VWAP
5,669.44 5,657.69 5,655.38 5,635.81 5,588.78 5,671.44 5,689.27 5,722.79 5,722.79 5,787.89 5,809.77
16 23 30 Feb 6 13 20 27 Mar 6 13 20 27 Apr 10 17 25 May
Optimization Trading System - ©2010
^JKSE - Volume = 6,930,857,472.00, Avg.Volume = 6,623,418,368.00
6,930,857,472 6,623,418,368
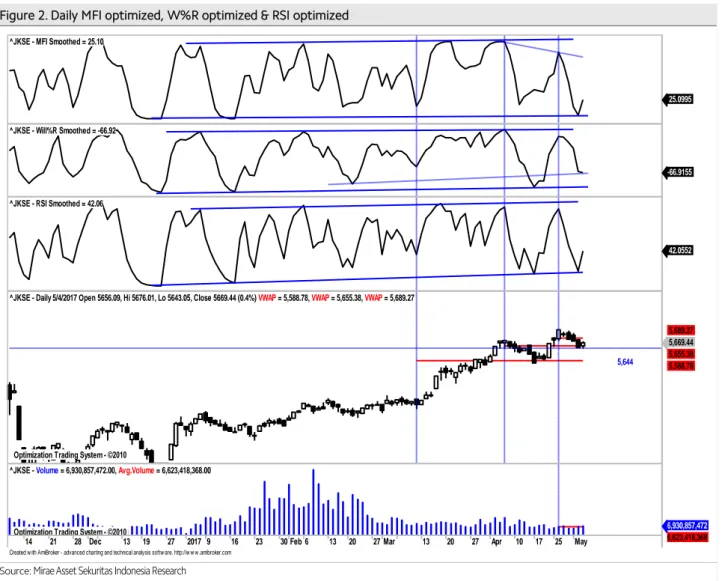
Aliran dana masuk dan volatilitasindeks naik masih terlihat.
Pada Figure 2, terlihat dari hasil optimalisasi terakhir, koreksi indikator MFI optimized, indikator W%R optimized dan RSI optimized cenderung naik dengan volume sekitar rata-rata dengan demikian potensi kenaikkan masih terlihat .Daily resistance di 5,689 dan daily support di 5,655. Stop loss level di 5,644.
Figure 2. Daily MFI optimized, W%R optimized & RSI optimized
Source: Mirae Asset Sekuritas Indonesia Research
Created w ith AmiBroker - advanced charting and technical analysis softw are. http://w w w .amibroker.com
^JKSE - MFI Smoothed = 25.10
25.0995
^JKSE - Will%R Smoothed = -66.92
-66.9155
^JKSE - RSI Smoothed = 42.06
42.0552
Optimization Trading System - ©2010 Optimization Trading System - ©2010 Optimization Trading System - ©2010
5,644
^JKSE - Daily 5/4/2017 Open 5656.09, Hi 5676.01, Lo 5643.05, Close 5669.44 (0.4%) VWAP = 5,588.78, VWAP = 5,655.38, VWAP = 5,689.27
5,669.44 5,655.38 5,588.78 5,689.27
14 21 28 Dec 13 19 27 2017 9 16 23 30 Feb 6 13 20 27 Mar 13 20 27 Apr 10 17 25 May
Optimization Trading System - ©2010
^JKSE - Volume = 6,930,857,472.00, Avg.Volume = 6,623,418,368.00
6,930,857,472 6,623,418,368
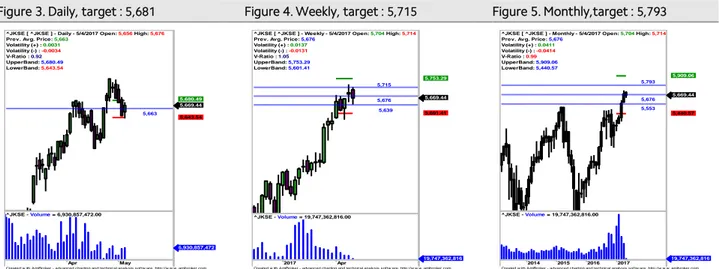
IHSG akan coba bertahan sekitar rata-rata masing-masing periode.
Untuk mampu naik lebih lanjut IHSG saat ini harus mampu bertahan diatas rata-rata masing-masing periode (positive area) sebagaimana terlihat pada Figure 3,4 dan 5.
Figure 3. Daily, target : 5,681 Figure 4. Weekly, target : 5,715 Figure 5. Monthly,target : 5,793
x
Source: Mirae Asset Sekuritas Indonesia Research Source: Mirae Asset Sekuritas Indonesia Research Source: Mirae Asset Sekuritas Indonesia Research
Created w ith AmiBroker - advanced charting and technical analysis sof tw are. http://w w w .amibroker.com 5,663
^JKSE [ ^JKSE ] - Daily - 5/4/2017 Open: 5,656 High: 5,676 Prev. Avg. Price: 5,663
Volatility (+) : 0.0031 Volatility (-) : -0.0034 V-Ratio : 0.92 UpperBand: 5,680.49 LowerBand: 5,643.54
5,669.44 5,643.54 5,680.49
Apr May
^JKSE - Volume = 6,930,857,472.00
6,930,857,472
Created w ith AmiBroker - advanced charting and technical analysis sof tw are. http://w w w .amibroker.com 5,676
5,639 5,715
^JKSE [ ^JKSE ] - Weekly - 5/4/2017 Open: 5,704 High: 5,714 Prev. Avg. Price: 5,676
Volatility (+) : 0.0137 Volatility (-) : -0.0131 V-Ratio : 1.05 UpperBand: 5,753.29 LowerBand: 5,601.41
5,669.44
5,601.41 5,753.29
2017 Apr
^JKSE - Volume = 19,747,362,816.00
19,747,362,816
Created w ith AmiBroker - advanced charting and technical analysis sof tw are. http://w w w .amibroker.com 5,676 5,793
5,553
^JKSE [ ^JKSE ] - Monthly - 5/4/2017 Open: 5,704 High: 5,714 Prev. Avg. Price: 5,676
Volatility (+) : 0.0411 Volatility (-) : -0.0414 V-Ratio : 0.99 UpperBand: 5,909.06 LowerBand: 5,440.57
5,669.44
5,440.57 5,909.06
2014 2015 2016 2017
^JKSE - Volume = 19,747,362,816.00
19,747,362,816
Stocks on our focus list
Bank Mandiri (BMRI) – Trading Buy
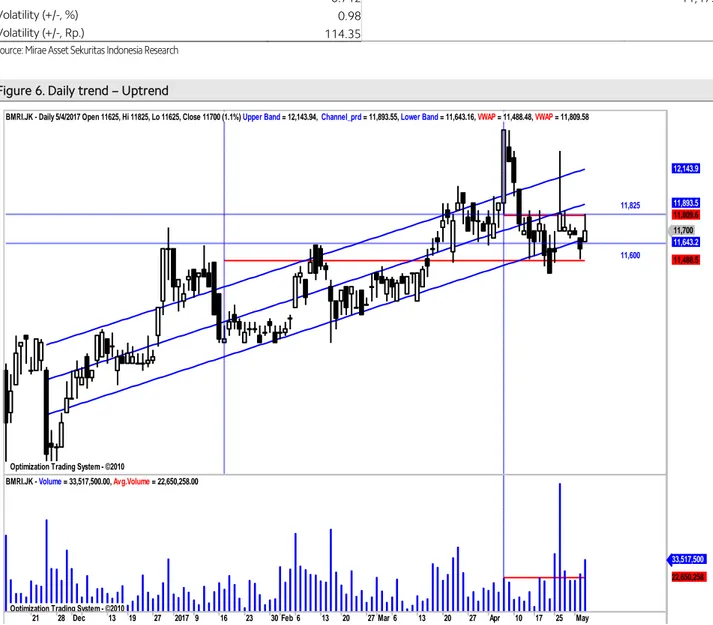
Harga akan coba naik mendekati center line pada uptrend channel.
Secara umum harga saham ini masih bergerak pada uptrend channel yang masih relatif valid (r-squared = 0.712) selama 107 hari terakhir yang bergerak normal dalam rentang +/- 1.06 std.deviasi dari center line. Peluang harga keluar dari pergerakan normal sekitar 28.84 % (sekitar 30 bar chart ). Volatilitas normal pergerakkan harga saham ini sepanjang uptrend channel sebesar +/- 0.98 % atau sekitar +/- 114.35 (potensi naik dan turun secara normal maksimum/minimum sebesar 115 rupiah) dari level penutupan terakhir sebagaimana terlihat pada Figure 6.
Summary
Item Data Item Data
Close (May 4, 2017) 11,700(+1.1%) Normal trading range 11,600-11,900
Relative Avg. Price performance to JCI (%) 0.02 Target
β (beta) 2.12 - Daily 11,825
Corelation 0.88 - Weekly 11,875
Period 107 - Monthly 12,250
r-squared 0.712 Stop loss 11,475
Volatility (+/-, %) 0.98
Volatility (+/-, Rp.) 114.35
Source: Mirae Asset Sekuritas Indonesia Research
Figure 6. Daily trend – Uptrend
Source: Mirae Asset Sekuritas Indonesia Research
Created w ith AmiBroker - advanced charting and technical analysis softw are. http://w w w .amibroker.com Optimization Trading System - ©2010
Optimization Trading System - ©2010 Optimization Trading System - ©2010
11,825
11,600 BMRI.JK - Daily 5/4/2017 Open 11625, Hi 11825, Lo 11625, Close 11700 (1.1%) Upper Band = 12,143.94, Channel_prd = 11,893.55, Lower Band = 11,643.16, VWAP = 11,488.48, VWAP = 11,809.58
11,700 11,643.2 11,488.5 11,809.6 11,893.5 12,143.9
21 28 Dec 13 19 27 2017 9 16 23 30 Feb 6 13 20 27 Mar 6 13 20 27 Apr 10 17 25 May
Optimization Trading System - ©2010
BMRI.JK - Volume = 33,517,500.00, Avg.Volume = 22,650,258.00
33,517,500 22,650,258
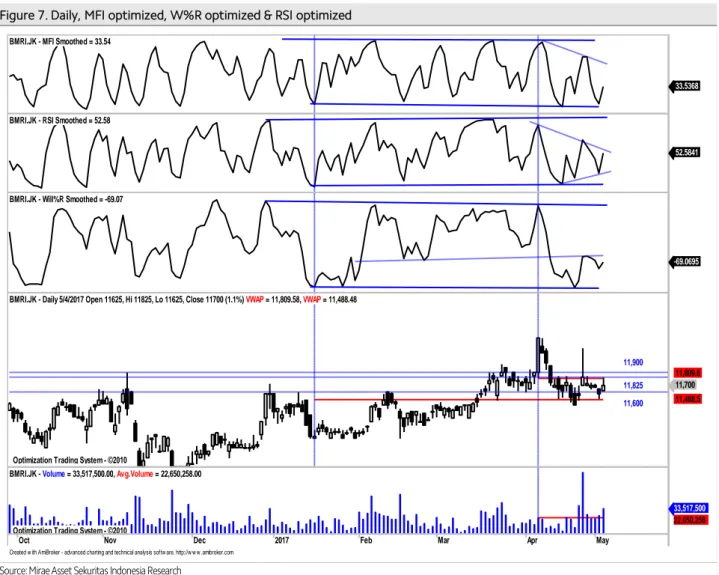
Aliran dana masuk dan volatilitas harga naik masih terlihat.
Pada Figure 7, terlihat dari hasil optimalisasi terakhir, indikator MFI Optimized , indikator W%R Optimized dan RSI Optimized saat ini cenderung naik dengan volume tembus rata-rata. Hal ini mengindikasikan potensi kenaikkan lebih lanjut. Daily resistance terdekat di 11,825 sebelum lanjut ke 11,900. Daily support terdekat di 11,600.Cut loss level di 11,475.
Figure 7. Daily, MFI optimized, W%R optimized & RSI optimized
Source: Mirae Asset Sekuritas Indonesia Research
Created w ith AmiBroker - advanced charting and technical analysis softw are. http://w w w .amibroker.com BMRI.JK - MFI Smoothed = 33.54
33.5368
BMRI.JK - RSI Smoothed = 52.58
52.5841
BMRI.JK - Will%R Smoothed = -69.07
-69.0695
Optimization Trading System - ©2010 Optimization Trading System - ©2010
11,600 11,825 11,900 BMRI.JK - Daily 5/4/2017 Open 11625, Hi 11825, Lo 11625, Close 11700 (1.1%) VWAP = 11,809.58, VWAP = 11,488.48
11,700 11,488.5 11,809.6
Oct Nov Dec 2017 Feb Mar Apr May
Optimization Trading System - ©2010
BMRI.JK - Volume = 33,517,500.00, Avg.Volume = 22,650,258.00
33,517,500 22,650,258
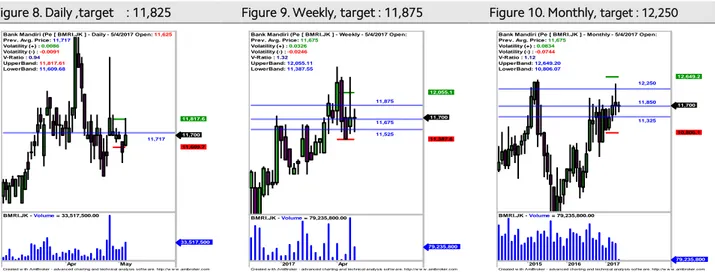
Harga akan coba naik dan bertahan diatas rata-rata pada masing-masing periode.
Untuk naik lebih lanjut harga harus mampu bertahan minimal sekitarrata-rata dengan target kenaikkan terdekat ke resistance masing-masing periode sebagaimana terlihat pada Figure 8,9 dan 10.
Figure 8. Daily ,target : 11,825 Figure 9. Weekly, target : 11,875 Figure 10. Monthly, target : 12,250
Source: Mirae Asset Sekuritas Indonesia Research Source: Mirae Asset Sekuritas Indonesia Research Source: Mirae Asset Sekuritas Indonesia Research
Created w ith AmiBroker - advanced charting and technical analysis sof tw are. http://w w w .amibroker.com 11,717 Bank Mandiri (Pe [ BMRI.JK ] - Daily - 5/4/2017 Open: 11,625 Prev. Avg. Price: 11,717
Volatility (+) : 0.0086 Volatility (-) : -0.0091 V-Ratio : 0.94 UpperBand: 11,817.61 LowerBand: 11,609.68
11,700 11,609.7 11,817.6
Apr May
BMRI.JK - Volume = 33,517,500.00
33,517,500
Created w ith AmiBroker - advanced charting and technical analysis sof tw are. http://w w w .amibroker.com 11,850 12,250
11,325 Bank Mandiri (Pe [ BMRI.JK ] - Monthly - 5/4/2017 Open:
Prev. Avg. Price: 11,675 Volatility (+) : 0.0834 Volatility (-) : -0.0744 V-Ratio : 1.12 UpperBand: 12,649.20 LowerBand: 10,806.07
11,700
10,806.1 12,649.2
2015 2016 2017
BMRI.JK - Volume = 79,235,800.00
79,235,800 Created w ith AmiBroker - advanced charting and technical analysis sof tw are. http://w w w .amibroker.com
11,675 11,875
11,525 Bank Mandiri (Pe [ BMRI.JK ] - Weekly - 5/4/2017 Open:
Prev. Avg. Price: 11,675 Volatility (+) : 0.0326 Volatility (-) : -0.0246 V-Ratio : 1.32 UpperBand: 12,055.11 LowerBand: 11,387.55
11,700
11,387.6 12,055.1
2017 Apr
BMRI.JK - Volume = 79,235,800.00
79,235,800
Bank Tabungan Negara (BBTN) – Trading Buy
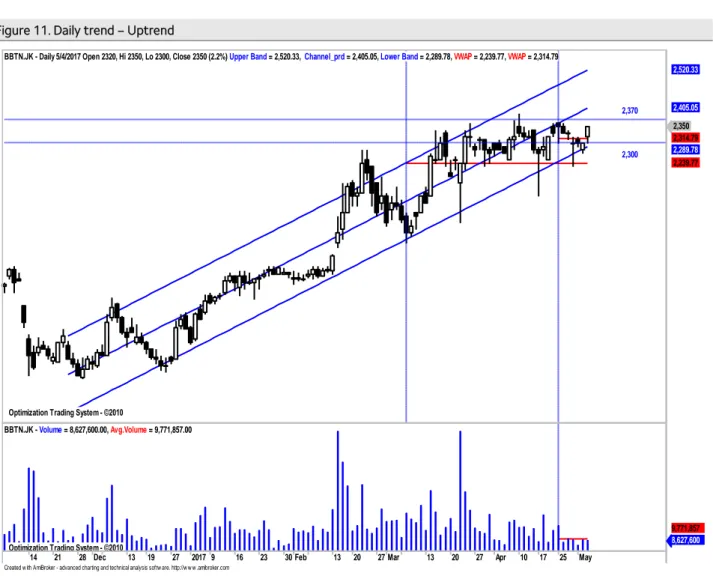
Harga akan coba naik mendekati center line pada uptrend channel .
Secara umum harga saham ini juga masih bergerak dalam pola uptrend channel yang masih relatif valid (r-squared = 0,932) selama 107 hari terakhir dan bergerak normal dalam rentang +/- 1.84 std.deviasi dari center line. Peluang harga keluar dari pergerakan normal sekitar 6.59 % (sekitar 7 bar chart ). Volatilitas normal pergerakan harga saham ini sepanjang uptrend channel sebesar +/- 1.83 % atau sekitar +/- 42.90 (potensi naik dan turun secara normal maksimum/minimum sebesar 40-50 rupiah) dari level penutupan terakhir sebagaimana terlihat pada Figure 11.
Summary
Item Data Item Data
Close (May 4, 2017) 2,350 (+2.2%) Normal trading range 2,300-2,370 Relative Avg. Price performance to JCI (%) 79.82 Target
β (beta) 1.62 - Daily 2,370
Corelation 0.65 - Weekly 2,400
Period 107 - Monthly 2,510
r-squared 0.934 Stop loss 2,290
Volatility (+/-, %) 1.83
Volatility (+/-, Rp.) 42.90
Source: Mirae Asset Sekuritas Indonesia Research
Figure 11. Daily trend – Uptrend
Source: Mirae Asset Sekuritas Indonesia Research
Created w ith AmiBroker - advanced charting and technical analysis softw are. http://w w w .amibroker.com Optimization Trading System - ©2010
Optimization Trading System - ©2010 Optimization Trading System - ©2010
2,300 2,370 BBTN.JK - Daily 5/4/2017 Open 2320, Hi 2350, Lo 2300, Close 2350 (2.2%) Upper Band = 2,520.33, Channel_prd = 2,405.05, Lower Band = 2,289.78, VWAP = 2,239.77, VWAP = 2,314.79
2,350 2,314.79 2,289.78 2,239.77 2,405.05 2,520.33
14 21 28 Dec 13 19 27 2017 9 16 23 30 Feb 13 20 27 Mar 13 20 27 Apr 10 17 25 May
Optimization Trading System - ©2010
BBTN.JK - Volume = 8,627,600.00, Avg.Volume = 9,771,857.00
8,627,600 9,771,857
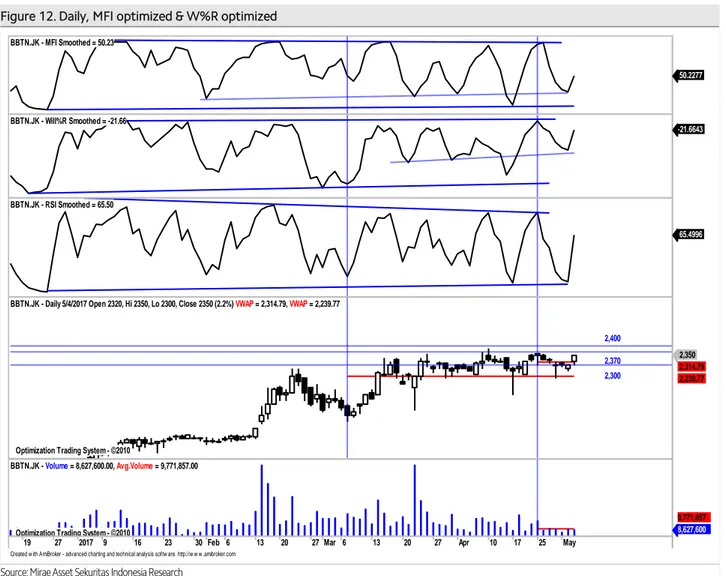
Aliran dana masuk dan volatilitas harga naik masih terlihat.
Pada Figure 12, terlihat dari hasil optimalisasi indikator MFI optimized ,indikator W%R optimized dan RSI Optimized saat ini cenderung naik lebih lanjut dengan volume sekitar rata-rata. Hal ini mengindikasikan potensi kenaikkan masih terlihat. Daily resistance di 2,370 sebelum lanjut ke 2,400.Dailysupport saat ini di 2,300.Stop loss level di 2,290..
Figure 12. Daily, MFI optimized & W%R optimized
Source: Mirae Asset Sekuritas Indonesia Research
Created w ith AmiBroker - advanced charting and technical analysis softw are. http://w w w .amibroker.com BBTN.JK - MFI Smoothed = 50.23
50.2277
BBTN.JK - Will%R Smoothed = -21.66
-21.6643
BBTN.JK - RSI Smoothed = 65.50
65.4996
Optimization Trading System - ©2010 Optimization Trading System - ©2010
2,300 2,370 2,400 BBTN.JK - Daily 5/4/2017 Open 2320, Hi 2350, Lo 2300, Close 2350 (2.2%) VWAP = 2,314.79, VWAP = 2,239.77
2,350 2,314.79 2,239.77
19 27 2017 9 16 23 30 Feb 6 13 20 27 Mar 6 13 20 27 Apr 10 17 25 May
Optimization Trading System - ©2010
BBTN.JK - Volume = 8,627,600.00, Avg.Volume = 9,771,857.00
8,627,600 9,771,857
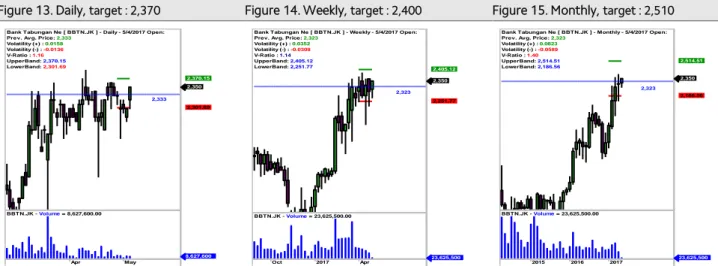
Harga saat ini akan coba naik dan bertahan diatas rata-rata pada masing-masing periode.
Untuk naik lebih lanjut harga harus mampu bertahan minimal sekitar lower band dengan target kenaikkan terdekat ke resistance masing-masing periode sebagaimana sebagaimana terlihat pada Figure 14,15 dan 16.
Figure 13. Daily, target : 2,370 Figure 14. Weekly, target : 2,400 Figure 15. Monthly, target : 2,510 x
Source: Mirae Asset Sekuritas Indonesia Research Source: Mirae Asset Sekuritas Indonesia Research Source: Mirae Asset Sekuritas Indonesia Research
Created w ith AmiBroker - advanced charting and technical analysis sof tw are. http://w w w .amibroker.com 2,333 Bank Tabungan Ne [ BBTN.JK ] - Daily - 5/4/2017 Open:
Prev. Avg. Price: 2,333 Volatility (+) : 0.0158 Volatility (-) : -0.0136 V-Ratio : 1.16 UpperBand: 2,370.15 LowerBand: 2,301.69
2,350
2,301.69 2,370.15
Apr May
BBTN.JK - Volume = 8,627,600.00
8,627,600
Created w ith AmiBroker - advanced charting and technical analysis sof tw are. http://w w w .amibroker.com 2,323 Bank Tabungan Ne [ BBTN.JK ] - Weekly - 5/4/2017 Open:
Prev. Avg. Price: 2,323 Volatility (+) : 0.0352 Volatility (-) : -0.0308 V-Ratio : 1.14 UpperBand: 2,405.12 LowerBand: 2,251.77
2,350
2,251.77 2,405.12
Oct 2017 Apr
BBTN.JK - Volume = 23,625,500.00
23,625,500
Created w ith AmiBroker - advanced charting and technical analysis sof tw are. http://w w w .amibroker.com 2,323
Bank Tabungan Ne [ BBTN.JK ] - Monthly - 5/4/2017 Open:
Prev. Avg. Price: 2,323 Volatility (+) : 0.0823 Volatility (-) : -0.0589 V-Ratio : 1.40 UpperBand: 2,514.51 LowerBand: 2,186.56
2,350
2,186.56 2,514.51
2015 2016 2017
BBTN.JK - Volume = 23,625,500.00
23,625,500
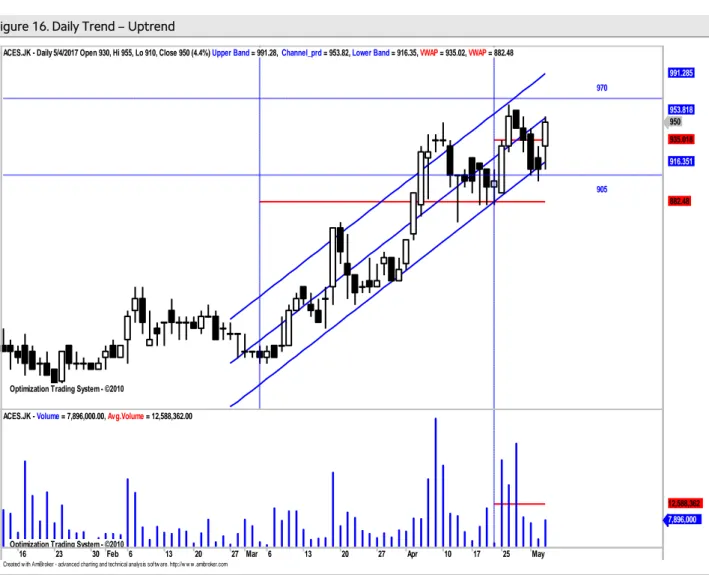
Ace Hardware Indonesia (ACES) – Trading Buy
Harga akan coba naik dan tembus center line pada uptrend channel.
Secara umum harga saham ini akan coba naik dan tembus center line pada uptrend channel yang masih relatif valid dengan r-squared = 0.862 selama 44 hari terakhir dan bergerak normal dalam rentang +/-1.48 std.deviasi dari centerline. Peluang harga keluar dari pergerakan normalnya sekitar 13.84 % (sekitar 6 bar chart ). Volatilitas normal pergerakan harga saham ini sepanjang uptrend channel sebesar +/- 2.01 % atau sekitar +/- 19.11 (potensi naik dan turun secara normal maksimum/minimum sebesar 20 rupiah) dari level penutupan terakhir sebagaimana terlihat pada Figure 16.
Summary
Item Data Item Data
Close (May 4, 2017) 950 (+4.4%) Normal trading range 905-970 Relative Avg. Price performance to JCI (%) 9.20 Target
β (beta) 1.97 - Daily 960
Corelation 0.92 - Weekly 970
Period 44 - Monthly 1,020
r-squared 0.862 Stop loss 905
Volatility (+/-, %) 2.01
Volatility (+/-, Rp.) 19.11
Source: Mirae Asset Sekuritas Indonesia Research
Figure 16. Daily Trend – Uptrend
Source: Mirae Asset Sekuritas Indonesia Research
Created w ith AmiBroker - advanced charting and technical analysis softw are. http://w w w .amibroker.com Optimization Trading System - ©2010
Optimization Trading System - ©2010 Optimization Trading System - ©2010
970
905 ACES.JK - Daily 5/4/2017 Open 930, Hi 955, Lo 910, Close 950 (4.4%) Upper Band = 991.28, Channel_prd = 953.82, Lower Band = 916.35, VWAP = 935.02, VWAP = 882.48
950
935.018
916.351
882.48 953.818 991.285
16 23 30 Feb 6 13 20 27 Mar 6 13 20 27 Apr 10 17 25 May
Optimization Trading System - ©2010
ACES.JK - Volume = 7,896,000.00, Avg.Volume = 12,588,362.00
7,896,000 12,588,362
Aliran dana masuk dan volatilitas harga naik masih terlihat.
Pada Figure 17, terlihat dari hasil optimalisasi, indikator MFI Optimized , W%R Optimized dan RSI Optimized cenderung naik dengan volume tembus rata-rata.
Dengan demikian diperkirakan potensi kenaikkan masih terlihat. Perkiraan daily resistance terdekat ke 970. Dailysupport terdekat di 905 yang sekaligus sebagai cut loss level.
Figure 17. Daily MFI Optimized , W%R Optimized & RSI Optimized
Source: Mirae Asset Sekuritas Indonesia Research
Created w ith AmiBroker - advanced charting and technical analysis softw are. http://w w w .amibroker.com ACES.JK - MFI Smoothed = 48.93
48.9275
ACES.JK - Will%R Smoothed = -27.23
-27.2303
ACES.JK - RSI Smoothed = 55.14
55.1419
Optimization Trading System - ©2010 Optimization Trading System - ©2010
905 970 ACES.JK - Daily 5/4/2017 Open 930, Hi 955, Lo 910, Close 950 (4.4%) VWAP = 935.02, VWAP = 882.48
950 935.018
882.48
Nov Dec 2017 Feb Mar Apr May
Optimization Trading System - ©2010
ACES.JK - Volume = 7,896,000.00, Avg.Volume = 12,588,362.00
7,896,000 12,588,362
Harga akan coba naik dan bertahan diatas rata-ratapada masing-masing periode.
Untuk naik lebih lanjut harga harus mampu bertahan minimal sekitarrata-rata dengan target kenaikkan terdekat ke resistance masing-masing periode sebagaimana terlihat pada Figure 18,19 dan 20.
Figure 18. Daily, target : 960 Figure 19. Weekly, target : 970 Figure 20. Monthly, target : 1,020
Source: Mirae Asset Sekuritas Indonesia Research Source: Mirae Asset Sekuritas Indonesia Research Source: Mirae Asset Sekuritas Indonesia Research
analyzed by : Tasrul, [email protected], +62-21- 5151140
Relative Avg.Price Performance to JCI (%) : Persentase kenaikan harga saham dari rata-rata sejak IHSG memulai uptrend-nya β (beta) : Indikator sensitivitas harga saham terhadap IHSG, beta diatas 1 berarti harga makin sensitif terhadap pergerakan IHSG dan sebaliknya
Correlation : Ukuran kuat hubungan (korelasi) pergerakan harga saham dibanding dengan pergerakan IHSG
Period : Periode uptrend / downtrend yang valid dari pergerakan harga saham
r-squared : Koefisien determinasi, menunjukkan persentase gerakan yang dapat dijelaskan dengan regresi linier.Nilai R2 terletak antara 0 – 1, dan kecocokan model dikatakan lebih baik kalau R2 semakin mendekati 1 (validitas uptrend atau downtrend makin valid) Volatility (+/-%) : Besaran volatilitas normal maksimal/minimal dari pergerakan harga harian selama harga saham bergerak normal pada trend channel dalam persentase.
Volatility (+/- point or Rp) : Besaran volatilitas normal maksimal/minimal dari pergerakan harga harian selama Harga saham bergerak
Buy : Beli, harga sudah menyentuh atau jatuh di bawah support dan indikator teknikal berada di oversold area.
Sell : Jual, harga sudah menyentuh atau tembus resistance normal dan indikator berada di overbought area.
BoW : Buy on Weakness, beli ketika harga sudah melemah, dimana volume tekanan jual mulai berkurang dan harga mendekatisupport, serta indikator teknikal sudah berada di oversold area.
SoS : Sell on Strength, jual ketika kenaikan harga sudah mulai terbatas dimana volume beli mulai berkurang dan harga mendekati resistance, serta indikator teknikal sudah berada di overbought area.
Trading Buy : Beli dan jual kembali secepatnya jika harga sudah mencapai level resistance terdekat, karena kenaikan harga relatif tidak stabil atau hanya sementara.
Trading Sell : Jual dan beli kembali secepatnya jika harga sudah mencapai level support terdekat karena koreksi harga relative tidak stabil atau hanya sementara.
Created w ith AmiBroker - advanced charting and technical analysis sof tw are. http://w w w .amibroker.com 935
Ace Hardware Ind [ ACES.JK ] - Daily - 5/4/2017 Open: 930 Prev. Avg. Price: 938
Volatility (+) : 0.0162 Volatility (-) : -0.0170 V-Ratio : 0.95 UpperBand: 953.53 LowerBand: 922.38
950
922.376 953.531
Apr May
ACES.JK - Volume = 7,896,000.00
7,896,000
Created w ith AmiBroker - advanced charting and technical analysis sof tw are. http://w w w .amibroker.com 935
Ace Hardware Ind [ ACES.JK ] - Weekly - 5/4/2017 Open:
Prev. Avg. Price: 935 Volatility (+) : 0.0388 Volatility (-) : -0.0323 V-Ratio : 1.20 UpperBand: 971.25 LowerBand: 904.77
950
904.77 971.253
2017 Apr
ACES.JK - Volume = 17,208,500.00
17,208,500
Created w ith AmiBroker - advanced charting and technical analysis sof tw are. http://w w w .amibroker.com 935
975
900 Ace Hardware Ind [ ACES.JK ] - Monthly - 5/4/2017 Open:
Prev. Avg. Price: 935 Volatility (+) : 0.0889 Volatility (-) : -0.0670 V-Ratio : 1.33 UpperBand: 1,018.16 LowerBand: 872.36
950
872.364 1,018.16
2015 2016 2017
ACES.JK - Volume = 17,208,500.00
17,208,500
Chart 21. JCI Vs. USD/IDR Chart 22. JCI performance (absolute vs. relative)
Source: Bloomberg, Mirae Asset Sekuritas Indonesia Note: Relative to MSCI EM Index
Source: Bloomberg, Mirae Asset Sekuritas Indonesia
Chart 23. Foreigner’s net purchase (EM) Chart 24. Energy price
Note: The latest figure for India are May 3rd, 2017
Source: Bloomberg, Mirae Asset Sekuritas Indonesia Source: Bloomberg, Mirae Asset Sekuritas Indonesia
Chart 25. Non-ferrous metal price Chart 26. Precious metal price
Source: Bloomberg, Mirae Asset Sekuritas Indonesia Source: Bloomberg, Mirae Asset Sekuritas Indonesia 13,100
13,300 13,500 13,700
4,800 5,000 5,200 5,400 5,600 5,800
2/2 3/2 3/30 4/27
(IDR)
(pt) JCI (L) USD/IDR (R)
0.4
-1.0 -0.1
17.6
1.0
-1.2 -1.3
-3.5 -8
-4 0 4 8 12 16 20
1D 1W 1M 1Y
Absolute Relative (%, %p)
(%, %p) (%, %p)
404
165
-24 -14
0
-15 798
930
131
60 20
-253 -400
-200 0 200 400 600 800 1,000
Korea Taiwan Indonesia Thailand Philippines India
1 Day 5 Days
(USDmn) (USDmn) (USDmn) (USDmn)
75 80 85 90 95 100 105 110 115
2/2 3/2 3/30 4/27
CPO WTI Coal
(D-3M=100)
80 85 90 95 100 105 110
2/2 3/2 3/30 4/27
(D-3M=100) Copper Nickel Tin
80 85 90 95 100 105 110
2/2 3/2 3/30 4/27
Silver Gold Platinum
(D-3M=100)
Table. Key valuation metrics
Company Name Ticker
Price Market Cap Price Performance (%) P/E(X)* P/B(X)* ROE(%)*
(IDR) (IDRbn) 1D 1W 1M 1Y FY16 FY17 FY16 FY17 FY16 FY17
Jakarta Composite Index JCI 5,669 6,169,789 0.4 -1.0 0.3 17.6 16.2 14.1 2.5 2.3 18.3 19.8
FINANCIALS
Bank Central Asia BBCA 17,825 439,476 0.4 -1.0 6.4 36.1 18.5 19.2 3.4 3.4 20.4 18.9
Bank Mandiri Persero BMRI 11,700 273,000 1.1 -1.1 -0.4 20.6 19.6 13.5 1.8 1.7 10.3 12.6
Bank Rakyat Indonesia Persero BBRI 13,925 343,518 5.5 5.3 6.9 34.5 10.9 12.2 1.9 2.1 20.2 18.2
Bank Negara Indonesia Persero BBNI 6,625 123,547 3.5 3.5 1.1 43.4 9.1 9.2 1.2 1.3 13.9 14.6
Bank Tabungan Negara Persero BBTN 2,350 24,887 2.2 0.9 3.1 28.4 13.3 12.2 1.0 1.2 7.6 10.1
CONSUMER
HM Sampoerna HMSP 3,870 450,151 -0.3 -0.5 -3.5 -3.2 34.8 33.2 13.0 12.6 38.6 38.5
Gudang Garam GGRM 68,000 130,838 0.3 3.1 0.4 0.1 18.4 17.2 3.1 2.9 17.3 17.9
Indofood CBP Sukses Makmur ICBP 8,600 100,292 0.0 0.9 2.4 12.1 27.8 25.8 5.7 5.1 21.8 21.0
Indofood Sukses Makmur INDF 8,475 74,414 0.0 4.3 5.0 17.7 18.3 16.5 2.4 2.3 14.7 14.8
Kalbe Farma KLBF 1,575 73,828 1.9 -1.9 -1.6 17.5 30.9 28.9 6.0 5.5 20.6 19.2
Unilever Indonesia UNVR 45,425 346,593 0.7 -0.8 2.6 0.6 46.3 48.3 62.9 62.9 134.1 137.3
AGRICULTURAL
Astra Agro Lestari AALI 14,100 27,138 -0.5 -1.9 -6.0 -5.9 14.8 14.0 1.9 1.5 14.1 11.1
PP London Sumatera Indonesia LSIP 1,370 9,347 -1.1 0.4 -7.1 -10.7 20.0 12.0 1.6 1.1 7.9 9.8
Sawit Sumbermas Sarana SSMS 1,650 15,716 -2.9 -2.9 -4.1 -8.3 22.5 21.4 3.9 3.9 18.3 18.4
INFRASTRUCTURE
XL Axiata EXCL 3,180 33,988 3.2 -1.5 2.9 -8.4 60.8 75.5 1.2 1.6 2.1 1.6
Jasa Marga JSMR 4,650 33,749 0.9 4.3 -1.3 -14.1 15.6 17.5 2.3 2.2 15.7 13.1
Perusahaan Gas Negara PGAS 2,420 58,664 3.4 -2.8 -2.8 -1.6 15.3 10.7 1.5 1.3 9.8 12.6
Tower Bersama Infrastructure TBIG 5,875 26,622 0.4 -3.3 1.7 0.4 17.4 20.6 14.3 8.3 83.6 49.3
Telekomunikasi Indonesia TLKM 4,370 440,496 0.7 -0.7 3.3 25.8 20.3 19.2 4.7 4.5 24.3 24.0
Soechi Lines SOCI 366 2,584 1.7 -7.1 -5.2 -8.5 8.2 5.5 0.9 N/A 15.9 10.1
Garuda Indonesia GIAA 344 8,905 -2.3 -8.5 -1.1 -20.7 31.7 21.2 2.6 2.6 8.6 13.2
BASIC-INDUSTRIES
Semen Indonesia SMGR 8,650 51,308 -0.9 -3.9 -5.2 -12.0 12.0 13.6 1.9 1.7 16.3 12.4
Charoen Pokphand Indonesia CPIN 3,140 51,490 -0.9 -6.0 -6.3 -16.3 22.6 15.3 3.6 3.1 16.5 21.1
Indocement Tunggal Prakarsa INTP 16,225 59,728 0.2 -3.0 -4.4 -16.4 14.6 17.1 2.2 2.1 15.5 12.7
Japfa Comfeed Indonesia JPFA 1,320 15,062 0.4 -15.1 -20.5 45.9 7.7 7.9 1.9 1.5 28.6 20.2
MINING
Indo Tambangraya Megah ITMG 18,475 20,875 2.4 -5.3 -16.8 135.4 10.4 7.6 1.5 1.6 15.0 20.1
Adaro Energy ADRO 1,615 51,657 -0.9 -11.3 -16.3 124.3 12.0 9.3 1.3 1.1 11.1 11.6
Aneka Tambang ANTM 645 15,500 -3.0 -7.9 -10.4 -16.2 298.3 56.2 1.2 0.9 0.4 2.6
Vale Indonesia INCO 2,050 20,369 -2.8 -4.7 -10.1 18.2 N/A 38.5 1.1 0.8 0.1 2.2
Tambang Batubara Bukit Asam PTBA 11,875 27,362 -4.0 -6.3 -14.3 79.9 13.1 8.9 2.5 2.1 20.5 24.9
TRADE
United Tractors UNTR 25,050 93,440 -3.3 -10.2 -14.1 76.4 15.8 14.5 1.9 2.1 12.7 14.9
AKR Corporindo AKRA 6,300 25,201 -2.3 -6.0 -2.7 6.8 23.5 20.3 3.5 3.3 15.7 16.3
Global Mediacom BMTR 585 8,306 7.3 10.4 12.5 -46.8 41.8 N/A 0.9 N/A 2.0 N/A
Matahari Department Store LPPF 15,275 44,571 2.7 9.1 16.4 -19.6 21.9 20.0 23.8 14.9 136.4 86.2
Media Nusantara Citra MNCN 1,900 27,125 2.2 8.0 3.5 -11.6 17.7 15.1 2.7 2.5 15.4 17.0
Matahari Putra Prima MPPA 880 4,733 -4.9 -7.4 -19.6 -34.1 211.4 28.8 3.3 1.9 1.6 5.0
Surya Citra Media SCMA 2,810 41,087 -0.4 -2.8 -3.4 -17.1 27.2 22.8 11.9 10.0 45.7 46.6
Siloam International Hospital SILO 13,700 17,818 -0.5 -2.1 0.0 58.2 150.3 124.5 4.5 5.5 3.5 4.6
PROPERTY
Bumi Serpong Damai BSDE 1,775 34,163 0.6 -2.7 -5.6 -1.1 18.8 14.4 1.6 1.5 9.1 10.5
Adhi Karya ADHI 2,160 7,691 0.0 -4.8 -7.7 -16.9 23.6 13.1 1.4 1.3 5.9 10.0
Alam Sutera Realty ASRI 338 6,642 0.6 -3.4 -5.1 -11.1 13.6 7.8 1.0 0.9 7.5 11.3
Ciputra Development CTRA 1,230 22,829 4.2 -4.3 1.2 -0.6 19.9 17.4 2.2 1.7 9.8 11.5
Lippo Karawaci LPKR 785 18,116 0.0 -2.5 6.8 -22.7 18.6 16.2 0.9 0.9 5.0 6.1
Pembangunan Perumahan PTPP 2,700 16,740 -4.9 -15.6 -17.4 -21.7 23.1 11.7 2.4 1.6 14.4 14.5
Pakuwon Jati PWON 675 32,508 6.3 5.5 9.8 33.7 16.3 16.0 3.1 3.0 21.0 19.9
Summarecon Agung SMRA 1,385 19,981 2.6 -1.1 0.7 -3.5 61.3 44.2 3.1 2.9 5.1 6.9
Wijaya Karya WIKA 2,230 20,003 -3.0 -4.3 -5.5 -5.9 14.4 15.8 1.8 1.5 12.9 10.4
Waskita Karya WSKT 2,290 31,084 0.0 -3.8 -3.8 -10.2 17.3 12.9 3.1 1.9 16.6 16.7
MISCELLANEOUS
Astra International ASII 8,800 356,255 -0.6 -2.5 0.3 32.3 22.1 18.0 3.0 2.9 14.2 16.4
Source: Bloomberg, Mirae Asset Sekuritas Indonesia
*Note: Valuation metrics based on Bloomberg consensus estimates
Sector performance Top 10 market cap performance
Name Index Chg (%) Ticker Price Market Cap (IDRbn) Chg (%)
Agricultural 1,793.5 -1.2 INDY IJ 1125 5,861 22.28
Mining 1,442.7 -1.6 INKP IJ 2500 13,677 9.65
Basic-Industry 604.6 0.8 SMBR IJ 3500 34,432 7.69
Miscellaneous Industry 1,486.2 -0.5 BMTR IJ 585 8,306 7.34
Consumer Goods 2,461.3 0.4 PWON IJ 675 32,508 6.3
Property & Construction 495.6 0.4 BBRI IJ 13925 343,518 5.49
Infrastructure 1,138.2 0.7 SRIL IJ 314 5,838 5.37
Finance 904.6 1.3 BTEK IJ 995 5,757 4.74
Trade 905.2 -0.5 ACES IJ 950 16,293 4.4
Composite 5,669.4 0.4 CTRA IJ 1230 22,829 4.24
Source: Bloomberg
Top 5 leading movers Top 5 lagging movers
Name Chg (%) Close Name Chg (%) Close
BBRI IJ 5.5 13,925 SMMA IJ -12.5 7,000
BBNI IJ 3.5 6,625 UNTR IJ -3.3 25,050
TLKM IJ 0.7 4,370 ASII IJ -0.6 8,800
BMRI IJ 1.1 11,700 TOWR IJ -3.9 3,750
UNVR IJ 0.7 45,425 HMSP IJ -0.3 3,870
Source: Bloomberg
Economic Calendar
Time Currency Detail Forecast Previous
3:25am CAD BOC Gov Poloz Speaks
6:30am AUD AIG Construction Index 51.2
All Day JPY Bank Holiday
8:30am AUD RBA Monetary Policy Statement
10:00am NZD Inflation Expectations q/q 1.9%
2:00pm CHF Foreign Currency Reserves 683B
3:10pm EUR Retail PMI 49.5
7:30pm CAD Employment Change 20.0K 19.4K
7:30pm CAD Unemployment Rate 6.7% 6.7%
7:30pm USD Average Hourly Earnings m/m 0.3% 0.2%
7:30pm USD Non-Farm Employment Change 194K 98K
7:30pm USD Unemployment Rate 4.6% 4.5%
9:00pm CAD Ivey PMI 62.3 61.1
10:30pm USD FOMC Member Fischer Speaks
Note: Time is based on Indonesian local time Source: Forex Factory
Disclaimers
This report is prepared strictly for private circulation only to clients of PT Mirae Asset Sekuritas Indonesia (MASI). It is purposed only to person having professional experience in matters relating to investments. The information contained in this report has been taken from sources which we deem reliable. No warranty (express or implied) is made to the accuracy or completeness of the information. All opinions and estimates included in this report constitute our judgments as of this date, without regards to its fairness, and are subject to change without notice. However, none of MASI and/or its affiliated companies and/or their respective employees and/or agents makes any representation or warranty (express or implied) or accepts any responsibility or liability as to, or in relation to, the accuracy or completeness of the information and opinions contained in this report or as to any information contained in this report or any other such information or opinions remaining unchanged after the issue thereof. We expressly disclaim any responsibility or liability (express or implied) of MASI, its affiliated companies and their respective employees and agents whatsoever and howsoever arising (including, without limitation for any claims, proceedings, action, suits, losses, expenses, damages or costs) which may be brought against or suffered by any person as a results of acting in reliance upon the whole or any part of the contents of this report and neither MASI, its affiliated companies or their respective employees or agents accepts liability for any errors, omissions or misstatements, negligent or otherwise, in the report and any liability in respect of the report or any inaccuracy therein or omission there from which might otherwise arise is hereby expresses disclaimed.
This document is not an offer to sell or a solicitation to buy any securities. This firms and its affiliates and their officers and employees may have a position, make markets, act as principal or engage in transaction in securities or related investments of any company mentioned herein, may perform services for or solicit business from any company mentioned herein, and may have acted upon or used any of the recommendations herein before they have been provided