Mimi Halimin +62-21-515-1140 [email protected] To subscribe to our Daily Focus, please contact us at [email protected]
Mirae Asset Sekuritas Indonesia
Table 1. Summary of listed cement companies’ revenue ()
(in IDRbn) 1Q16 4Q16 1Q17 YoY QoQ
SMGR 6,021 7,052 6,399 6.3% -9.3%
INTP 3,929 4,015 3,376 -14.1% -15.9%
SMCB 2,456 2,552 2,159 -12.1% -15.4%
SMBR 297 480 328 10.2% -31.7%
Source: Company data, Mirae Asset Sekuritas Indonesia Research
May 3, 2017
Cement: Summarizing 1Q17 earnings results
Mengingat semua emiten semen telah merilis kinerja keuangan 1Q17 mereka, kami membuat ringkasan singkat dari kinerja mereka sebagai berikut:
Semen Indonesia (SMGR/Hold/TP IDR8,000)
Sampai 1Q17, pendapatan SMGR sebesar IDR6.4tr (+6.3% YoY; -9.3% QoQ). Namun, bisnis utama SMGR, semen, masih membukukan pendapatan -1.2% YoY. SMGR membukukan laba bersih sebesar Rp746.5bn (-27.8% YoY; -53.1% QoQ). (Silakan merujuk ke SMGR’s 1Q17 review: Hard time persists untuk informasi lebih lanjut).
Indocement Tunggal Prakarsa (INTP/Sell/TP IDR13,000)
Pendapatan 1Q17 INTP mencapai Rp3.4tr (-14.1% YoY; -15.9% QoQ). COGS lebih tinggi dari perkiraan, menjadikan marjin laba kotor terkontraksi dari 43.2% (1Q16) dan 40.0%
(4Q16) menjadi 34.5% (1Q17). Intinya, laba bersih 1Q17 merosot 48.7% YoY menjadi hanya Rp491.6bn. (Silakan merujuk ke INTP’s 1Q17 review: Weaker than expected untuk informasi lebih lanjut).
Holcim Indonesia (SMCB/Not rated)
Sampai dengan 1Q17, SMCB membukukan pendapatan sebesar IDR2.2tr (-12.1% YoY; - 15.4% QoQ). SMCB membukukan rugi bersih sebesar Rp116.5bn pada 1Q17.
Semen Baturaja (SMBR/Not rated)
Pendapatan SMBR 1Q17 mencapai Rp327.8bn (+10.2% YoY; -31.7% QoQ) dengan laba bersih tumbuh 13.2% YoY menjadi Rp32.1bn. Meskipun secara YoY, kinerja SMBR 1Q17 lebih baik daripada emiten semen lainnya, tetapi, secara QoQ, kinerja SMBR juga menunjukkan penurunan. Laba bersih SMBR 1Q17 turun 62.0% QoQ.
Secara keseluruhan, menurut kami industri semen masih menghadapi masa sulit mengingat kinerja 1Q17 yang lemah. Pasar properti yang stagnan masih bertahan, membatasi pertumbuhan konsumsi semen. Persaingan ketat di tengah kelebihan pasokan juga terus berlanjut, menekan ASP perusahaan semen. Kedua komponen (volume dan harga) ini menekan pendapatan perusahaan semen. Dari perspektif COGS, kenaikan harga batubara menjadi beban tambahan bagi perusahaan semen, menekan margin mereka.
Secara keseluruhan, kami mempertahankan rekomendasi Underweight kami di sektor semen. Risiko terhadap rekomendasi kami adalah: 1) pemulihan pasar properti yang lebih cepat dari perkiraan, 2) konsolidasi industri semen, dan 3) intervensi pemerintah yang supportive kepada industri properti dan semen.
Market Index
Last Trade Chg (%) MoM YoY
JCI 5,675.8 -0.2 1.4 18.1
MSCI Indonesia 26.5 0.6 2.2 13.9
MSCI EM 988.2 0.9 1.5 19.3
HANG SENG 24,696.1 0.3 1.5 19.0
KOSPI 2,205.4 0.6 1.7 11.0
FTSE 7,250.1 0.6 -1.1 16.5
DJIA 20,949.9 0.2 1.3 17.8
NASDAQ 6,095.4 0.1 3.3 27.9
Valuation
2017F P/E (x) P/B (x) ROE (%)
JCI 16.2 2.5 18.3
Key Rates
Last Trade Chg (bps) MoM YoY
BI 7-Day RR 4.75 0 0 -50*
3yr 6.60 -1 -17 -75
10yr 7.05 0 1 -64
*since introduced in Aug 2016
FX
Last Trade Chg (%) MoM YoY
USD/IDR 13,312.00 -0.1 0.0 1.3
USD/KRW 1,137.80 0.0 2.0 0.0
USD/JPY 111.99 0.1 1.0 5.1
USD/CNY 6.90 0.0 0.1 6.4
Commodities
Last Trade Chg (%) MoM YoY
WTI 47.7 -2.4 -6.0 0.9
Gold 1,256.8 0.0 0.3 -2.3
Coal 79.0 -5.8 -2.2 54.9
Palm Oil 2,730.0 0.2 -6.0 3.6
Rubber 169.5 0.0 -5.0 17.9
Nickel 9,450.0 1.2 -5.7 0.1
Copper 5,802.0 1.2 0.9 17.9
Tin 19,960.0 0.3 -1.4 15.6
JCI Index VS MSCI Emerging Markets
650 800 950 1,100
3,500 4,500 5,500
05/13 05/14 05/15 05/16 05/17
(pt) JCI MSCI EM (pt)
800 950 1,100
4,500 5,500
(pt) JCI MSCI EM (pt)
Mirae Asset Sekuritas Indonesia cartoon
Local flashes
Economy: BPS: Inflasi April 2017 0,09 persen. Badan Pusat Statistik (BPS) melaporkan inflasi April 2017 tercatat 0,09 persen. Adapun inflasi tahun kalender sebesar 1,28 persen dan tahun ke tahun mencapai 4,17 persen. Bila dibandingkan pada bulan yang sama pada tahun sebelumnya, Indonesia malah mencatat deflasi pada April 2016.
Deflasi tercatat 0,45 persen pada April 2016. Kondisi ini memang berbalik dibandingkan Maret 2017 yang terjadi deflasi 0,02 persen. (Liputan6)
MAIN: Laba bersih Malindo menyusut 52%. Kinerja PT Malindo Feedmill Tbk (MAIN) kuartal I 2017 kurang memuaskan. Laba bersihnya mengalami penurunan sekitar 52%
year on year(yoy) menjadi Rp 24,63 miliar dari sebelumnya Rp 52,16 miliar. Sinyal pelemahan kinerja sudah terlihat dari sisi penjualan MAIN. Berdasarkan laporan keuangan MAIN, Selasa (2/4), pendapatannya Rp 1,27 triliun, turun 2% yoy dari sebelumnya Rp 1,3 triliun. (Kontan)
MAPI: Laba MAPI melonjak 409%. PT Mitra Adiperkasa Tbk. mencatatkan raihan laba yang diatribusikan kepada pemilik entitas induk kuartal I/2017 senilai Rp57,42 miliar, melejit hingga 409% dari posisi Rp11,28 miliar pada periode yang sama tahun sebelumnya. Raihan laba itu, sejalan dengan meningkatnya pendapatan bersih pedagang eceran ini. Adapun nilai pendapatan bersih emiten bersandi saham MAPI itu pada kuartal I/2017 mencapai Rp3,61 triliun, tumbuh 14,2% dari posisi Rp3,16 triliun pada kuartal I/2016. (Bisnis Indonesia)
TPIA: RUPS setujui right issue Chandra Asri. Rapat umum Pemegang Saham (RUPS) PT Chandra Asri Petrochemical (TPIA) akhirnya menyetujui Penambahan Modal dengan Hak Memesan efek Terlebih dahulu (HMETD) atau rights issue. Agenda pendanaan ini sekaligus merupakan upaya Chandra Asri untuk memenuhi aturan free float dari Bursa Efek Indoenesia. "Dana yang diperoleh akan digunakan Perseroan sebagai belanja modal sejalan dengan rencana bisnis jangka menengah Perseroan untuk menambah kapasitas produksi dan diversifikasi portofolio produknya." kata Harry Muhammad Tamin, Head of Investor Relation TPIA. (Kontan)
LPKR: Properti lesu, laba Lippo Karawaci Q1 2017 anjlok. PT Lippo Karawaci Tbk (LPKR) mencatat laba bersih pada kuartal pertama tahun 2017 sebesar Rp 142,66 miliar, turun sebesar 54,17% dibanding kuartal pertama 2016 sebesar Rp 311,28 miliar.
Ini sejalan dengan pendapatan kuartal 1-2017 sebesar Rp 2,54 triliun. Angka ini menurun sebesar 2,48% dibandingkan dengan kuartal pertama 2016 sebesar Rp 2,60 triliun. (Kontan)
ERTX: Laba Eratex 1Q17 anjlok tertekan biaya. PT Eratex Djaja Tbk, hanya mampu mengeruk laba bersih di kuartal I 2017 ini sebesar US$ 319.757, anjlok 49% di banding kuartal sama tahun lalu yang US$ 604.129. Padahal, emiten berkode ERTX ini, meraih pertumbuhan pendapatan di kuartal I menjadi US$ 18,9 juta. Sekretaris Perusahaan PT Eratex Djaja Tbk, Juliarti Pudji, mengatakan hal ini disebabkan proyek perluasan pabrik di tahun ini. Seperti yang diketahui, ERTX berencana menambah kapasitas produksi menjadi 7,2 juta potong pakaian per tahun. (Kontan)
SIDO: Sido Muncul siap ekspansi ke pasar Filipina. PT Industri Jamu & Farmasi Sido Muncul Tbk (SIDO) membidik pertumbuhan pendapatan tahun ini sebesar 15%. Target ini didorong dengan adanya penambahan kapasitas produksi dan penguatan penjualan ekspor ke Filipina. Tahun lalu, SIDO berhasil membukukan pendapatan sebesar Rp 2,56 triliun. Angka ini naik 15,4% dibanding tahun lalu Rp 2,12 triliun. (Kontan)
Technical analysis
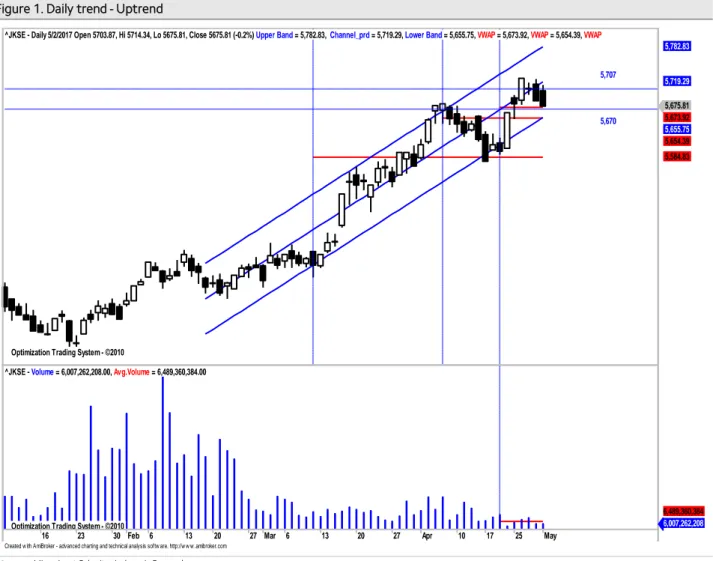
Tasrul +62-21-515-1140 [email protected] Jakarta Composite Index (JCI) – Consolidation
IHSG akan coba naik mendekati center line pada uptrend channel.
IHSG saat masih dalam pola uptrend jangka pendek relatif valid yang dimulai sejak selama 48 hari terakhir dengan r-squared = 0.9045 dan bergerak normal dalam rentang +/-1.67 std.deviasi dari centerline. Peluang IHSG bergerak di luar pergerakan normal sekitar 9.55% atau sekitar 5 bar chart. Volatilitas normal pergerakan IHSG saat ini sebesar +/-0.42% atau sekitar +/- 24.1 point. sebagaimana terlihat pada Figure 1.
Summary
Item Data Item Data
Close (May 2, 2017) 5,675.8 (-0.2%) Normal trading range 5,654-5,707 Average index performance (%) 3.23 Target
Period 48 - Daily 5,707
r-squared 0.9045 - Weekly 5,729
Volatility (+/-, %) 0.42 - Monthly 5,806 Volatility (+/-, point) 24.1 Stop loss 5,654 Source: Mirae Asset Sekuritas Indonesia Research
Figure 1. Daily trend - Uptrend
Source: Mirae Asset Sekuritas Indonesia Research
Created w ith AmiBroker - advanced charting and technical analysis softw are. http://w w w .amibroker.com Optimization Trading System - ©2010
Optimization Trading System - ©2010 Optimization Trading System - ©2010 Optimization Trading System - ©2010
5,707
5,670
^JKSE - Daily 5/2/2017 Open 5703.87, Hi 5714.34, Lo 5675.81, Close 5675.81 (-0.2%) Upper Band = 5,782.83, Channel_prd = 5,719.29, Lower Band = 5,655.75, VWAP = 5,673.92, VWAP = 5,654.39, VWAP
5,675.81 5,673.92 5,655.75 5,654.39 5,584.83 5,719.29 5,782.83
16 23 30 Feb 6 13 20 27 Mar 6 13 20 27 Apr 10 17 25 May
Optimization Trading System - ©2010
^JKSE - Volume = 6,007,262,208.00, Avg.Volume = 6,489,360,384.00
6,007,262,208 6,489,360,384
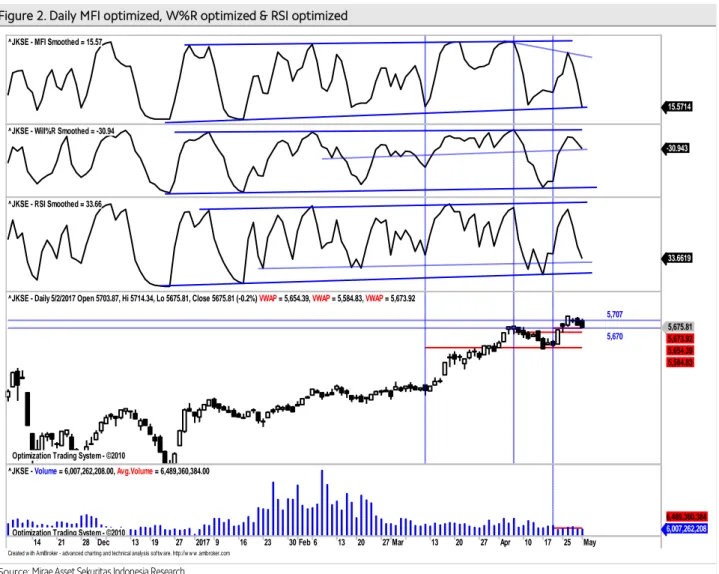
Aliran dana keluar dan volatilitasindeks turun mulai terbatas.
Pada Figure 2, terlihat dari hasil optimalisasi terakhir, koreksi indikator MFI optimized, indikator W%R optimized dan RSI optimized cenderung turun dengan volume sekitar rata-rata dengan demikian potensi koreksi masih terlihat dengan kecenderungan menguat .Daily resistance di 5,707 dan daily support di 5,670. Stop loss level di 5,654.
Figure 2. Daily MFI optimized, W%R optimized & RSI optimized
Source: Mirae Asset Sekuritas Indonesia Research
Created w ith AmiBroker - advanced charting and technical analysis softw are. http://w w w .amibroker.com
^JKSE - MFI Smoothed = 15.57
15.5714
^JKSE - Will%R Smoothed = -30.94
-30.943
^JKSE - RSI Smoothed = 33.66
33.6619
Optimization Trading System - ©2010 Optimization Trading System - ©2010 Optimization Trading System - ©2010
5,707
5,670
^JKSE - Daily 5/2/2017 Open 5703.87, Hi 5714.34, Lo 5675.81, Close 5675.81 (-0.2%) VWAP = 5,654.39, VWAP = 5,584.83, VWAP = 5,673.92
5,675.81 5,673.92 5,654.39 5,584.83
14 21 28 Dec 13 19 27 2017 9 16 23 30 Feb 6 13 20 27 Mar 13 20 27 Apr 10 17 25 May
Optimization Trading System - ©2010
^JKSE - Volume = 6,007,262,208.00, Avg.Volume = 6,489,360,384.00
6,007,262,208 6,489,360,384
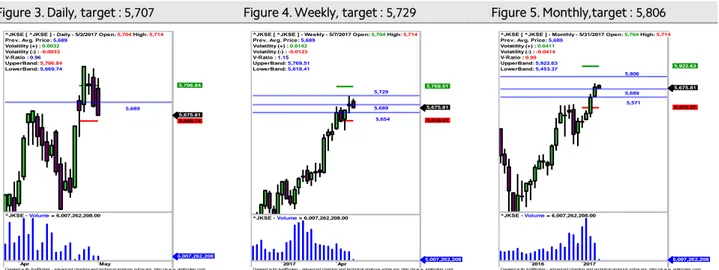
IHSG akan coba bertahan sekitar rata-rata masing-masing periode.
Untuk mampu naik lebih lanjut IHSG saat ini harus mampu bertahan diatas rata-rata masing-masing periode (positive area) sebagaimana terlihat pada Figure 3,4 dan 5.
Figure 3. Daily, target : 5,707 Figure 4. Weekly, target : 5,729 Figure 5. Monthly,target : 5,806
x
Source: Mirae Asset Sekuritas Indonesia Research Source: Mirae Asset Sekuritas Indonesia Research Source: Mirae Asset Sekuritas Indonesia Research
Created w ith AmiBroker - advanced charting and technical analysis sof tw are. http://w w w .amibroker.com 5,689
^JKSE [ ^JKSE ] - Daily - 5/2/2017 Open: 5,704 High: 5,714 Prev. Avg. Price: 5,689
Volatility (+) : 0.0032 Volatility (-) : -0.0033 V-Ratio : 0.96 UpperBand: 5,706.84 LowerBand: 5,669.74
5,675.81 5,669.74 5,706.84
Apr May
^JKSE - Volume = 6,007,262,208.00
6,007,262,208
Created w ith AmiBroker - advanced charting and technical analysis sof tw are. http://w w w .amibroker.com 5,689
5,654 5,729
^JKSE [ ^JKSE ] - Weekly - 5/7/2017 Open: 5,704 High: 5,714 Prev. Avg. Price: 5,689
Volatility (+) : 0.0142 Volatility (-) : -0.0123 V-Ratio : 1.15 UpperBand: 5,769.51 LowerBand: 5,618.41
5,675.81 5,618.41 5,769.51
2017 Apr
^JKSE - Volume = 6,007,262,208.00
6,007,262,208
Created w ith AmiBroker - advanced charting and technical analysis sof tw are. http://w w w .amibroker.com 5,689
5,806
5,571
^JKSE [ ^JKSE ] - Monthly - 5/31/2017 Open: 5,704 High: 5,714 Prev. Avg. Price: 5,689
Volatility (+) : 0.0411 Volatility (-) : -0.0414 V-Ratio : 0.99 UpperBand: 5,922.63 LowerBand: 5,453.37
5,675.81
5,453.37 5,922.63
2016 2017
^JKSE - Volume = 6,007,262,208.00
6,007,262,208
Stocks on our focus list
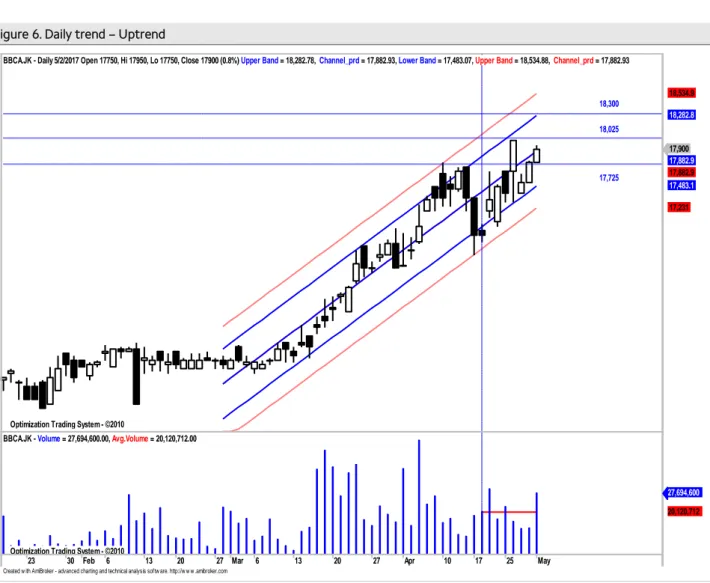
Bank Central Asia (BBCA) – Trading Buy
Harga akan coba naik mendekati upper band pada uptrend channel.
Secara umum harga saham ini masih bergerak pada uptrend channel yang masih relatif valid (r-squared = 0.93) selama 41 hari terakhir yang bergerak normal dalam rentang +/- 1.81 std.deviasi dari center line. Peluang harga keluar dari pergerakan normal sekitar 7 % (sekitar 2 bar chart ). Volatilitas normal pergerakkan harga saham ini sepanjang uptrend channel sebesar +/- 1% atau sekitar +/- 179.64 (potensi naik dan turun secara normal maksimum/minimum sebesar 175 rupiah) dari level penutupan terakhir sebagaimana terlihat pada Figure 6.
Summary
Item Data Item Data
Close (May 2, 2017) 17,900 (+0.8%) Normal trading range 17,725-18,300
Relative Avg. Price performance to JCI (%) 8.34 Target
β (beta) 1.01 - Daily 18,025
Corelation 0.96 - Weekly 18,300
Period 41 - Monthly 18,525
r-squared 0.930 Stop loss 17,475
Volatility (+/-, %) 1.00
Volatility (+/-, Rp.) 179.64
Source: Mirae Asset Sekuritas Indonesia Research
Figure 6. Daily trend – Uptrend
Source: Mirae Asset Sekuritas Indonesia Research
Aliran dana masuk dan volatilitas harga naik masih terlihat.
Created w ith AmiBroker - advanced charting and technical analysis softw are. http://w w w .amibroker.com Optimization Trading System - ©2010
Optimization Trading System - ©2010
18,025
17,725 18,300 BBCA.JK - Daily 5/2/2017 Open 17750, Hi 17950, Lo 17750, Close 17900 (0.8%) Upper Band = 18,282.78, Channel_prd = 17,882.93, Lower Band = 17,483.07, Upper Band = 18,534.88, Channel_prd = 17,882.93
17,900 17,882.9 17,882.9 17,483.1 17,231 18,282.8 18,534.9
23 30 Feb 6 13 20 27 Mar 6 13 20 27 Apr 10 17 25 May
Optimization Trading System - ©2010
BBCA.JK - Volume = 27,694,600.00, Avg.Volume = 20,120,712.00
27,694,600 20,120,712
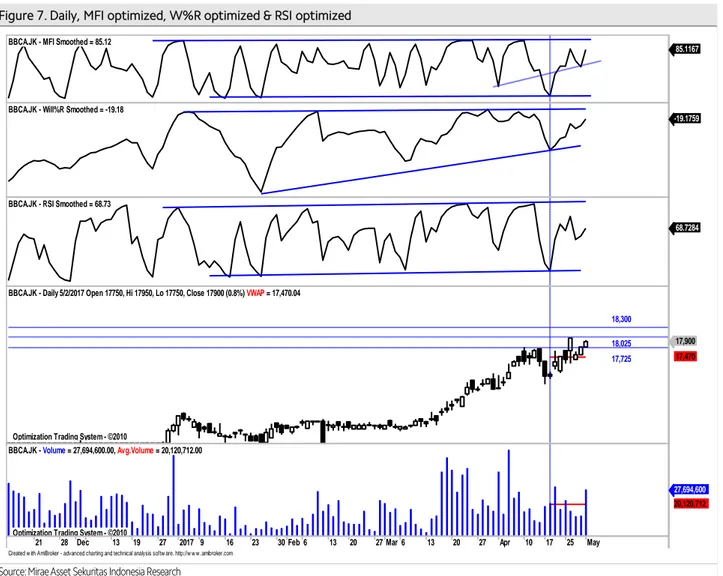
Pada Figure 7, terlihat dari hasil optimalisasi terakhir, indikator MFI Optimized , indikator W%R Optimized dan RSI Optimized saat ini masih cenderung naik dengan volume tembus rata-rata. Hal ini mengindikasikan potensi kenaikkan masih terlihat. Daily resistance terdekat di18,025 sebelum lanjut ke 18,300. Daily support terdekat di 17,725.Cut loss level di 17,475.
Figure 7. Daily, MFI optimized, W%R optimized & RSI optimized
Source: Mirae Asset Sekuritas Indonesia Research
Created w ith AmiBroker - advanced charting and technical analysis softw are. http://w w w .amibroker.com BBCA.JK - MFI Smoothed = 85.12
85.1167
BBCA.JK - Will%R Smoothed = -19.18
-19.1759
BBCA.JK - RSI Smoothed = 68.73
68.7284
Optimization Trading System - ©2010
18,025 17,725 18,300 BBCA.JK - Daily 5/2/2017 Open 17750, Hi 17950, Lo 17750, Close 17900 (0.8%) VWAP = 17,470.04
17,900 17,470
21 28 Dec 13 19 27 2017 9 16 23 30 Feb 6 13 20 27 Mar 6 13 20 27 Apr 10 17 25 May
Optimization Trading System - ©2010
BBCA.JK - Volume = 27,694,600.00, Avg.Volume = 20,120,712.00
27,694,600 20,120,712
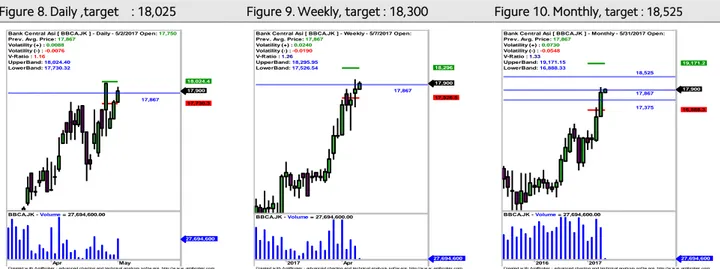
Harga akan coba naik dan bertahan diatas rata-rata pada masing-masing periode.
Untuk naik lebih lanjut harga harus mampu bertahan minimal sekitarrata-rata dengan target kenaikkan terdekat ke resistance masing-masing periode sebagaimana terlihat pada Figure 8,9 dan 10.
Figure 8. Daily ,target : 18,025 Figure 9. Weekly, target : 18,300 Figure 10. Monthly, target : 18,525
Source: Mirae Asset Sekuritas Indonesia Research Source: Mirae Asset Sekuritas Indonesia Research Source: Mirae Asset Sekuritas Indonesia Research
Created w ith AmiBroker - advanced charting and technical analysis sof tw are. http://w w w .amibroker.com 17,867
Bank Central Asi [ BBCA.JK ] - Daily - 5/2/2017 Open: 17,750 Prev. Avg. Price: 17,867
Volatility (+) : 0.0088 Volatility (-) : -0.0076 V-Ratio : 1.16 UpperBand: 18,024.40 LowerBand: 17,730.32
17,900 17,730.3 18,024.4
Apr May
BBCA.JK - Volume = 27,694,600.00
27,694,600
Created w ith AmiBroker - advanced charting and technical analysis sof tw are. http://w w w .amibroker.com 17,867
Bank Central Asi [ BBCA.JK ] - Weekly - 5/7/2017 Open:
Prev. Avg. Price: 17,867 Volatility (+) : 0.0240 Volatility (-) : -0.0190 V-Ratio : 1.26 UpperBand: 18,295.95 LowerBand: 17,526.54
17,900
17,526.5 18,296
2017 Apr
BBCA.JK - Volume = 27,694,600.00
27,694,600
Created w ith AmiBroker - advanced charting and technical analysis sof tw are. http://w w w .amibroker.com 17,867
18,525
17,375 Bank Central Asi [ BBCA.JK ] - Monthly - 5/31/2017 Open:
Prev. Avg. Price: 17,867 Volatility (+) : 0.0730 Volatility (-) : -0.0548 V-Ratio : 1.33 UpperBand: 19,171.15 LowerBand: 16,888.33
17,900
16,888.3 19,171.2
2016 2017
BBCA.JK - Volume = 27,694,600.00
27,694,600
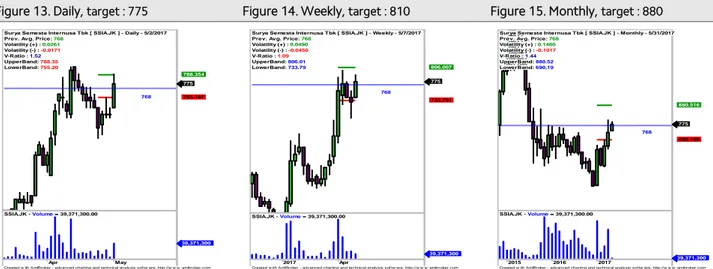
Surya Semesta Internusa (SSIA) – Trading Buy
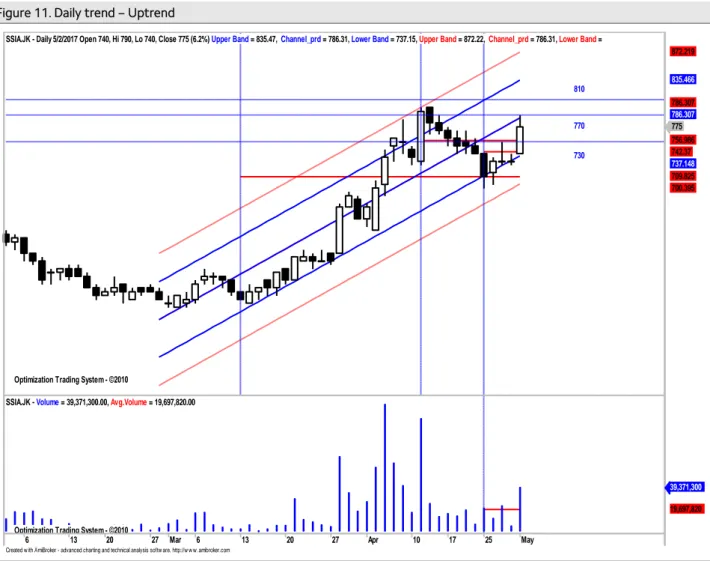
Harga akan coba naik dan tembus center line pada uptrend channel .
Secara umum harga saham ini juga masih bergerak dalam pola uptrend channel yang masih relatif valid (r-squared = 0,837) selama 41 hari terakhir dan bergerak normal dalam rentang +/- 1.4 std.deviasi dari center line. Peluang harga keluar dari pergerakan normal sekitar 16.27 % (sekitar 7 bar chart ). Volatilitas normal pergerakan harga saham ini sepanjang uptrend channel sebesar +/- 2.61 % atau sekitar +/- 20.23 (potensi naik dan turun secara normal maksimum/minimum sebesar 20 rupiah) dari level penutupan terakhir sebagaimana terlihat pada Figure 11.
Summary
Item Data Item Data
Close (May 2, 2017)
775(+6.2%)
Normal trading range 740- 810 Relative Avg. Price performance to JCI (%) 11.57 Target
β (beta) 1.75 - Daily 775
Corelation 0.88 - Weekly 810
Period 41 - Monthly 880
r-squared 0.837 Stop loss 730
Volatility (+/-, %) 2.61
Volatility (+/-, Rp.) 20.23
Source: Mirae Asset Sekuritas Indonesia Research
Figure 11. Daily trend – Uptrend
Source: Mirae Asset Sekuritas Indonesia Research
Created w ith AmiBroker - advanced charting and technical analysis softw are. http://w w w .amibroker.com Optimization Trading System - ©2010
Optimization Trading System - ©2010 Optimization Trading System - ©2010 Optimization Trading System - ©2010 Optimization Trading System - ©2010
770
730 810 SSIA.JK - Daily 5/2/2017 Open 740, Hi 790, Lo 740, Close 775 (6.2%) Upper Band = 835.47, Channel_prd = 786.31, Lower Band = 737.15, Upper Band = 872.22, Channel_prd = 786.31, Lower Band =
775 756.986 742.37 737.148 709.825 700.395 786.307 786.307 835.466 872.219
6 13 20 27 Mar 6 13 20 27 Apr 10 17 25 May
Optimization Trading System - ©2010
SSIA.JK - Volume = 39,371,300.00, Avg.Volume = 19,697,820.00
39,371,300 19,697,820
Aliran dana masuk dan volatilitas harga naik masih terlihat.
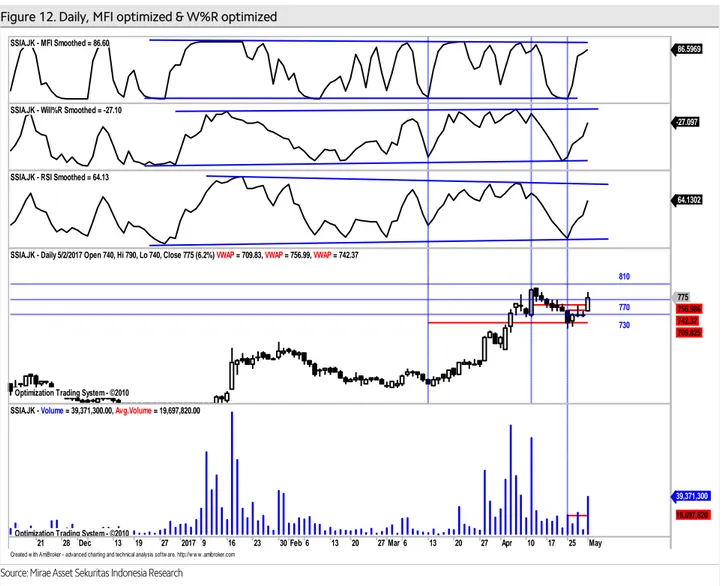
Pada Figure 12, terlihat dari hasil optimalisasi indikator MFI optimized ,indikator W%R optimized dan RSI Optimized saat ini masih cenderung naik dengan volume tembus rata-rata. Hal ini mengindikasikan potensi kenaikkan masih terlihat. Daily resistance di 810.Dailysupport saat ini di 740.Stop loss level di 730.
Figure 12. Daily, MFI optimized & W%R optimized
Source: Mirae Asset Sekuritas Indonesia Research
Created w ith AmiBroker - advanced charting and technical analysis softw are. http://w w w .amibroker.com SSIA.JK - MFI Smoothed = 86.60
86.5969
SSIA.JK - Will%R Smoothed = -27.10
-27.097
SSIA.JK - RSI Smoothed = 64.13
64.1302
Optimization Trading System - ©2010 Optimization Trading System - ©2010 Optimization Trading System - ©2010
770 730 810 SSIA.JK - Daily 5/2/2017 Open 740, Hi 790, Lo 740, Close 775 (6.2%) VWAP = 709.83, VWAP = 756.99, VWAP = 742.37
775 756.986 742.37 709.825
21 28 Dec 13 19 27 2017 9 16 23 30 Feb 6 13 20 27 Mar 6 13 20 27 Apr 10 17 25 May
Optimization Trading System - ©2010
SSIA.JK - Volume = 39,371,300.00, Avg.Volume = 19,697,820.00
39,371,300 19,697,820
Harga saat ini akan coba naik dan bertahan diatas rata-rata pada masing-masing periode.
Untuk naik lebih lanjut harga harus mampu bertahan minimal sekitar lower band dengan target kenaikkan terdekat ke resistance masing-masing periode sebagaimana sebagaimana terlihat pada Figure 14,15 dan 16.
Figure 13. Daily, target : 775 Figure 14. Weekly, target : 810 Figure 15. Monthly, target : 880 x
Source: Mirae Asset Sekuritas Indonesia Research Source: Mirae Asset Sekuritas Indonesia Research Source: Mirae Asset Sekuritas Indonesia Research
Created w ith AmiBroker - advanced charting and technical analysis sof tw are. http://w w w .amibroker.com 768
Surya Semesta Internusa Tbk [ SSIA.JK ] - Daily - 5/2/2017 Prev. Avg. Price: 768
Volatility (+) : 0.0261 Volatility (-) : -0.0171 V-Ratio : 1.52 UpperBand: 788.35 LowerBand: 755.20
775 755.197 788.354
Apr May
SSIA.JK - Volume = 39,371,300.00
39,371,300
Created w ith AmiBroker - advanced charting and technical analysis sof tw are. http://w w w .amibroker.com 768
Surya Semesta Internusa Tbk [ SSIA.JK ] - Weekly - 5/7/2017 Prev. Avg. Price: 768
Volatility (+) : 0.0490 Volatility (-) : -0.0450 V-Ratio : 1.09 UpperBand: 806.01 LowerBand: 733.79
775
733.791 806.007
2017 Apr
SSIA.JK - Volume = 39,371,300.00
39,371,300
Created w ith AmiBroker - advanced charting and technical analysis sof tw are. http://w w w .amibroker.com 768
Surya Semesta Internusa Tbk [ SSIA.JK ] - Monthly - 5/31/2017 Prev. Avg. Price: 768
Volatility (+) : 0.1460 Volatility (-) : -0.1017 V-Ratio : 1.44 UpperBand: 880.52 LowerBand: 690.19
775
690.186 880.516
2015 2016 2017
SSIA.JK - Volume = 39,371,300.00
39,371,300
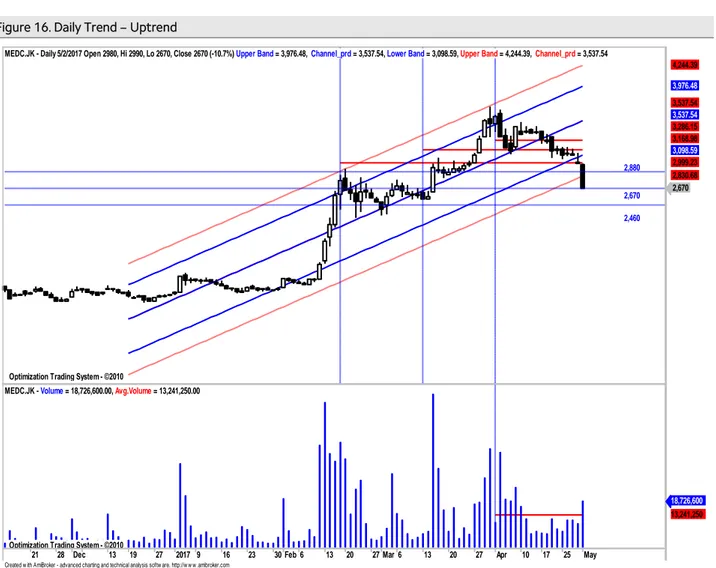
Medco Energi Internasional (MEDC) – Buy on Weakness
Harga akan coba naik dan bertahan diatas abnormal lower band pada uptrend channel.
Secara umum harga saham ini akan coba naik dan tembus center line pada uptrend channel yang masih relatif valid dengan r-squared = 0.867 selama 89 hari terakhir dan bergerak normal dalam rentang +/-1.5 std.deviasi dari centerline. Peluang harga keluar dari pergerakan normalnya sekitar 13.27 % (sekitar 11 bar chart ). Volatilitas normal pergerakan harga saham ini sepanjang uptrend channel sebesar +/-4.32 % atau sekitar +/- 115.42 (potensi naik dan turun secara normal maksimum/minimum sebesar 120 rupiah) dari level penutupan terakhir sebagaimana terlihat pada Figure 16.
Summary
Item Data Item Data
Close (May 2, 2017) 2,670(-10.70%) Normal trading range 2,460-2,880 Relative Avg. Price performance to JCI (%) (10.98) Target
β (beta) 0.03 - Daily 2,880
Corelation 0.80 - Weekly 3,010
Period 89 - Monthly 3,090
r-squared 0.867 Stop loss 2,460
Volatility (+/-, %) 4.32
Volatility (+/-, Rp.) 115.41
Source: Mirae Asset Sekuritas Indonesia Research
Figure 16. Daily Trend – Uptrend
Source: Mirae Asset Sekuritas Indonesia Research
Aliran dana kelur dan volatilitas harga turun masih terlihat namun mulai terbatas.
Created w ith AmiBroker - advanced charting and technical analysis softw are. http://w w w .amibroker.com Optimization Trading System - ©2010
Optimization Trading System - ©2010 Optimization Trading System - ©2010 Optimization Trading System - ©2010 Optimization Trading System - ©2010
2,880
2,670
2,460 MEDC.JK - Daily 5/2/2017 Open 2980, Hi 2990, Lo 2670, Close 2670 (-10.7%) Upper Band = 3,976.48, Channel_prd = 3,537.54, Lower Band = 3,098.59, Upper Band = 4,244.39, Channel_prd = 3,537.54
2,670 2,830.68 2,999.23 3,098.59 3,168.98 3,286.15 3,537.54 3,537.54 3,976.48 4,244.39
21 28 Dec 13 19 27 2017 9 16 23 30 Feb 6 13 20 27 Mar 6 13 20 27 Apr 10 17 25 May
Optimization Trading System - ©2010
MEDC.JK - Volume = 18,726,600.00, Avg.Volume = 13,241,250.00
18,726,600 13,241,250
Pada Figure 17, terlihat dari hasil optimalisasi, indikator MFI Optimized ,W%R Optimized dan RSI Optimized akan menguji support trendline dengan volume tembus rata-rata.
Dengan demikian diperkirakan potensi koreksi mulai terbatas. Perkiraan daily resistance terdekat ke 2,880 sebelum lanjut ke 3,100. Daily support terdekat di 2,460 yang sekaligus sebagai cut loss level.
Figure 17. Daily MFI Optimized , W%R Optimized & RSI Optimized
Source: Mirae Asset Sekuritas Indonesia Research
Created w ith AmiBroker - advanced charting and technical analysis softw are. http://w w w .amibroker.com MEDC.JK - MFI Smoothed = 16.02
16.0235 MEDC.JK - Will%R Smoothed = -98.74
-98.7386 MEDC.JK - RSI Smoothed = 5.36
5.36072
Optimization Trading System - ©2010 Optimization Trading System - ©2010 Optimization Trading System - ©2010
2,880
2,460 2,670 MEDC.JK - Daily 5/2/2017 Open 2980, Hi 2990, Lo 2670, Close 2670 (-10.7%) VWAP = 3,168.98, VWAP = 2,999.23, VWAP = 3,286.15
2,670 2,999.23 3,168.98 3,286.15
Nov Dec 2017 Feb Mar Apr May
Optimization Trading System - ©2010
MEDC.JK - Volume = 18,726,600.00, Avg.Volume = 13,241,250.00
18,726,600 13,241,250
Harga akan coba naik dan bertahan diatas rata-ratapada masing-masing periode.
Untuk naik lebih lanjut harga harus mampu bertahan minimal sekitarrata-rata dengan target kenaikkan terdekat ke resistance masing-masing periode sebagaimana terlihat pada Figure 18,19 dan 20.
Figure 18. Daily, target : 2,875 Figure 19. Weekly, target : 3,025 Figure 20. Monthly, target : 3,620
Source: Mirae Asset Sekuritas Indonesia Research Source: Mirae Asset Sekuritas Indonesia Research Source: Mirae Asset Sekuritas Indonesia Research
analyzed by : Tasrul, [email protected], +62-21- 5151140
Relative Avg.Price Performance to JCI (%) : Persentase kenaikan harga saham dari rata-rata sejak IHSG memulai uptrend-nya β (beta) : Indikator sensitivitas harga saham terhadap IHSG, beta diatas 1 berarti harga makin sensitif terhadap pergerakan IHSG dan sebaliknya
Correlation : Ukuran kuat hubungan (korelasi) pergerakan harga saham dibanding dengan pergerakan IHSG
Period : Periode uptrend / downtrend yang valid dari pergerakan harga saham
r-squared : Koefisien determinasi, menunjukkan persentase gerakan yang dapat dijelaskan dengan regresi linier.Nilai R2 terletak antara 0 – 1, dan kecocokan model dikatakan lebih baik kalau R2 semakin mendekati 1 (validitas uptrend atau downtrend makin valid) Volatility (+/-%) : Besaran volatilitas normal maksimal/minimal dari pergerakan harga harian selama harga saham bergerak normal pada trend channel dalam persentase.
Volatility (+/- point or Rp) : Besaran volatilitas normal maksimal/minimal dari pergerakan harga harian selama Harga saham bergerak
Buy : Beli, harga sudah menyentuh atau jatuh di bawah support dan indikator teknikal berada di oversold area.
Sell : Jual, harga sudah menyentuh atau tembus resistance normal dan indikator berada di overbought area.
BoW : Buy on Weakness, beli ketika harga sudah melemah, dimana volume tekanan jual mulai berkurang dan harga mendekatisupport, serta indikator teknikal sudah berada di oversold area.
SoS : Sell on Strength, jual ketika kenaikan harga sudah mulai terbatas dimana volume beli mulai berkurang dan harga mendekati resistance, serta indikator teknikal sudah berada di overbought area.
Trading Buy : Beli dan jual kembali secepatnya jika harga sudah mencapai level resistance terdekat, karena kenaikan harga relatif tidak stabil atau hanya sementara.
Trading Sell : Jual dan beli kembali secepatnya jika harga sudah mencapai level support terdekat karena koreksi harga relative tidak stabil atau hanya sementara.
Created w ith AmiBroker - advanced charting and technical analysis sof tw are. http://w w w .amibroker.com 2,777
2,610 Medco Energi International Tbk [ MEDC.JK ] - Daily - 5/2/2017 Prev. Avg. Price: 2,777
Volatility (+) : 0.0359 Volatility (-) : -0.0249 V-Ratio : 1.44 UpperBand: 2,876.33 LowerBand: 2,707.54
2,670 2,707.54 2,876.33
Apr May
MEDC.JK - Volume = 18,726,600.00
18,726,600
Created w ith AmiBroker - advanced charting and technical analysis sof tw are. http://w w w .amibroker.com 2,777
Medco Energi International Tbk [ MEDC.JK ] - Weekly - Prev. Avg. Price: 2,777
Volatility (+) : 0.0866 Volatility (-) : -0.0558 V-Ratio : 1.55 UpperBand: 3,017.25 LowerBand: 2,621.69
2,670 2,621.69 3,017.25
2017 Apr
MEDC.JK - Volume = 18,726,600.00
18,726,600
Created w ith AmiBroker - advanced charting and technical analysis sof tw are. http://w w w .amibroker.com 2,777
Medco Energi International Tbk [ MEDC.JK ] - Monthly Prev. Avg. Price: 2,777
Volatility (+) : 0.1112 Volatility (-) : -0.0961 V-Ratio : 1.16 UpperBand: 3,085.54 LowerBand: 2,509.92
2,670 2,509.92 3,085.54
2015 2016 2017
MEDC.JK - Volume = 18,726,600.00
18,726,600
Chart 21. JCI Vs. USD/IDR Chart 22. JCI performance (absolute vs. relative)
Source: Bloomberg, Mirae Asset Sekuritas Indonesia Note: Relative to MSCI EM Index
Source: Bloomberg, Mirae Asset Sekuritas Indonesia
Chart 23. Foreigner’s net purchase (EM) Chart 24. Energy price
Note: The latest figure for India are April 28th, 2017
Source: Bloomberg, Mirae Asset Sekuritas Indonesia Source: Bloomberg, Mirae Asset Sekuritas Indonesia
Chart 25. Non-ferrous metal price Chart 26. Precious metal price
Source: Bloomberg, Mirae Asset Sekuritas Indonesia Source: Bloomberg, Mirae Asset Sekuritas Indonesia 13,100
13,300 13,500 13,700
4,800 5,000 5,200 5,400 5,600 5,800
1/31 2/28 3/28 4/25
(IDR)
(pt) JCI (L) USD/IDR (R)
-0.2
0.2 1.2
17.9
-1.0 -0.4
-1.2
-2.4 -4
0 4 8 12 16 20
1D 1W 1M 1Y
Absolute Relative (%, %p)
116
357
64
-6
7
-173 1,020
1,380
371
85 48
-171 -400
-200 0 200 400 600 800 1,000 1,200 1,400 1,600
Korea Taiwan Indonesia Thailand Philippines India
1 Day 5 Days
(USDmn) (USDmn) (USDmn) (USDmn)
75 80 85 90 95 100 105 110
1/31 2/28 3/28 4/25
CPO WTI Coal
(D-3M=100)
80 85 90 95 100 105 110 115
1/31 2/28 3/28 4/25
(D-3M=100) Copper Nickel Tin
90 95 100 105 110
1/31 2/28 3/28 4/25
Silver Gold Platinum
(D-3M=100)
Table. Key valuation metrics
Company Name Ticker
Price Market Cap Price Performance (%) P/E(X)* P/B(X)* ROE(%)*
(IDR) (IDRbn) 1D 1W 1M 1Y FY16 FY17 FY16 FY17 FY16 FY17
Jakarta Composite Index JCI 5,676 6,211,001 -0.2 0.2 1.9 17.3 16.2 14.1 2.5 2.3 18.2 19.9
FINANCIALS
Bank Central Asia BBCA 17,900 441,325 0.8 2.4 8.2 36.6 18.5 19.3 3.4 3.4 20.4 18.9
Bank Mandiri Persero BMRI 11,675 272,417 -0.2 2.4 -0.2 22.3 19.6 13.5 1.8 1.7 10.3 12.6
Bank Rakyat Indonesia Persero BBRI 13,050 321,933 1.2 1.0 0.6 27.0 10.9 11.5 1.9 2.0 20.2 18.2
Bank Negara Indonesia Persero BBNI 6,425 119,818 0.8 4.5 -0.8 43.1 9.1 9.0 1.2 1.3 13.9 14.6
Bank Tabungan Negara Persero BBTN 2,300 24,357 0.0 -1.3 1.3 30.7 13.3 12.1 1.0 1.2 7.6 10.1
CONSUMER
HM Sampoerna HMSP 3,820 444,335 0.0 -1.8 -2.1 -3.8 34.8 32.6 13.0 12.5 38.6 38.2
Gudang Garam GGRM 67,150 129,203 1.1 4.6 2.5 -6.2 18.4 17.0 3.1 2.9 17.3 17.8
Indofood CBP Sukses Makmur ICBP 8,550 99,709 -2.6 1.8 4.9 11.8 27.8 25.6 5.7 5.0 21.8 21.0
Indofood Sukses Makmur INDF 8,425 73,975 0.6 5.0 5.3 19.9 18.3 16.4 2.4 2.3 14.7 14.4
Kalbe Farma KLBF 1,515 71,016 -4.4 -4.1 -1.6 13.1 30.9 27.8 6.0 5.3 20.6 19.2
Unilever Indonesia UNVR 45,300 345,639 1.8 -0.5 4.6 4.7 46.3 48.2 62.9 62.7 134.1 137.3
AGRICULTURAL
Astra Agro Lestari AALI 14,350 27,619 -0.3 -1.0 -3.7 -7.3 14.8 14.2 1.9 1.6 14.1 11.1
PP London Sumatera Indonesia LSIP 1,395 9,518 0.0 1.8 -4.8 -6.7 20.0 12.2 1.6 1.2 7.9 9.8
Sawit Sumbermas Sarana SSMS 1,720 16,383 -1.7 3.3 3.9 -6.5 22.5 22.3 3.9 4.1 18.3 18.4
INFRASTRUCTURE
XL Axiata EXCL 3,080 32,919 -4.0 2.7 0.7 -11.3 60.8 73.2 1.2 1.5 2.1 1.6
Jasa Marga JSMR 4,620 33,531 -0.4 3.4 0.0 -15.4 15.6 17.4 2.3 2.2 15.7 13.1
Perusahaan Gas Negara PGAS 2,410 58,422 -0.8 0.0 -4.7 -4.0 15.3 10.6 1.5 1.3 9.8 12.6
Tower Bersama Infrastructure TBIG 5,900 26,735 0.9 -2.1 8.3 2.2 17.4 20.7 14.3 8.4 83.6 49.3
Telekomunikasi Indonesia TLKM 4,410 444,528 0.9 -0.2 6.8 27.8 20.3 19.4 4.7 4.6 24.3 24.0
Soechi Lines SOCI 372 2,626 -3.1 -0.5 -3.1 -20.9 8.2 5.6 0.9 N/A 15.9 10.1
Garuda Indonesia GIAA 358 9,267 -2.7 -3.2 4.7 -14.4 31.7 21.3 2.6 2.6 8.6 13.2
BASIC-INDUSTRIES
Semen Indonesia SMGR 8,800 52,197 -0.3 1.1 -2.2 -7.9 12.0 13.6 1.9 1.7 16.3 12.7
Charoen Pokphand Indonesia CPIN 3,200 52,474 0.3 -3.0 0.0 -13.7 22.6 15.6 3.6 3.1 16.5 21.1
Indocement Tunggal Prakarsa INTP 16,150 59,452 -4.7 0.9 -2.7 -15.2 14.6 17.0 2.2 2.1 15.5 12.7
Japfa Comfeed Indonesia JPFA 1,400 15,975 -4.4 -8.2 -9.4 55.6 7.7 8.4 1.9 1.6 28.6 20.2
MINING
Indo Tambangraya Megah ITMG 18,625 21,045 -2.6 -0.9 -7.8 139.5 10.4 7.7 1.5 1.6 15.0 20.1
Adaro Energy ADRO 1,720 55,016 -3.1 -6.5 -1.7 140.6 12.0 10.8 1.3 1.2 11.1 11.4
Aneka Tambang ANTM 685 16,461 -1.4 -2.1 -6.2 -9.3 298.3 59.7 1.2 0.9 0.4 2.6
Vale Indonesia INCO 2,260 22,456 1.8 5.1 -5.4 25.2 N/A 33.9 1.1 0.9 0.1 2.5
Tambang Batubara Bukit Asam PTBA 12,350 28,456 -0.3 -0.8 -6.4 75.2 13.1 9.3 2.5 2.2 20.5 24.9
TRADE
United Tractors UNTR 26,000 96,984 -3.3 -3.4 -1.9 73.3 15.8 15.1 1.9 2.2 12.7 14.9
AKR Corporindo AKRA 6,650 26,601 -1.1 0.8 6.4 4.7 23.5 21.3 3.5 3.4 15.7 16.5
Global Mediacom BMTR 540 7,667 0.9 0.0 3.8 -55.4 41.8 N/A 0.9 N/A 2.0 N/A
Matahari Department Store LPPF 14,800 43,185 1.4 11.3 12.3 -22.1 21.9 19.4 23.8 15.6 136.4 86.2
Media Nusantara Citra MNCN 1,845 26,339 1.1 3.1 -0.3 -16.1 17.7 14.6 2.7 2.4 15.4 17.0
Matahari Putra Prima MPPA 975 5,244 3.2 5.4 -11.8 -35.4 211.4 31.9 3.3 2.1 1.6 5.0
Surya Citra Media SCMA 2,830 41,379 -1.0 -1.4 4.8 -13.7 27.2 23.0 11.9 10.1 45.7 46.6
Siloam International Hospital SILO 14,200 18,469 3.6 0.5 1.4 65.4 150.3 129.1 4.5 5.7 3.5 4.6
PROPERTY
Bumi Serpong Damai BSDE 1,775 34,163 -0.8 -2.5 -5.8 0.9 18.8 14.4 1.6 1.5 9.1 10.5
Adhi Karya ADHI 2,210 7,869 -2.2 -3.5 -6.8 -15.0 23.6 13.4 1.4 1.3 5.9 10.0
Alam Sutera Realty ASRI 346 6,799 -0.6 0.0 -4.4 -13.1 13.6 8.0 1.0 0.9 7.5 11.3
Ciputra Development CTRA 1,215 22,551 -5.1 -6.5 -1.2 -1.0 19.9 16.9 2.2 1.6 9.8 11.5
Lippo Karawaci LPKR 790 18,231 0.0 1.9 9.0 -21.4 18.6 16.3 0.9 0.9 5.0 6.1
Pembangunan Perumahan PTPP 2,970 18,414 -6.6 -7.5 -10.3 -14.9 23.1 12.8 2.4 1.7 14.4 14.5
Pakuwon Jati PWON 635 30,581 1.6 4.1 3.3 25.7 16.3 15.1 3.1 2.9 21.0 19.8
Summarecon Agung SMRA 1,350 19,476 -0.7 -2.9 0.7 -9.7 61.3 42.3 3.1 2.8 5.1 7.1
Wijaya Karya WIKA 2,320 20,810 -2.1 -2.1 -3.7 -2.9 14.4 16.5 1.8 1.6 12.9 10.4
Waskita Karya WSKT 2,350 31,898 -1.7 -2.1 -0.8 -0.8 17.3 13.2 3.1 2.0 16.6 16.7
MISCELLANEOUS
Astra International ASII 9,000 364,352 1.8 -1.6 4.3 34.3 22.1 18.4 3.0 3.0 14.2 16.4
Source: Bloomberg, Mirae Asset Sekuritas Indonesia
*Note: Valuation metrics based on Bloomberg consensus estimates
Sector performance Top 10 market cap performance
Name Index Chg (%) Ticker Price Market Cap (IDRbn) Chg (%)
Agricultural 1,819.8 -1.1 BRAM IJ 12900 5,805 19.72
Mining 1,499.3 -1.9 INKP IJ 2360 12,912 13.46
Basic-Industry 602.4 -1.2 KREN IJ 450 8,194 5.63
Miscellaneous Industry 1,515.8 0.6 SDRA IJ 1100 5,580 4.76
Consumer Goods 2,436.9 0.1 SILO IJ 14200 18,469 3.6
Property & Construction 498.8 -1.3 MPPA IJ 975 5,244 3.17
Infrastructure 1,146.6 0.3 AISA IJ 2290 7,371 3.15
Finance 895.9 0.4 NIKL IJ 4010 10,119 2.82
Trade 915.4 -0.8 TOWR IJ 3980 40,608 2.6
Composite 5,675.8 -0.2 RALS IJ 1305 9,260 2.35
Source: Bloomberg
Top 5 leading movers Top 5 lagging movers
Name Chg (%) Close Name Chg (%) Close
UNVR IJ 1.8 45,300 SMBR IJ -10.8 3,150
TLKM IJ 0.9 4,410 UNTR IJ -3.4 26,000
BBRI IJ 1.2 13,050 KLBF IJ -4.4 1,515
BBCA IJ 0.9 17,900 INTP IJ -4.7 16,150
ASII IJ 0.6 9,000 ICBP IJ -2.6 8,550
Source: Bloomberg
Economic Calendar
Time Currency Detail Forecast Previous
5:45am NZD Employment Change q/q 0.8% 0.8%
5:45am NZD Unemployment Rate 5.1% 5.2%
5:45am NZD Labor Cost Index q/q 0.5% 0.4%
6:01am GBP BRC Shop Price Index y/y -0.8%
6:30am AUD AIG Services Index 51.7
All Day JPY Bank Holiday
2:00pm EUR Spanish Unemployment Change 21.3K -48.6K
2:55pm EUR German Unemployment Change -10K -30K
3:30pm GBP Construction PMI 52.1 52.2
4:00pm EUR Prelim Flash GDP q/q 0.5% 0.4%
4:00pm EUR PPI m/m 0.1% 0.0%
Tentative EUR German 10-y Bond Auction 0.21|1.4
7:15pm USD ADP Non-Farm Employment Change 178K 263K
8:45pm USD Final Services PMI 52.5 52.5
9:00pm USD ISM Non-Manufacturing PMI 56.1 55.2
9:30pm USD Crude Oil Inventories -3.6M
Note: Time is based on Indonesian local time Source: Forex Factory
Disclaimers
This report is prepared strictly for private circulation only to clients of PT Mirae Asset Sekuritas Indonesia (MASI). It is purposed only to person having professional experience in matters relating to investments. The information contained in this report has been taken from sources which we deem reliable. No warranty (express or implied) is made to the accuracy or completeness of the information. All opinions and estimates included in this report constitute our judgments as of this date, without regards to its fairness, and are subject to change without notice. However, none of MASI and/or its affiliated companies and/or their respective employees and/or agents makes any representation or warranty (express or implied) or accepts any responsibility or liability as to, or in relation to, the accuracy or completeness of the information and opinions contained in this report or as to any information contained in this report or any other such information or opinions remaining unchanged after the issue thereof. We expressly disclaim any responsibility or liability (express or implied) of MASI, its affiliated companies and their respective employees and agents whatsoever and howsoever arising (including, without limitation for any claims, proceedings, action, suits, losses, expenses, damages or costs) which may be brought against or suffered by any person as a results of acting in reliance upon the whole or any part of the contents of this report and neither MASI, its affiliated companies or their respective employees or agents accepts liability for any errors, omissions or misstatements, negligent or otherwise, in the report and any liability in respect of the report or any inaccuracy therein or omission there from which might otherwise arise is hereby expresses disclaimed.
This document is not an offer to sell or a solicitation to buy any securities. This firms and its affiliates and their officers and employees may have a position, make markets, act as principal or engage in transaction in securities or related investments of any company mentioned herein, may perform services for or
solicit business from any company mentioned herein, and may have acted upon or used any of the recommendations herein before they have been provided to you. © PT Mirae Asset Sekuritas Indonesia 2016.