CITYBEM: AN OPEN SOURCE IMPLEMENTATION AND VALIDATION OF
MONTHLY HEATING AND COOLING ENERGY NEEDS FOR 3D BUILDINGS IN
CITIES
S. M. Murshed a *, S. Picard b, A. Koch a
a European Institute for Energy Research, Emmy-Noether Str. 11, 76131 Karlsruhe, Germany - (murshed, koch)@eifer.org b École Supérieure d'Électricité, 3 Rue Joliot Curie, 91190 Gif-sur-Yvette, France - [email protected]
KEY WORDS: Building energy modelling, Heating and cooling needs, 3D city model, Validation, Python, TRNSYS
ABSTRACT:
Cities play an important role in reaching local and global targets on energy efficiency and the reduction of greenhouse gas emissions. In order to determine the potential of energy efficiency in the building sector new planning instruments are required that allow depicting the complete building stock on the one hand and investigate detailed measures on the other hand. To pursue this objective, the ISO 13970:2008 monthly heating and cooling energy model is implemented using an open source based software architecture (CityBEM), in connection with data from 3D city models in the CityGML standard (LOD2). Input parameters such as the building geometry, typology and energy characteristics have been associated with the 3D data. The model has been applied to several urban districts with different numbers of buildings in the city of Karlsruhe. In order to test the accuracy of the implemented model and its robustness, a 3-step validation has been conducted. The comparison of simulation results with results based on a TRNSYS simulation showed acceptable results for the studied application cases. The proposed approach can help urban decision makers to perform a city or district wide analysis of the building energy need which can be further used to prepare future scenarios or renovation plans to support decision making.
* Corresponding author
1. INTRODUCTION
Building energy modelling (BEM) and their implementation at various spatial and temporal scales have been performed for a number of years. Statistical and engineering models are used for a multitude of applications (Swan and Ugursal 2009). Use cases include the definition of low carbon energy strategies (Nouvel et al. 2015), increasing the energy efficiency for building refurbishment plans (Bahu et al. 2014), etc. Statistical methods are highly dependent on historical data of energy use, whereas engineering models are based on the physical properties of buildings and heat transfer calculations. The advantages and disadvantages for such modelling approaches at the scale of neighbourhoods are reviewed for example by Koch (2016), Chalal et al. (2016), Reinhart and Davila (2016) or Mendes, Ioakimidis and Ferrão (2011).
1.1 Application of the ISO 13790:2008 standard
ISO 13970:2008 standard provides a deterministic model to calculate heating and cooling energy needs (ISO 2008). It is one of a series of calculation methods for the design and evaluation of energy performance of buildings. Energy needs for space heating and cooling of buildings are calculated on the basis of the heat balance of the building zone at three different temporal resolutions: hourly, monthly and seasonal. Many studies have applied this approach with different assumptions and contexts. Several national authorities have also adopted a performance-based method using a monthly energy balance, for example Romania (Attia and Ana Muresan 2015) or South Korea (Kwak, Jo and Suh 2015). Vollaro et al. (2014) calculated the monthly cooling and heating energy performance of an old building in central Italy using the ISO 13970 based software named MC11300. The results were validated with the
the building and usage description in the three simulation tools, the energy needs varied significantly.
Furthermore, Sirén and Hasan (2007) applied the hourly and monthly methods using a model office building in Finland. The results were validated with the IDA-ICE building energy software, considering it as a reference. Vartieres, Berescu and Damian (2013) applied three different modelling approaches (e.g. ISO 13970 monthly, CODYBA and TRNSYS) to calculate the cooling energy demand of an office building in Bucharest. Then a comparative assessment on the modelling input parameters and results was performed. Table 1 provides an overview on some of the cited applications.
Table 1. Literature review on the use of ISO 13970 method All these studies have calculated the energy need for one building at a time, considering required model inputs e.g., solar radiations, floor areas and volumes, etc. With the availability of standardized 3D city models e.g. in CityGML format, (OGC 2012) and of different levels of details (LOD1, LOD2, etc.) across many cities in the world, the building energy related characteristics can accurately be calculated. Many recent studies have pointed out the potential for such applications (Biljecki et al. 2015; Bahu et al. 2014), but only few studies have considered the 3D building characteristics as inputs into the ISO method to analyse heating and cooling energy needs for a large number of buildings in a district or a city. Chalal et al.
(2016) performed a critical literature review of mainly 2D and 3D GIS based approaches for energy prediction models. (Eicker et al. 2012) calculated the monthly heat demand in three districts in Germany using the 3D city models and applying the German standard DIN 18599. Later (Nouvel et al. 2013) implemented the monthly ISO 13970 method with the 3D buildings data to calculate heating energy needs in the two residential districts in Karlsruhe (LOD1) and Ludwigsburg (LOD2). Recently, Nouvel et al. (2015) attempted to combine a statistical and engineering modelling approaches to ascertain the building heating needs in order to support urban energy policies on buildings. Agugiaro (2016) calculated the residential energy demand for both space heating and hot water following the simplified calculation procedure, as described by the Technical Specification UNI/TS 11300:2008-National annex to CEN standards (parts 1 and 2) in Italy. In this regard, the LOD2
data of the part of city of Trento was chosen as the study area. However, no validation was performed.
1.2 Research gaps
Based on the literature review on the use of ISO 13970:2008 standard, we observe that simulation was mostly performed on individual buildings. Some tools and software were developed for specific purposes and few open source implementations were realized. Some recent studies have adopted the 3D city models to assess energy needs based on country specific norms in some particular sectors (e.g., residential buildings). None of them performed for both heating and cooling energy need. Some 3D city model based studies performed validation of ISO method using consumption data; others did not perform robust validation of their implementation. A model should be validated against another model.
1.3 Main objectives
Considering the research gaps, the main objectives of this paper are to (a) implement the ISO method using the 3D city models to calculate the building heating and cooling energy needs on modelling steps, etc. is explained in Chapter 3. Then Chapter 4 explains the results and visualizes the main findings in 3D environment. Afterwards, a 3-step validation is performed in Chapter 5. Finally, a conclusion by highlighting the limitation and future development of the CityBEM model is drawn in Chapter 6.
2. DESCRIPTION OF METHOD
2.1 Monthly ISO 13970:2008 method
The monthly method is developed at a macroscopic level of thermal gains and losses and is based on the simplified representation of building physics. It takes into account dynamic effects by empirically determined utilization factors1 for heat losses or gains. The model calculates heating or cooling monthly energy demands, based on the balance between (a) the transmission and ventilation heat losses and (b) the internal and solar gains, in interaction with the building mass, external factors and occupant’s behaviour (ISO 2008).
The method is used worldwide by different national energy standard organizations and the results are proved to be accurate and robust in long term urban energy scenario development for a district having hundreds of buildings (Nouvel et al. 2015). Advantages are highlighted in several literatures e.g. (Kim et al. 2013), (ISO 2008), etc. The monthly ISO model also produces good results compared to other software such as EnergyPlus (Kristensen and Petersen 2016). It is also proved that this simplified quasi-steady state monthly method is able to predict year-round energy needs considering that the dynamic
1Utilization factor is a function mainly of the heat-balance ratio and the thermal inertia of the building (ISO 2008).
parameters are correctly determined (Corrado and Fabrizio 2007).
2.2 Main structure
The ISO 13970 monthly method is mainly structured into 4 main blocks: (a) definition of building boundaries for conditioned and unconditioned spaces (b) identification of the zones (single vs. multi zones2) (c) definition of the internal conditions for calculation of external climate, and other environmental data inputs (heat transfer losses, heat gain, etc.) (d) calculation of energy needs for heating and cooling, for each time step and building.
3. IMPLEMENTATION OF THE METHOD
3.1 Software architecture
Several software and tools are required for the implementation and the analyses of the monthly energy need of the 3D building. They are mainly open source and freely available (Figure 1).
Figure 1. Overview of different software and tool to implement the monthly ISO method into the 3D environment
Eclipse is an integrated development environment used in computer programming, which contains a base workspace and an extensible plug-in system for customizing the environment. For this study, the PyDev plug-in (http://www.pydev.org) is used to work with Python scripts. Python supports connection to the PostgreSQL database (https://www.postgresql.org). Queries to the database are written in SQL language between quotation marks into the Python script. pgAdmin III- an open source administration and development platform for PostgreSQL object-relational database is also used. Moreover, to treat the spatial data such as CityGML, the PostGIS extension is used to support to PostgreSQL database.
The 3DCityDB (http://www.3dcitydb.org/3dcitydb) is a free open source package consisting of a database schema and a set of software tools to import, manage, analyze, visualize, and export virtual 3D city models according to the CityGML standard. This software includes a tool for importing CityGML data into a PostgreSQL database. The software FZKViewer (https://www.iai.kit.edu/1302.php) is used to visualize and inspect CityGML data. QGIS is an open source Geographic Information System (GIS) application that provides data viewing, editing, and analysis. This software supports connection to PostgreSQL database. Finally, ArcScene is used to visualize the monthly energy need results in the 3D environment. The Feature Manipulation Engine (FME) is used to translation of spatial data e.g. conversion between shapefile and CityGML. The Meteonorm 7.1 software3 is used to collect
2 A multi-zone is composed of a multiple indoor units and an outdoor
unit, whereas a single zone consists of one indoor unit. 3http://www.meteonorm.com/de/downloads
the weather data on monthly average temperature and wind speed.
3.2 Required input data and data handling
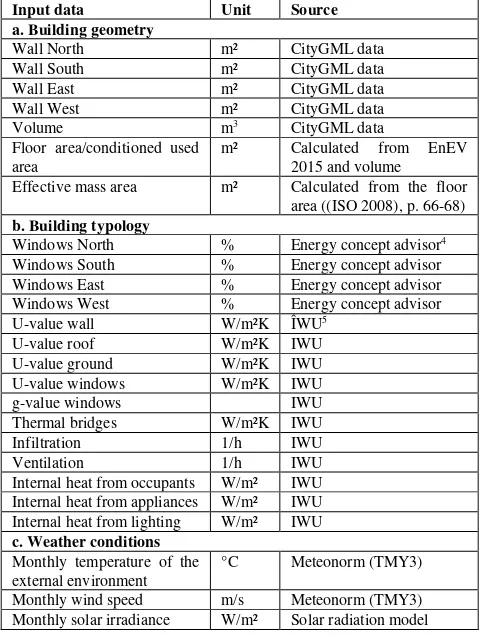
The ISO 13790:2008 monthly method mainly requires three categories of input data for modelling building monthly energy needs (Table 2).
Input data Unit Source a. Building geometry
Wall North m² CityGML data Wall South m² CityGML data Wall East m² CityGML data Wall West m² CityGML data
Volume m3 CityGML data
Floor area/conditioned used area
m² Calculated from EnEV 2015 and volume Effective mass area m² Calculated from the floor
area ((ISO 2008), p. 66-68) b. Building typology
Windows North % Energy concept advisor4
Windows South % Energy concept advisor Windows East % Energy concept advisor Windows West % Energy concept advisor U-value wall W/m²K ÎWU5
U-value roof W/m²K IWU U-value ground W/m²K IWU U-value windows W/m²K IWU
g-value windows IWU
Thermal bridges W/m²K IWU Infiltration 1/h IWU
Ventilation 1/h IWU
Internal heat from occupants W/m² IWU Internal heat from appliances W/m² IWU Internal heat from lighting W/m² IWU c. Weather conditions
Monthly temperature of the external environment
°C Meteonorm (TMY3) Monthly wind speed m/s Meteonorm (TMY3) Monthly solar irradiance W/m² Solar radiation model
Table 2. Required input data and corresponding source for the CityBEM monthly model
Data on building geometry is collected in 3D CityGML format (LOD2), which allows identification of individual walls, roofs or floor surfaces and thus allows calculation of conditioned floor area and building volume. Data on building typology describes the building attributes e.g. building type (single family house, apartment block, etc.), building age as well as building energetic characteristics such as U values, g-values, etc. They are collected from the typologies defined by the EU funded project Energy Concept advisor and the Institut Wohnen und Umwelt. The data on weather conditions such as monthly average temperature and wind speed data is collected from the Meteonorm 7.1 software as TMY3 format. The average monthly solar radiation for every building surface is calculated from a solar radiation model, which takes the shading of the buildings into account.
LOD2 CityGML data on building is imported into the Postgres/CityDB database with information about the geometry and the building coordinates. Then, using the python script, surface and volume of each building is calculated within the eclipse environment. Building typology data datasets are
4http://www.district-eca.de
5 Institut Wohnen und Umwelt GmbH (Institute for housing and
collected in excel or csv format. All these datasets are processed using python scripts and are stored as different tables in the PostgreSQL database (Figure 1).
3.3 Calculation steps
For each building and each month, the energy needs for heating and cooling are calculated in accordance with the suggestions provided by the ISO method. However, some key assumptions are made e.g., (a) each building is modelled as single zone, (b) The set-point temperatures, internal gains and air change rates are averaged according to the respective conditioned used area and (c) Reduction factor is taken into account for calculating intermittence heating and cooling need.
The CityBEM model is implemented in 7 main steps (Figure 2):
1. Calculation of heat transfer coefficient by transmission ( ) and ventilation ( )
2. Calculation of the total heat transfer ( ) assuming the time step t of one month
�ℎ =� +�� = (� +��). � , − .
(1) 3. Calculation of heat flows coefficient from solar
radiations ( ) and internal sources ( )
4. Calculation of total heat gains (
)
from the internal and solar heat gains, assuming the time step t of one month�� =�� +� = (�� +� ).
(2) 5. Calculation of the dynamic parameters:
utilization factor for heat losses (cooling mode), utilization factor for heat gains (heating mode) 6. Reduction factor for intermittent cooling ( ) and
heating ( )
7. Calculation of cooling and heating need: For the cooling mode:
��, =�� − .�ℎ
��, ,� =��, .��,
(3) For the heating mode:
��, =�ℎ − � .��
��, ,� =��, .��,
(4) Where,
Variable Unit Definition
and W/K Heat transfer coefficient by transmission and ventilation and W Heat flows coefficient from internal
sources and solar radiations MJ Total heat transfer (by transmission
and ventilation)
MJ Total heat gains (solar and internal gains)
t Month Time step is expressed in megasecond - Utilization factor for heat losses - Utilization factor for heat gains - Reduction factor for cooling - Reduction factor for heating MJ Energy need for the continuous
cooling mode
MJ Energy need for the continuous heating mode
MJ Energy need for the intermittent cooling mode
MJ Energy need for the intermittent heating mode
The calculation steps and equations are also implemented in the Eclipse using python scripts, PostgreSQL and other related tools. Several scripts and functions are written in modular structure. They are divided into 10 packages, which allows inspection of intermediate results of the individual model components. The intermediate results and final outputs the monthly cooling and heating energy needs are also saved as tables in the database from where automatized graphs are prepared. The database is connected with QGIS to visualize the results in 2D and is also exported to ArcScene for visualization in 3D environment.
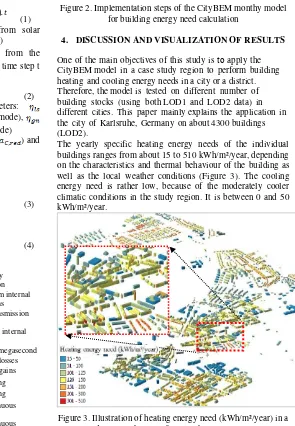
Figure 2. Implementation steps of the CityBEM monthy model for building energy need calculation
4. DISCUSSION AND VISUALIZATION OF RESULTS
One of the main objectives of this study is to apply the CityBEM model in a case study region to perform building heating and cooling energy needs in a city or a district. Therefore, the model is tested on different number of building stocks (using both LOD1 and LOD2 data) in different cities. This paper mainly explains the application in the city of Karlsruhe, Germany on about 4300 buildings (LOD2).
The yearly specific heating energy needs of the individual buildings ranges from about 15 to 510 kWh/m²/year, depending on the characteristics and thermal behaviour of the building as well as the local weather conditions (Figure 3). The cooling energy need is rather low, because of the moderately cooler climatic conditions in the study region. It is between 0 and 50 kWh/m²/year.
Figure 3. Illustration of heating energy need (kWh/m²/year) in a district in the city of Karlsruhe in Germany
Figure 4. Yearly specific building heating and cooling energy needs in 33 building typologies and corresponding number of
buildings in each typology
heating and cooling energy needs (left y-axis). As expected, the heating needs are higher than the cooling needs in most of the building typologies (except the workshop buildings built after 1984). The highest specific heating energy needs are observed in double-family buildings built between 1900 and 1948 and the lowest in office buildings built between 1995 and 2006. In general, the older buildings have higher heating needs whereas the office and workshops buildings (independent of construction year) show higher cooling needs.
(a)
(b)
(c)
Figure 5. Monthly specific heating and cooling energy needs for 7 building types and 5 age classes
The monthly pattern of the heating and cooling energy needs varies among the 7 building types (Figure 5: a, b). The double family buildings tend to have higher specific heating needs throughout the heating period (October to April) than the other building types. Regarding cooling energy needs, office buildings and high-rise apartment blocks demonstrate similar pattern during cooling months (June to August). The other residential buildings show minimum cooling needs. The older buildings as observed earlier, demonstrate higher specific heating energy needs than those of the recent buildings (Figure 5: c).
4.1 Model performance
The CityBEM monthly model is tested in several European and Asian urban cities, with varying number of buildings in both LOD1 and LOD2 data6. The multiprocessing package of Python is exploited to improve the computational efficiency of handling of large 3D city models. The model proves very efficient and quick in displaying results in the virtual machine7. For example, it takes around 3 minutes to run on about 4300 LOD2 buildings, 8 minutes on 12000 LOD2 buildings, 28 seconds on 600 LOD1 buildings, etc.
5. VALIDATION APPROACH
A comprehensive validation of the CityBEM monthly model is performed to justifies its applicability and robustness. At first, a review of the comparative validation results obtained by the different studies implementing the ISO 13970 method is performed. Second, to ensure the correct implementation of the method in python programming interface, the input values and corresponding results suggested in the Annex J of ISO document (ISO 2008), have been considered in the CityBEM. Finally, the energy needs of an office and a residential building are validated with a dynamic simulation model TRNSYS.
5.1 Validation of ISO 13970 method in other studies
ISO developers have internally carried out error estimation and validation of the monthly methods. They concluded that the
6LOD1 data of Kuwait, Abu Dhabi was generated from 2D, whereas the LOD2 data of Lyon was collected through personal contact. 7Linux server for Python is configured with 64GB Ram, 10 cores HDD,
monthly calculation gives correct results on an annual basis, but the results for individual months close to the beginning and end of the heating and cooling season can have large relative errors (ISO 2008), p. 15).
Recently, several studies as explained in Table 1, carried out validation of ISO methods with widely used dynamic simulation software such as TRNSYS or EnergyPlus. Kristensen and Petersen (2016) found out that the monthly quasi-steady-state model predicts a lower monthly energy need for space heating and higher monthly energy need for cooling compared to the dynamic model. Zangheri et al. (2014) found that the simplified monthly method tends to over-estimate the energy needs for cooling, especially for office buildings located in a Mediterranean climate. The results obtained by (Vollaro et al. 2014) confirms that the monthly method tend to overestimate and underestimate of approximately 12-14% the cooling and heating energy demands respectively, compared to the results obtained from the dynamic simulation with TRNSYS. Kim et al. (2013) carried out a deterministic and a stochastic comparison of simple hourly method with the EnergyPlus 6.0 software, with the inputs and boundary conditions for both approaches as close to each other as possible. They found that in the deterministic method, ISO 13970 predicts less annual heating and cooling energy demands than EnergyPlus. In the stochastic approach, EnergyPlus showed higher stochastic robustness than ISO 13790. However, Vartieres et al. (2013) found that the yearly cooling need obtained with the monthly method is almost three times higher than that of TRNSYS. From May to October, the predicted cooling demands by ISO 13790 are smaller than EnergyPlus ones, while in the other months the predicted cooling demands are larger than EnergyPlus (Kim et al. 2013). Earlier Kokogiannakis et al. (2008) confirmed that monthly method demonstrates higher cooling needs than the other methods. The EU study in the ENTRANZE project concluded that heating needs in ISO monthly and hourly are in line with EnergyPlus but the cooling needs are different in some climatic conditions (Zangheri et al. 2014).
Therefore, most of the studies found that the ISO method predicts less heating and more cooling needs, compared to the dynamic simulation software. CityBEM also shows similar patterns of cooling and heating needs (Chapter 4).
5.2 Validation with ISO 13970 reference
In order to validate the proper implementation of ISO 13970 method, e.g. use of the model equations, the ISO authors have given some exemplary input data and corresponding results in the Annex J of the document. Therefore, the robust implementation of the CityBEM model is checked using the exactly the same input values as suggested.
Figure 6. Comparison of energy needs with the assumptions explained in the ISO 13790:2008 (Annex J) for an office
building room
A test case consisting of an office building room with only one external wall facing west is considered. Other specific assumptions and simplifications (according to the suggestions) are made for the thermal heat flows and heat gains coefficients calculations. The results obtained by the CityBEM exactly match with the annex results (Figure 6). This justify the proper implementation of the ISO method in CityBEM.
However, in the annex example, not all input data and justifications are presented. Therefore, the validation of the complete model in the python script is not possible.
5.3 Validation with TRNSYS
TRNSYS software is used to simulate the behaviour of the transient system (http://www.trnsys.com). The simulations are focused on assessing the performance of thermal and electrical energy systems. In this study, TRNSYS is used to validate the results of the cooling and heating energy needs obtained by the CityBEM. Since TRNSYS cannot perform simulation on multiple buildings at a time, two individual buildings e.g. an office (built in 1975) and a residential building (built in 1985) in Karlsruhe are validated separately, with the same input data and assumptions as chosen in the CityBEM model.
5.3.1 Preparation of input data
Several inputs are required in TRNSYS. At first, the two buildings are extracted from the CityGML dataset to calculate the building geometries e.g. surface area of walls, roofs, etc. (Figure 7).
Surface type Area [m²] Wall_North 84.71 Wall_South 91.39 Wall_East 82.26 Wall_West 82.33 Roof _West 84.71 Roof_East 84.78 Ground 129.19
Figure 7. The CityGML building extracted for simulation in TRNSYS and corresponding geometric properties Parameters Residential
building
Office building Window area (m²) North 4.47 (4.9%) 9.27
(10.16%) South 11.19
(12.25%)
8.34 (9.13%) East 5.54 (6.74%) 10.08 (12.25) West 5.54 (6.74%) 11.39
(13.85%) U values (w/m²k) Wall 0.6 1.5
Roof 0.4 1
Floor 0.6 1.2 Window 2.7 2.9
G value [-] 0.75 0.75
Thermal bridges [W/m²K]
0.1 0.15
Infiltration [h-1] 0.2 0.2
Ventilation [h-1] 0.5 0.5
Internal heat gains [W/m²]
19.4 24.7
Set-point temperature Heating 20 20 Cooling 26 26
Table 3. Input data of the residential and office building in the TRNSYS simulation software
Then the building attributes and thermal characteristics (e.g. surfaces areas, thickness and composition of walls, roof and ground layers, etc.) are given as inputs in TRNSYS. Calculation of internal gains are different in both models, therefore, careful attention has been given to ensure the same input of heat gains in both models. For this reason, the internal gain was set considering the table from ISO 7730 as suggested in TRNSYS. Then, the scale was adjusted by considering the monthly aggregated values of the internal heat gains in order to ensure exactly the same inputs in both TRNSYS and CityBEM. Other parameters such as infiltration, ventilation, etc. are also considered identical in both models. The same Meteonorm weather data (wind speed, average temperature data) is given as an input. However, the TRNSYS software itself calculates the solar gain gains by the solar radiation model internally. An overview of the input datasets in TRNSYS software is given in Table 3.
5.3.2 Assumptions
Several assumptions are made to validate the CityBEM results with the TRNSYS. (a) Consideration of shading factors – calculation of solar gain in the CityBEM monthly method considers factors such as: shading reduction factor for external obstacles for the solar effective collecting area of surfaces, and form factor between the building element and the sky. Nevertheless, the irradiation data obtained from solar irradiance model already takes into account shading from external obstacles. Therefore, no shading reduction factor is considered in modelling solar gains in TRNSYS. (b) Averaging internal heat flow – In TABULA’s method (http://episcope.eu/iee-project/tabula) the internal heat flow is equal to 3 W/m² for every building type. In the example of ISO (Annex J), the internal heat flow is 20 W/m² from 8.00 to 18.00. So, the time average internal heat flow of 8 (=0.4 x 20) W/m² is considered in both approaches. This value refers to specific heat gains averaged for a day. (c) Introducing time reduction factors – continuous cooling/heating is unrealistic. In order to make a good comparison, the scheduling factors in TRNSYS and in the CityBEM model are defined appropriately by introducing a time reduction factor.
5.3.3 Discussion of validation results
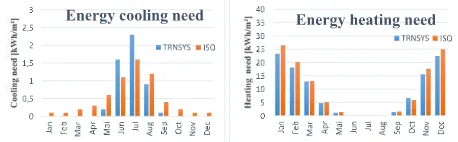
Considering all the inputs and assumptions, the ISO 13970 results (CityBEM model) of the heating and cooling energy needs of the residential and office buildings are validated with that of TRNSYS. Figure 8 and Figure 9 illustrate the comparative simulation results of the office building and the residential building, respectively.
For both of the buildings, the order of magnitude and the curve profiles are similar during the cooling and/or heating period in the TRNSYS simulation and the ISO based CityBEM model. The specific heating energy need obtained from the model is very similar to the TRNSYS simulation in different months. The relative error of the yearly heating is between 5% and 10%. So, the implemented CityBEM monthly model seems to be robust for heating. Concerning cooling energy need, the results obtained by both approaches are quite different. The relative error of the yearly cooling goes from 18% to 80%. The differences or the uncertainties of the ISO monthly result may lie in the case study region of Karlsruhe, which requires rarely any cooling energy in the summer months. Similar patterns was also observed by (Kokogiannakis et al. 2008). Therefore, it is essential to validate the cooling need in other regions where air conditioning is widely used.
Figure 8. Comparison of energy simulation results obtained with TRNSYS and CityBEM for an office building (1975)
Figure 9. Comparison of energy simulation results obtained with TRNSYS and CityBEM for a residential building (1985)
6. CONCLUSION
In this study, the CityBEM monthly model is developed through an open source implementation of the ISO 13970:2008 standard to calculate monthly heating and cooling energy need for a large number of building stocks in a city. It is based on the 3D city models of the CityGML standard and the required input parameter such as the building geometry, typology and energy characteristics have been associated with the 3D data. The model is applied in several urban districts with varying number of buildings stocks, using both LOD1 and LOD2 datasets. The robustness of the model is also tested using a 3-step validation approach. The model can help the decision makers or utility companies to determine the potential energy efficiency in the buildings and thus help in energy planning.
The monthly ISO method has several limitations, which have also been identified in other studies. It is based on steady-state conditions, the variation of parameters such as heat flows and heat transfer coefficient depends on the external temperature which is set to a constant value for each month (Vollaro et al. 2014). Vartieres et al. (2013) concluded that assuming constant temperature with fresh air introduced gives cooling loads during transition months, when introducing outdoor airflow could reduce the temperature. The ventilation airflow supplied from the outside with a smaller averaged external temperature gives heat losses by ventilation even during summer. Moreover, the users and their behaviour play an important role in calculating building energy needs. It was difficult to collect such exact data for each building. Regarding handling of 3D data, we observe geometrical and topological errors in the CityGML dataset which could not be completely imported into the postgresSQL database, resulting in exclusion of some buildings in analysis. Nouvel et al. (2013) and Agugiaro (2016) also explained such uncertainties e.g. geometrical precision, thermal building parameters estimation, etc. Another limitation is that each building is modelled as single zone. With the availability of more detailed building information e.g. LOD4 city models, buildings can be modelled as multi-zones.
methods, and they all agrees that the loss utilization factor formula is correct in its general equation, and that the numerical coefficient should be better defined for each specific case study. The model can, however, be further improved in future. The energy needs for heating and cooling can be used as an input for the energy balance of the heating and cooling systems and ventilation system in order to calculate the energy use. Hourly and seasonal energy can also be calculated. In this regard, the CityBEM monthly model can also be validated with the hourly method by aggregating the hourly values into months and years. The sensitivity of the critical model input parameters can also be tested in future. Building energy saving potential and further refurbishment priorities/scenarios can be simulated to identify further applications of the model. The model can also be adapted to support more detailed LOD3 or LOD4 datasets. For example, the exact window to wall ratio can be calculated from those datasets, which will improve the modelling results. Finally, a Graphic User Interface (GUI), considering the implemented open source software implementation in the 3D environment could be built to help the decision makers to fulfil the above-mentioned objectives.
ACKNOWLEDGEMENTS
We are grateful to the city of Karlsruhe for providing the 3D city models and EDF/EIFER for funding the research.
REFERENCES
Agugiaro, G. (2016) Energy planning tools and CityGML-based 3D virtual city models: experiences from Trento (Italy). Applied
Geomatics, 8, 41-56.
Attia, S. & A. Ana Muresan. 2015. Romanian Standards for Energy Performance in Buildings Translation of the Romanian Standards for Energy Performance in Buildings. Sustainable Buildings Design Lab.
Bahu, J.-M., A. Koch, E. Kremers & S. M. Murshed (2014) Towards a 3D spatial urban energy modelling approach.
International Journal of 3-D Information Modeling (IJ3DIM),
3, 1-16.
Biljecki, F., J. Stoter, H. Ledoux, S. Zlatanova & A. Çöltekin (2015) Applications of 3D city models: state of the art review.
ISPRS International Journal of Geo-Information, 4, 2842-2889.
Chalal, M. L., M. Benachir, M. White & R. Shrahily (2016) Energy planning and forecasting approaches for supporting physical improvement strategies in the building sector: A review. Renewable and Sustainable Energy Reviews, 64, 761-776.
Corrado, V. & E. Fabrizio (2007) Assessment of building cooling energy need through a quasi-steady state model: Simplified correlation for gain-loss mismatch. Energy and
Buildings, 39, 569-579.
Eicker, U., R. Nouvel, C. Schulte, J. Schumacher & V. Coors. 2012. 3D Stadtmodelle für die Wärmebedarfberechnung. In
Fourth German-Austrian IBPSA Conference. Berlin.
ISO. 2008. Energy performance of buildings - Calculation of energy use for space heating and cooling. In ISO 13970:2008, 162. Geneva, Switzerland: ISO/TC 163/SC 2 Calculation methods.
Kim, Y.-J., S.-H. Yoon & C.-S. Park (2013) Stochastic comparison between simplified energy calculation and dynamic simulation. Energy and Buildings, 64, 332-342.
Koch, E. A. 2016. Continuous Simulation for Urban Energy Planning Based on a Non-Linear Data-Driven Modelling Approach. In Fakultät für Architektur, Fachgebiet Bauphysik &
Technischer Ausbau. Karlsruher Instituts für Technologie.
Kokogiannakis , G., P. Strachan & J. Clarke (2008) Comparison of the simplified methods of the ISO 13790 standard and detailed modelling programs in a regulatory context. Journal of
Building Performance Simulation, 1, 209-219.
Kristensen, M. H. & S. Petersen (2016) Choosing the appropriate sensitivity analysis method for building energy model-based investigations. Energy and Buildings, 130, 166-176.
Kwak, H.-J., J.-H. Jo & S.-J. Suh (2015) Evaluation of the Reference Numerical Parameters of the Monthly Method in ISO 13790 Considering S/V Ratio. Sustainability, 7, 767-781. Mendes, G., C. Ioakimidis & P. Ferrão (2011) On the planning and analysis of Integrated Community Energy Systems: A review and survey of available tools. Renewable and
Sustainable Energy Reviews, 15, 4836-4854.
Nouvel, R., A. Mastrucci, U. Leopold, O. Baume, V. Coors & U. Eicker (2015) Combining GIS-based statistical and engineering urban heat consumption models: Towards a new framework for multi-scale policy support. Energy and
Buildings, 107, 204-212.
Nouvel, R., C. Schulte, U. Eicker, D. Pietruschka & V. Coors. 2013. CityGML-based 3D city model for energy diagnostics and urban energy policy supports. In 13th Conference of
International Building Performance Simulation Association.
Chambéry, France.
OGC. 2012. OGC City Geography Markup Language (CityGML) Encoding Standard 2.0.0. Open Geospatial Consortium.
Reinhart, C. F. & C. C. Davila (2016) Urban building energy modeling–A review of a nascent field. Building and
Environment, 97, 196-202.
Sirén, K. & A. Hasan. 2007. Comparison of two calculation methods used to estimate cooling energy demand and indoor summer temperatures. In Clima 2007 WellBeing Indoors. Swan, L. G. & V. I. Ugursal (2009) Modeling of end-use energy consumption in the residential sector: A review of modeling techniques. Renewable and sustainable energy
reviews, 13, 1819-1835.
Vartieres, A., A. Berescu & A. Damian. 2013. Energy demand for cooling an office building. In 11th International Conference
on Environment, Ecosystems and Development, 132-135.