EVALUATION METHOD OF WATER QUALITY FOR RIVER BASED ON
MULTI-SPECTRAL REMOTE SENSING DATA
X. XIAO a, b, *, X. Jian b, W. Xiongfei b, H. Chengfang b, C. Xuejun b,W. Zhaohui b ,Z. Dengzhong b
a
School of Resource and Environmental Sciences, Wuhan University, Wuhan, China – [email protected] b
Changjiang River Scientific Research Institute, Changjiang Water Resource Commission, Wuhan, China
KEY WORDS: Han River, Multi-Spectral Data, Retrieval, Water Quality Evaluation, Neural Network, ZY-3, HJ-1A
ABSTRACT:
With the rapid development of the regional economy, water pollution has gradually become an environmental problem that cannot be
ignored. As an important water source in central China, the Han River should strengthen water quality monitoring and management
in order to ensure the sustainable development of watershed and related areas. Taking typical sections of middle and lower reaches of
the Han River as the study area, this paper focuses on rapid river water quality assessment using multispectral remote sensing images.
Based on measured water quality data and synchronous spatial high and medium-resolution remote sensing data (multi-spectral data
of ZY3 and HJ1A) in 2013, neural network algorithm is used to establish water quality index retrieval model for the study area, and
then water quality status is assessed accordingly. The results show that BP neural network retrieval model of water quality index that
is established based on multispectral data of ZY3 satellite has higher accuracy and that its assessment results are of high credibility
and strong applicability, which can really reflect changes in water quality and better achieve water quality assessment for the study
area. In addition, water quality assessment results show that major excessive factors in the study area are total nitrogen and total
phosphorus; the polluting type is organic pollution; water quality varies greatly with seasons.
1. INTRODUCTION
Water quality evaluation is a fundamental link in water
environment management and monitoring. Only through water
quality monitoring can water quality be reasonably evaluated
and targeted water environment management planning and
scheme be developed. In terms of water quality evaluation,
traditional methods like water sample collection, indicator
analysis and grade evaluation can only provide water quality
status at the sampling point instead of large area of waters,
while large-scale field sampling will consume a large amount
of manpower, materials and financial resources. In recent years,
with the rapid development of remote sensing technique, more
and more researchers carried out fast, continuous and dynamic
monitoring on waters by means of remote sensing technique.
Further, this technique has been adopted by lots of domestic
and foreign scholars on water quality evaluation (Wu, 2012, Gu,
2014, Zhu, 2013, Bitelli, 2010, Markogianni , 2014,
Syahreza ,2012, Alparslan, 2007, Thiemann , 2000), and most
of these studies used remote-sensing data to quantitatively
retrieve concentration of water quality parameter and then
establish a water quality evaluation model on this basis. The
difficulty of this method mainly lies in the establishment of a
definite linear relationship between remote sensing data and
water quality parameter. Existing studies have shown that
neural networks can better simulate the complex nonlinear
relationship between remote sensing signal and water quality
parameter concentration and have significantly higher retrieval
accuracy than empirical models (Keiner,1998, Buckton, 1999,
Schiller,1999, Gross,1999, Karul,2000, Zhang, 2002,
Wang,2003, Lv,2006, Zhao,2009). Among numerous neural
networks, BP neural network is mainly used for function
approximation and is thus involved in the establishment of
remote sensing retrieval model of water quality parameter
Although remote sensing technique exhibits many advantages
in terms of water quality evaluation, current studies mostly
adopt medium-resolution remote sensing images. Due to their
time advantage (for instance, the HJ-1A/1B developed by
China independently has a revisiting cycle of 4 days), water
quality status can be monitored in a real-time manner and water
quality evaluation can be updated rapidly. Yet, as these images
have relatively low resolution, their application to lakes with
smaller inland area, narrow rivers or reservoirs are largely
limited. On January 9, 2012, a civilian high-resolution stereo
mapping satellite "ZY-3", the first one of its kind in China, was
successfully launched of which the multispectral data's
resolution is 5m and the revisiting cycle is 5 days. Through the
satellite, nationwide multispectral images can be obtained in a
continuous, stable and rapid manner over a long period of time.
With typical section of middle and lower reaches of Han River
as the study area, based on BP neural network algorithm, this
paper makes use of the measured water quality monitoring data
acquired in summer and autumn in 2013 as well as the
multispectral data of the satellites ZY-3 and HJ-1A to establish
a water quality parameter retrieval model of the study area,
conduct water quality evaluation of the Han River and draw a
water quality map of the study area.
2. DATA AND METHODS 2.1. Study Area
The middle and lower reaches of Han River is not only an
important water source for cities along the River but also serves
as a water body with important water environment functions.
According to Environmental Status Bulletins reported by Hubei
Provincial Environmental Protection Bureau in 2000-2012,
water quality of Han River tends to be improved year by year
as a whole. Historical monitoring data show that the pollution
type of Han River is organic pollution and that the main excess
items are total phosphorus (TP) and ammonia nitrogen (TN)
(Environmental Protection Bureau of Hubei Province,
2000-2012).
2.2. Relevant Data and Water Quality Evaluation Methods
Based on field investigation, with Xiantao section of Han River
as the study area, the author determined 9 monitoring sections,
conducted field experiments in summer and autumn of 2013
and obtained the multispectral data of the satellites HJ-1A and
ZY-3 in the same period. According to Environmental Quality
Standards for Surface Water (GB3838-2002), Class III water is
regarded as the control objective. Although a lot of methods
can be used for water quality evaluation, the previous study
considers (Xiao, 2013a, Xu, 2005) that single factor water
quality identification indicator (SFWQII) is most suitable for
this study area, so this method is also applied in this research.
The evaluation results show that major excessive substances of
the monitoring sections are total nitrogen (TN) and total
phosphorus (TP). Both these two items exceed certain limits to
varying degrees in summertime. Among them, TN indicator
exceeds the Class III water limits and gets close to Class IV
water limits in summer; as for autumn, this indicator is a bit
improved but is still above the Class III water limits for some
monitoring sections. TP indicator in summer also goes above
the Class III water limits and gets close to Class III water limits
for some monitoring sections, while it gets better in autumn,
living up to the limits of Class III water (Figure1).
(a)
(b)
Figure1. Statistical results of SFWQII of TN and TP in the
study area, (a) TN-SFWQII,(b)TP-SFWQII
2.3. Image Data
ZY-3 are adopted. Image data consistent with field sampling
time are acquired and preprocessed, including geometric
correction, radiometric calibration and atmospheric correction
(Xiao, 2013b, Yang.2013).
“HJ-1” Satellite System is an earth observation system
specifically designed by China for environment and disaster
monitoring, which consists of two optical satellites (HJ-1A and
HJ-1B) and one radar satellite (HJ-1C). By means of optical,
infrared and hyperspectral detection methods, this system can
dynamically monitor environment and disasters on a large-scale,
all-weather, and 24-hour basis. Among them, HJ-1A is
characterized by four-band multispectral data, a spatial
resolution of 30m and a revisiting cycle of 4 days.
"ZY-3" Satellite is the first civilian high-resolution optical
stereo mapping satellite independently developed and
successfully launched by China, whose main task is to obtain
nationwide high-resolution stereo images and multispectral
images continuously, steadily and quickly over a long period of
time (Zhao, 2014). These images can be then used for land
resources investigation and detection, disaster prevention and
mitigation, agriculture, forestry and water conservancy as well
as ecological environment. This satellite has been equipped
with four linear push-broom optical cameras, including three
full-color cameras and one multispectral camera. Among them,
the multispectral camera includes four bands: red, green, blue
and infrared and has a ground resolution of 5m and a revisiting
cycle of 5 days. ZY-3 owns higher image quality and has
stronger information extraction ability than SPOT5 in terms of
water elements except for vegetation (Li, 2014). It can basically
replace similar satellites like SPOT-5, P5 and ALOS in China
(Fu, 2013).
3. MODELS
BP neural network model (back-propagation) is the most
common one among neural network classifiers. One of its most
important applications is function approximation. It can create
any non-linear non-significant function mapping relationship
from input to output for the training set and is suitable for the
quantitative remote sensing retrieval study of water quality
parameters. As a result, BP neural network is used in this paper
to establish a retrieval model for concentrations of TN and TP
on the basis of multispectral data from HJ-1A and ZY-3.
value are between -1 and 1. As the samples for experiments are
not in great numbers, K-fold cross-training method is used to
get more stable simulation results. According to the existing
research results (Xiao, 2013a, 2013b), the bands which are
most correlated with the concentration of target parameters are
selected to participate in the establishment of the model. That is
to say, four bands in the multispectral data of the two satellites
are chosen as the inputs (for TP, the inputs are B3 and B4). The
concentration of TN (TP) are taken as the expected outputs; the
initial learning rate is set as 0.05, the display cycle 1000, the
numbers of learning iterations and neurons in the hidden layer,
in consideration of fitting speed and accuracy, S-type function
is adopted for the neurons in the hidden layer, while a linear
(a)
(b)
(c)
(d)
Figure2. Comparisons of accuracies of SFWQII for TN and TP
in the study area based on different image data
(a) 2013-TN-summer, (b) 2013-TN-autumn,
(c) 2013-TP-summer, (d) 2013-TP-autumn
It can be seen from Figure 2 that, for TN, two evaluation
standards RE andRMSE should be taken into account. No
matter in the summer or autumn of 2013, the evaluation results
obtained through multispectral data of ZY-3 are closer to those
of measured data. In addition, when TN indicator gets better
(namely, TN concentration decreases), the retrieval results
obtained based on multispectral data of ZY-3 still maintain a
low error, while in the similar case, the fitting results from
multispectral data of HJ-1A experience increased error and
enhanced volatility, and a large gap can be identified between
the simulation evaluation results of some samples and the
measured evaluation results (for instance in autumn, RE of
Sample 8 is 12%).
TP indicator also shares some similarities with TN indicator.
The evaluation results obtained from ZY-3's multispectral data
are more in line with the actual situation. In the summertime of
2013, the simulation evaluation results of individual monitoring
sections based on HJ-1A's multispectral data have larger errors,
while other sections are not; in the autumn of the same year,
this indicator gets better (the concentration goes down) and the
evaluation accuracy still reduces.
4.2. Water Quality Evaluation
By means of BP neural network (resilient BP algorithm), based
on the multispectral data of ZY-3 and HJ-1A, the spatial
distribution map of single factor water quality identification
index for TN and TP in the study area is made in the ENVI and
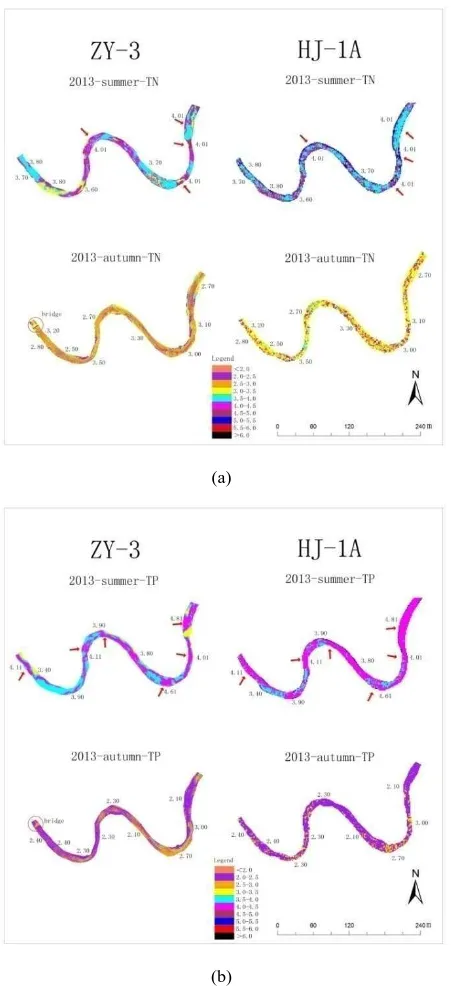
(a)
(b)
Figure 3. Spatial distribution of SFWQII for TN and TP in the
study area, (a)SFWQII-TN,(b)SFWQII-TP
It can be seen from this map that, compared with SFWQII
based on measured data (the figures marked on the map reflect
the SFWQII obtained from measured data), both these two
kinds of multispectral data can get the evaluation results similar
to measured data. However, the comparisons indicate that, the
spatial distribution map for SFWQII from ZY-3's multispectral
data has a higher accuracy, which not only accurately reflect
the level of distribution of water quality indicators in the study
area (the arrow points out the high value area), but also
precisely identify non-water parts (as shown by the circles in
Figure 3. (a) and Figure 3. (b)); Yet, as for the spatial
distribution map for SFWQII from HJ-1A's multispectral data,
although it is able to reflect the overall water quality status of
the study area, the levels of distribution of water quality
indicators can only be roughly expressed; when we need to
know the upstream and downstream statuses of a certain
section with high indicator value, the specific evaluation results
acquired are less reliable than those results from ZY-3's
multispectral data, which is mainly attributed to the low spatial
resolution (30m) of these data.
5. CONCLUSIONS
The water quality evaluation conducted based on remote
sensing data supplements the traditional evaluation work. In
this paper, the multispectral data from two domestic satellites
(ZY-3 and HJ-1A) are used to establish a remote-sensing
retrieval model of concentrations of TN and TP through BP
neural network (resilient BP algorithm) and conduct water
quality evaluations on typical section of middle and lower
reaches of the Han River. Comparisons reveal that, ZY-3 s'
multispectral data can get more reliable water quality
evaluation results and higher-resolution spatial distribution map
of these results. Besides, the evaluation results based on ZY-3
s' multispectral images not only reflect the overall water quality
status of the study area, but also reveal the upstream and
downstream water quality statuses of a certain section with
high indicator value and precisely identify non-water parts.
From the perspective of research results, the multi-spectral data
from ZY-3 and HJ-1A are good sources for remote sensing data
of retrieval models of concentration of water quality parameter,
and the researchers may selectively make use of their
advantages to conduct water quality evaluation work of inland
rivers. Based on the data obtained in summer and winter of
2013, the advantage of ZY-3's short revisiting cycle is not
reflected, and future studies should focus on this point more; in
the meantime, the data from ZY-3 and HJ-1A can be further
used for the dynamic monitoring and simulated forecasting of
water quality in inland waters.
1. ACKNOWLEDGEMENTS
This work was funded through a grant from the Basic Research
Operating Expenses for the Central-level Non-profit Research
Institutes of China (No. CKSF2012047/KJ, No.CKSF2014035/
China (No.41201452, No.41301435), and International S&T
Cooperation Program of China (NO.2012DFR70760).
2. REFERENCE
Wu, M. Q., Niu, Z., Gao, S., et al., 2012. Land-sourced Sewage
Outfalls Monitoring in Circum-Bohai Region Using
Multi-scale Remote Sensing Data. Geo-information Science,
14(3), pp. 405-410.
Gu, Q., 2014. Water quality evolution analysis and risk
assessment for drinking water reservoir in Zhejiang Province.
Zhejiang University, Zhejiang, China.
Zhu, L., 2013.Water quality analysis and evaluation of current
situation in the Riparian of west Lake Taihu in Yixing. Nanjing
Forestry University, Nanjing, China.
Bitelli, G., & Mandanici, E. (2010, October). Atmospheric
correction issues for water quality assessment from Remote
Sensing: the case of Lake Qarun (Egypt). In Remote Sensing,
International Society for Optics and Photonics, pp.
78311Z-78311Z.
Markogianni, V., Dimitriou, E., & Karaouzas, I., 2014. Water
quality monitoring and assessment of an urban Mediterranean
lake facilitated by remote sensing applications. Environmental
monitoring and assessment, 186(8), pp. 5009-5026.
Syahreza, S., MatJafri, M. Z., Lim, H. S.,et al., (2012,
November). Water quality assessment in Kelantan delta using
remote sensing technique. In SPIE Security+ Defence,
International Society for Optics and Photonics, pp.
85420X-85420X.
Alparslan, E., Aydöner, C., Tufekci, V., et al., 2007. Water
quality assessment at Ömerli Dam using remote sensing
techniques. Environmental monitoring and assessment,
135(1-3), pp. 391-398.
Thiemann, S., & Kaufmann, H., 2000. Determination of
chlorophyll content and trophic state of lakes using field
spectrometer and IRS-1C satellite data in the Mecklenburg
Lake District, Germany. Remote Sensing of Environment, 73(2),
pp. 227-235.
Keiner, L. E., & Yan, X. H., 1998. A neural network model for
estimating sea surface chlorophyll and sediments from thematic
mapper imagery. Remote sensing of environment, 66(2),
pp.153-165.
Buckton, D., O'mongain, E. O. N., & Danaher, S., 1999. The
use of neural networks for the estimation of oceanic
constituents load on the MERIS instrument. International
journal of remote sensing, 20(9), pp.1841-1851.
Schiller, H., & Doerffer, R., 1999. Neural network for
formulation of an inverse model-operational derivation of
case-Ⅱwater properties from MERIS data. International journal of
remote sensing, 20(9), pp. 1735-1746.
Gross, L., & Thiria, S., 1999. Applying artificial neural network
methodology to ocean color remote sensing. Ecological
modeling, 120, pp.237-246 .
Karul, C., & Soyupak, S., 2000. Case studies on the use of
neural networks in eutrophication modeling. Ecological
modeling, 134, pp.145-152.
Zhang, Y., Pulliainen, J., Koponen, S., & Hallikainen, M.,
2002.Application of an empirical neural network to surface
water quality estimation in the Gulf of Finland using combined
optical data and microwave data. Remote Sensing of
Environment, 81(2), pp. 327-336.
Wang, J. P., Cheng, S. T., Jia, H. F., et al., 2003. An artificial
neural network model for lake color inversion using TM
imagery. Environmental science, 24(2), pp. 73-76 .
Lv, H., Jiang, N., & Luo, L. C., 2006. Quantitative retrieval of
chlorophyll a by remote sensing in Taihu lake based on TM
data. Scientia geograhica sinica ,26(4), pp. 472-476.
Zhao, Y. Q., Wang, X. L., & Xue, S., 2009. Study on neural
network model for Weihe River water quality retrieving using
remote-sensing image. Remote sensing technology and
application, 24(1), pp. 63-67.
Reynolds, C. S., Huszar, V., Kruk, C., et al., 2002. Towards a
functional classification of the freshwater phytoplankton.
Journal of plankton research, 24 (5), pp.417-428.
Li, H., Liu, C.G., Fan, J., et al., 2009. Application of
Back-Propagation Neural Network for Predicting
Chlorophyll-A Concentration in Rivers. CHINA WATER &
Reynolds, C. S., & Maberly, S. C., 2002. A simple method for
approximating the supportive capacities and metabolic
constraints in lakes and reservoirs. Freshwater Biology, 47(6),
pp.1183-1188.
Kuo, J. T., Hsieh, M. H., Lung, W. S., et al., 2007. Using
artificial neural network for reservoir eutrophication prediction.
Ecological modelling, 200(1), pp.171-177.
The Environmental Protection Bureau of Hubei Province,
2000-2012.Surface Water Environment Quality Bulletin -
Hubei province environmental condition, Hubei, China.
Xiao, X., Hu ,C. F., Wen, X. F., et al., (2013a Apr). A study on
water quality assessment in typical area of middle and lower
reaches of the Hanjing river, ISRSE35, Beijing.
Xu, Z.X., 2005. Single Factor Water Quality Identification
Index for Environmental Quality Assessment of Surface Water,
Journal of Tongji University (Natural Science) , 33(3), pp.
321-325.
Xiao, X., Hu, C.F., & Xu, J., 2013b. The technical report of
multi-source remote sensing monitoring and evaluation method
for water quality in Hanjiang River. Changjiang River Water
Resource Commission Changjiang River Scientific Research
Institute, Wuhan, China.
Yang, L., Pan, Z.Q., Fu,Q.Y., et al., 2013. Research on the
Atmospheric Correction for ZY-3 Image. Spectroscopy and
Spectral Analysis, 33(7), pp.1903-1907.
Zhao, F., Zhu, F. Q., Feng, Z.K., et al., 2014.Study on Water
Body Information Extraction Method Based on ZY-3 Imagery.
Bulletin of Surveying and Mapping, 3, pp.007.
Li, L., Luo, H., Tang, X. M., et al., 2014. Characteristic
analysis and quality assessment of ZY-3 multi-spectral image.
REMOTE SENSING FOR LAND & RESOURCES, 26(1), pp.
17-24.
Fu, X.K., 2013. The information and emergency application of