COMPUTATIONAL VISION IN UV-MAPPING OF TEXTURED MESHES COMING
FROM PHOTOGRAMMETRIC RECOVERY: UNWRAPPING FRESCOED VAULTS
Robleda Prieto G. a, *, Caroti G. b, Martínez-Espejo Zaragoza I. b, Piemonte A. b
a “G.I.R.A.P.” (“Grupo de Investigación en Representación Arquitectónica del Patrimonio” – Architectonic Representation of Cultural Heritage Research Group) - Department of Representation and Architectural Theory – University of A Coruña, Rúa da
Fraga 8, Campus da Zapateira, 15008 A Coruña, Spain – [email protected]
b “Laboratorio A.S.T.R.O.” (“Applicazioni Scientifiche e Topografiche per il Relievo Operativo” – Scientific and Topographic Applications for Operational Surveying) - Dept. of Civil and Industrial Engineering – University of Pisa, Largo Lucio Lazzarino 2,
56126 Pisa, Italy – [email protected]
Technical Commission V, WG V/2
KEY WORDS: Structure from Motion, Low-cost, Cultural Heritage, Architectonic Restoration, Frescoed vaults
ABSTRACT:
Sometimes it is difficult to represent “on paper" the existing reality of architectonic elements, depending on the complexity of his geometry, but not only in cases with complex geometries: non-relief surfaces, can need a “special planar format” for its graphical representation.
Nowadays, there are a lot of methods to obtain tridimensional recovery of our Cultural Heritage with different ranges of the relationship accuracy / costs, even getting high accuracy using “low-cost” recovery methods as digital photogrammetry, which allow us easily to obtain a graphical representation “on paper”: ortho-images of different points of view. This can be useful for many purposes but, for others, an orthographic projection is not really very interesting.
In non-site restoration tasks of frescoed vaults, a “planar format” representation in needed to see in true magnitude the paintings represented on the intrados vault, because of the general methodology used: gluing the fresco on a fabric, removing the fresco-fabric from the support, moving to laboratory, removing the fresco from the fabric, restoring the fresco, gluing back the restored fresco on another fabric, laying the restored fresco on the original location and removing the fabric. Because of this, many times, an unfolded model is needed, in a similar way a cylinder or cone can be unfolded, but in this case with a texture included: UV unwrapping.
Unfold and fold-back processes, can be especially interesting in restoration field of frescoed vaults and domes at: chromatic recovery of paintings, reconstruction of partially missed geometries, transference of paintings on surfaces, etc.
* Corresponding author. This is useful to know for communication with the appropriate person in cases with more than one author.
1. INTRODUCTION
During a short stay research of the first author at “A.S.T.R.O. Laboratorio” (“Applicazioni Scientifiche e Topografiche per i Relievo Operativo” – Scientific and Topographic Applications for Operational Surveying) Research Group, he was putting in charge to research about a methodology to obtain unfolded textured curved models, in a way less manual than the one done until now by this research group [Bevilacqua, M.G.,et al].
To do, a “training” vault was chosen in order to find a valid methodology to be applied to “real” study cases. The “training vault” belongs to the “Palazzo dell’ Orologio” (Palace of the Clock), where the “Torre dei Gualandi” (Gualandi’sTower) was located, because of this the vault is named “Arco dei Gualandi”.
The original buildings suffered many renovations, up to be jointed the both main sets, till the actual configuration which forms the “Palazzo dell'Orologio”. At the ground floor, the original pass existing between both sets was respected, so the
“Arco dei Gualandi” vault was built to support the upper floors over the original street.
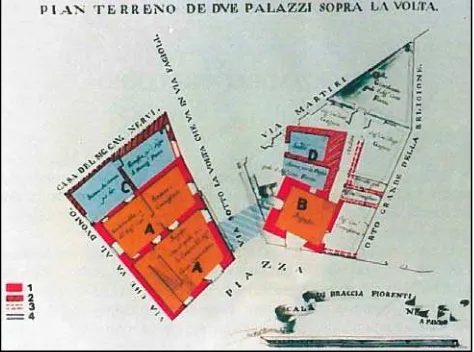
Figure 1 – Scheme of “Palazzo dell’Orologio” before 1754
In the previous figure, the different age areas are: 1 = medieval structure totally incorporated, 2 = medieval “quattrocenteshe” age structure partially incorporated, 3 = part of other structure partially embedded, 4 = “seicenteshe” age structure, A = “Palazzetto della Giustizia” (Court Hall Palace), B = “Torre della Fame” (Tower of the Hungry), C = little house property of Sancasciani, pisan citizen and D (and shading in stripes in blue) = structure belonging to Gualandi house.
The intrados vault was decorated with frescoed paintings by Bartolomeo Atticciati, following the typical program of Ridolfo Sirigiatti (a conservationist of Cultural Heritage), which involved all the works regarding the fields of building, agricultural and hydraulics, as well as the protection of the shareholders.
There was many reasons to have had this vault: firstly it’s located just in the city centre of Pisa, very close to our University office so we can go there easily, secondly it’s a well-known building, not only in Pisa but in everywhere, for having inside itself the “inferno” (the hell) related in “La Divina Comedia” (The Divine Comedy) book of Dante Alighieri so any person interested in can easy identify it, and finally it’s free accessible so anybody can visit it.
Gualandi was the name of a Pisan family that owned the tower in the 13th century. There, the earl Ugolino della Gherardesca, his sons (Gaddo and Uguccione) and two grandsons (Nino and Andelmuccio) were captured by his policy enemy, the bishop Ruggieri degli Ubaldini, and immured till starved to death (after nine months of captivity). Because of this, the Tower is known too by “Torre della Fame” (Tower of Hungry). Dante, his contemporary, wrote about Gherardesca in his masterpiece The Divine Comedy (XXXIII chapter: The Hell).
Nowadays the building lodges the ancient book area of the Library of the “Scuola Normale Superiore” (Higher Normal School) which is an “excellence” University well-known in both France and Italy, located at Pisa in “Pallazio della Carovana” in “Piazza de Cavalieri”.
The purpose of unfolding the studied textured mesh, is to obtain a planar format which allows us to see on it the representation in true magnitude, namely, non a projection of the paintings on a surface, as the artist has thought to be viewed by the human eye, but a format of representation where we can measure linearly in an easy way, as well as a format which can be used to fold-back a surface with a texture or map.
This processes of unfold and fold-back, are specially interesting in restoration field of frescoed vaults and domes: chromatic recovery of paintings, reconstruction of partially missed geometries, transference of paintings on surfaces [Regidor Ros J.L. et al], etc.
Unfolding results (see Fig’s 7 and 8) have already got, both graphical and textural, but through this work, it’s been trying to make it in an easier way (more automatized process). To do, perhaps a new methodology is needed, at least in the process to
Figure 6 – Panoramic view from Piazza dei Cavalieri with “Pallazo dell’Orologio” (at the left) and “Scuola Normale
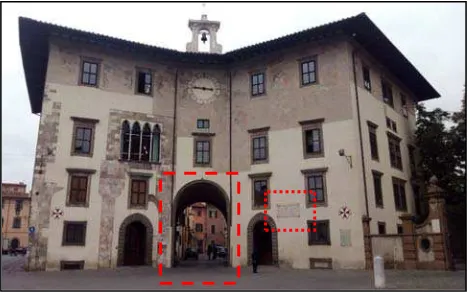
Superiore” Headquarter (at the right). Figure 2 – Actual view of the “Palazzo dell’Orologio”
building at Pisa (Italy) with the arch location on the main façade (discontinuous red line) in Piazza Cavalieri.
Figure 3 – Detail of “Arco dei Gualandi”.
Figure 4 – Stone plate reminding the tragedy of Earl Ugolino and his family, and its narration in "La Divina Comedia" Dante Alighieri's masterpiece (see Figure 3, red
unfold (or unwrap) the meshes, so computational vision is
incorporated. 2. METHODOLOGY AND RESULTS
In this study, we try to find a reliable way to unfold tridimensional meshes, for being mapped by using very dense point clouds getting from photogrammetric recovery and computational vision knowledge, by following the next methodology:
Recovering a 3D model of the vault through digital photogrammetry.
Scanning the vault to be studied to compare the obtained point cloud with the other one obtained from photogrammetric recovery, in order to assess the accuracy of the photogrammetric recovery.
Surveying some characteristics points of the vault, in order to scale the photogrammetric recovery, as well as getting the coordinates of the laser scanner locations and the HDS targets coordinates.
Once validate the photogrammetric recovery, making the mesh in photogrammetric software.
Unfolding the mesh on computational vision software and creating custom UV parametrization to apply on mesh.
Building real texture using the UV parameters.
2.1 Photogrammetry recovery
A previous study was done at office in order to get the maximum sharpness and definition of the paintings of the vault intrados, so it was considered three rows along which to locate the camera.
Figure 8 – Frescoed vault belonging to “Palazzo Roncioni” (Pisa, Italy), unfolded on planar format: UV mapping
[Martínez-Espejo Zaragoza I.].
Figure 9 – Unfolded surfaces of the frescoed intrados sectors of Brunelleschis’s Dome in “Basilica di Santa Maria
del Fiore” (Florence, Italy) [Cipriani L. et al]. Figure 7 – Unfolding of paintings represented on the vault of the House of Justice of the Pitti Palace (Florence, Italy). Unfolding the curved surface of the vault on planar format, allows us to get the representation of what has been drawn
directly on the fresco. In addition to the study of the techniques of the drawing, this procedure allows also the
correct mapping of surfaces in real magnitude, for diagnostics and the eventual restoration. [Bertocci S.].
Figure 10 – Previous study of camera
locations.
Figure 11 – Dense Point Cloud focused on central intrados area and camera locations in the central row.
Figure 12 – Photogrammetric DPC left first third area and
camera locations in right lateral row.
Figure 13 – DPC right first third intrados area and camera locations in
By this disposition of the cameras, the shooting distance to the vault intrados was more or less the same [Cueli J.T., 2011]. As a result of this previous study, 174 images were considered needed but once in situ, the final number of images were 177.
Once blended the three photogrammetric resultant sub-projects, a beautiful dense point cloud of the whole intrados was obtained with a very high definition (even before applying real photo realistic textured) due to the amount of points: 18M. Probably, this amount of point would be enough to define not only the geometry of paintings but the colours too. Thinking in “unwrapping” the points, as other authors asseverate to did, it could be interesting do a very dense point cloud, which it is not the case because our proposal is to unwrap the textured mesh (not only points). Anyway, to assess the accuracy of the photogrammetric recovery against the scanned recovery, a dense point cloud was wished.
The images were taken with a camera Nikkon D700 and the shooting parameters were those which allows a balanced ilumination conditions as done in other photogrammetric recoveries [Robleda Prieto G., 2014a, Robleda Prieto G. et al, 2015]:
focal length = 50 mm (fixed optic, no variable focal length)
ISO = 200 (the lower one available in the used camera)
aperture value = f/11
shutter speed = 1/10 seg.
RAW format converted to JPEG format once balanced exposure, lighning and b/w levels.
Although the camera was put on tripod (to avoid trepidations), the photos were shot in high wind conditions, which was more intense under the vault because of the stream generated by the "street channel". This could have affected to the accuracy of the photogrammetric recovery.
The recovery could be solved successfully by only the two lateral row-locations of the camera. This would have avoided the central row-locations which it could be interesting in order to not disturb the traffic, allowed under the vault, any way we were very fortunate in central-locations shoots because drivers were too much considered with our work.
2.2 Laser scan recovery
Four scans were done from both lateral locations which were chosen carefully in order to not disrupt the traffic flow: each scan lasted around 15 minutes so traffic couldn’t be cut for so much time versus the time spent by shooting photos from each central location (around 5 minutes to take 5 images).
In order to get more accuracy, HDS Leica 3 poll targets were used to get sub-pixel precision: three HDS targets were located on the wall to medium height and another three in the opposite side.
Between each pair of targets belonging to the same wall, Terrestrial Laser Scanner was located, near to wall in order to allow the traffic flow. By this layout, from each TLS location, four HDS targets could be sighted, for linking then the four scans done.
The whole point cloud supplied by the laser scanner was cut in a similar size to the photogrammetric point cloud, covering the studied area (intrados vault, from the impost lines), so people, noise and artefacts due to traffic and other mobiles, were no problem.
Figure 14 – Global Dense Point Cloud: more than 18M points give sharpness and definition enough to the photogrammetric project and at the same time, enough
points to be compared with the ones got by scanning.
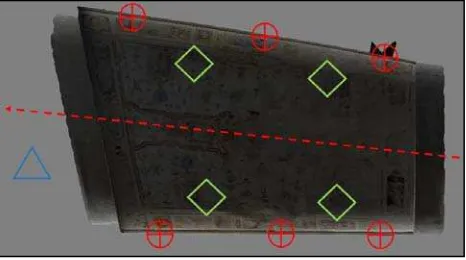
Figure 15 – Scheme of the locations of the HDS targets (red), TLS stations (green), LTS (green), as well as the
traffic flow line on a plan zenithal view.
Figure 16 – Scanned Point Cloud which is displayed segmented in a similar size (17.9M) to the photogrammetric
2.3 Topographic survey
A topographic survey was done with a laser total station in order to:
Scaling the photogrammetric recovery: through GRP’s (Ground Reference Points).
Assessing the accuracy of the photogrammetric recovery: through the GCP’s (Ground Control Points).
Getting a common reference system to assess the deviation of the photogrammetric recovery regarding to the scanned recovery: by measuring with the laser total station not only GRP’s / GCP’s but as well the targets used to scan (in a sub-pixel accuracy way) and the locations of the laser scanner.
In this case GRP’s and GCP’s were considered the same, namely, every GCP was used to assess the accuracy into the photogrammetric recovery software and at the same time to scale the model: more points are used to scale the model less error can be obtained in scaling process.
The GRP’s / GCP’s were chosen in situ, following the same methodology used [Robleda Prieto G., 2014b] in other photogrammetric surveys under the next thinking:
Taking photographs with the camera of a tablet device: if possible to see any characteristic point in the image captured by this way, surely this points well be seen in the images used in photogrammetric recovery (taken by the more resolution camera).
Looking for clear points (“natural targets”) in the images taken through the tablet device, so much equally distributed as possible.
Editing the images in the tablet device, in order to choose the “natural targets” (unmistaken points) which are going to be GCP’s / GRP’s, and assign them a code (number) which is the same of the ID point in total station.
All this GRP’s / GRC’s and all the HDS targets and laser scanner locations, were measured (got the XYZ coordinates) from an unique location of the laser total station, because of traffic under the vault is allowed, so vehicle circulation shouldn’t to be disturbed. This could cause a problem: points to
be measured more away from the total station can arise poor or non-good measures due to low reflection angles for those points viewed foreshortening by the total station. In fact, 4 GRP’s / GCP’s had to be rejected, from a total pre-chosen 24), to reach an accuracy around 5.4 mm in the photogrammetric recovery (see Fig. 19).
As can be seen in the previous figure, some GCP’s have been to be disabled in the photogrammetric software, in order not to distort the photogrammetric recovery, because of some of these points probably weren’t good choice due to their high errors which can be due to many reasons: not high definition of the point at the images taken, visualitation of the points from the total station with low angles (coordinates obtained without accuracy enough), etc.
Figure 17 – View of the survey of Leica HDS 3’’ targets (circled in red colour) and location of “Leica C-10” TLS.
Figure 18 – View of GRP’s / GCP’s on the Photogrammetric Dense Point Cloud.
Figure 19 – Assessment chart of the accuracy in photogrammetric software and view of GRP’s / GCP’s on
2.4 Photogrammetric recovery VS Laser Scan recovery After to assess the accuracy the model was validated because the total error was only 8.7 mm, so the processes carried on with getting a Dense Point Cloud of the whole model (merged the two subprojects) 1with 2,423,632 points.
Both point clouds must be similar size to be compared, so the reference point cloud (the scanned one) has been cut in a similar size to the photogrammetric one. The used comparison software not allows to cut both point clouds at the same time to get same sized clouds, because of this in the statistics arising from the comparisons, the value of “maximum distance” always is going to be relatively high.
A first approach in the comparison software arise the first statistics with the next main values to be considered:
Máx. dist. = 0.4796: it represents the maximum distance between the point clouds. As aforementioned, this value could be so high if the reference point cloud hadn’t been cut. In this case, the maximum distance between both point clouds is around 48 cm.
Mean dist. = 0.001895: it represents the medium distance deviation between both point clouds.
Histogram: it displays the amount of points into a range of maximum distances. In this case the graphic shows that the 100% of compared points are between 0 and 0.59945 meters deviation away from the reference cloud.
After this first approach, the reference cloud was cut another time to try adjusting to the compared cloud and then new comparisons have been done in order to assess the accuracy of the photogrammetric survey by modifying the default value of the parameter “maximum distance” (at the point cloud comparison software) and analysing the results of statistics and graphics. “Maximum distance” tried parameters were: 20mm, 2mm, 3mm, 5mm, 6mm, 7mm, 8mm, 9mm and 10mm.
The drastic reduction of “Max. dist.” parameter to 2 mm revelled that a big amount of compared points (around 1.1M) were between 1.75 and 2 mm (or even more) away from the reference cloud.
The next comparison (Max. dist. = 3 mm) displayed through his histrogram that: the number of points away more than 3 mm
can be around 0.6M, as well as 1M were far away only 0.75 – 2.2 mm.
In the comparison to Max. dist. = 5 mm, almost 1M points were away 0 – 0.625 mm, around 10M points away 0.625 – 2.5 mm, around 3.5M points away 2.5 – 3.75 mm, less than 1M points away 3.75 – 4.25 mm and finally less than 2M point were away 4.25 – 5 mm (or even more).
In the 7 mm–Md-comparison more than 7M points were away form the reference cloud 0 – 1.7 mm.
The two next comparisons confirmed the tendency: 8mm-comparison = 8.5M points were away 0-2 mm and 9mm-comparison = 10M points away 0-2.25mm.
The last comparison was to Max. dist. = 10mm. The Histogram (as well as the profile close to the gradient bar: the less red colour the more proximity between compared point clouds) displayed that the mayor of points were away less than 3.75 mm. Red colours practically disappeared from the central area, which is the really interesting for us because of the paintings, except boundary zones, edges of imposta lines and stone arches. This mean that the area of the photogrammetric recovery to be studied has a deviation less than 5 mm in any case.
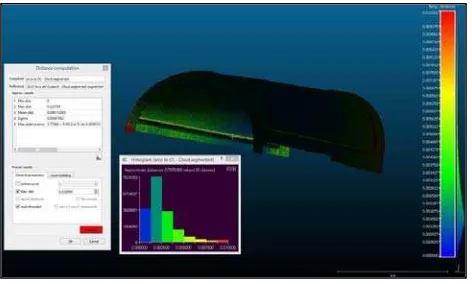
A zoom at the Histogram and more subdivided distance ranges, displayed with more detail the distribution of the graphic. Figure 20 – Overlap of the two point clouds to be compared
in “CloudCompare” software: in yellow colour the reference one (Scanned Point Cloud) and in red colour the
compared one (Photogrammetric Point Cloud).
Figure 21 – Comparison of both point clouds (PhPC and ScPC) to maximum distance = 10 mm and Histogram with 8
range columns of distance diferences.
As the deviations of the photogrammetric point cloud are less than 5 mm away from the reference cloud (got from the TLS Leica C-10), at least in the area to be studied (central painted zone), the photogrammetric survey has been considered accurate enough to be used in the next processes (making mesh, exporting mesh to unfold it, texturing mesh, etc.).
Moreover, the accuracy of the photogrammetric survey probably can be more accurate than shown by comparison software, because of, as aforementioned (see “2.3 – Topographic survey”), the quality of the GCP’s, as well as the location of the total station weren’t the optimal to set the best conditions to obtain the XYZ coordinates of GCP’s / GRP’s, HDS targets and TLS locations, to allow traffic circulation.
2.5 3D mesh
Once validated the photogrammetric recovery, this was used to do the mesh by triangulating the photogrammetric point cloud (PhPC). The advantage to use the photogrammetric recovery is that in the same software not only the point cloud can be obtained (from images) but as well the mesh can be built and then the mesh can be textured in a photorealistic way by applying the high definition images taken.
In order to ease the next processes to be done by the computer (even taking risks of accuracy reduction), the original Mesh obtained from the PhPC (Photogrammetric Point Cloud) was decimated from 868,135 faces and 435,851 vertices up to 10,000 faces and 6,318 vertices, amount considered enough to get the colour of each vertex to be after applied onto each face of the unfold mesh.
2.6 Unfold mesh
An unfolded mesh (“planar format” get from XYZ coordinates to UV coordinates), was obtained through a VisualC++ library thanks to the “Visual Computing Laboratory” belonging to the ISTI (Istituto di Scienza e Tecnologie dell’Informazione “A. Faedo”, namely Science and Technology of Information “A. Faedo”, located at CNR (Consiglio Nazionale delle Ricerche – Research National Council) of Pisa, Italy. “Visual Computing Laboratory”.
To use this kind of libraries, a regular model on which to project the real mesh is needed, in order to unfold a “mathematical” surface: more adapted the projection surface is to the real mesh, more accuracy can be obtained.
However, trying to simplify and automatized this process, a well-known free software (Blender) was used to do it.
Due to the frustoconical form of the vault, a conic projection was chosen (UV parametrization) to get the unfold mesh into Blender software.
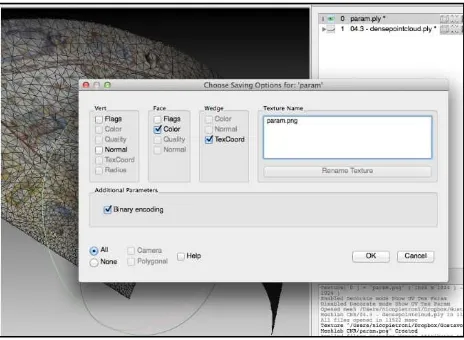
2.7 UV Mapping
Final process is to obtain the unfolded mesh with the texture. To do this we used the well-known MeshLab software, which was developed for the aforementioned “Visual Computing Lab - CNR” of Pisa. The steps followed to get it were the next:
Import the LPM (Low Poly Mesh) previously unfolded with Blender software into MeshLab.
Assign a texture to it: if the texture provided exists it will be simply associated to the current mesh else a dummy texture will be created and saved in the same directory
Load the HPM (High Poly Mesh) associated to the previous LPM. This HPM is the original mesh before to be decimated to be converted in a LPM to ease the process of unfold (see 2.5, second paragraph): the more density has the mesh, the higher definition can be obtained in the texture.
Transfer vertex attributes to the texture (point 2) between both meshes: from the “source mesh” (the HPM) to the “target mesh” (the parametrised in Blender, LPM): this is generally used to restore detail lost in simplification.
Save the final mesh with the texture. Figure 23 – Low Poly Mesh 10,000 faces, 6,318 vertices).
Figure 24 – View of the process to unwrap the Low Poly Mesh in Blender software.
3. CONCLUSIONS
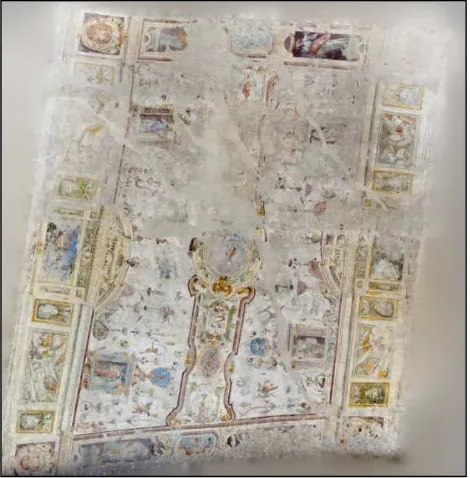
An unfolded textured mesh with resolution enough was obtained as desired (see next Figure).
This study case is regarding to a simple curvature surface. Double (or more) curvature vault cases must be object of next studies where the combination of different surfaces projection to be unfolded, must be needed.
The accuracy obtained in this case, was considered enough for the purposes hypothetically needed (restoration tasks of the frescos), around 1 cm, and it was checked by wrapping partial pieces of translucent paper, previously printed with de unfold textured mesh, onto some areas of the intrados vault.
The proposed methodology make easier and more accuracy other processes used until now.
The use of the textured mesh obtained from Photogrammetric Point Clouds, instead of Scanned Point Clouds, allows to obtain more sharpness and definition in the textured unfolded meshes. At the same time, the use of low-cost photogrammetric techniques, allows not only reduce costs arising from the other equipment like laser scanner, but to avoid problems as those coming from vehicle traffic.
4. ACKNOWLEDGEMENTS
Liubov Rozhkova (Agisoft Sales manager) and Diana Ovod (Agisoft Tehcnical Support), for providing an educational license of “PhotoScan Pro” and for replying all my questions.
Andrea Bedini and Jessica Micheloni to help us with the scannings and the topographic surveying.
Department of Civil and Industrial Engineering – Topography and Photogrammetry area of University of Pisa, for lending me a laser total station and a laser scanner.
Nico Pietroni and Paolo Cignoni (Visual Computing Lab – ISTI, CNR Pisa) to help me with the unfolding and texturing processes.
REFERENCES
Cueli López J.T. Fotogrametría práctica (Practical Photogrammetry). Edidiones Tantín. Santander 2011.
Robleda Prieto G. Levantamientos Topográficos mediante técnicas fotogramétricas de bajo coste y corto alcance. Proceedings of Graphic Expression applied to Building, XII International Conference – APEGA2014. Madrid, Spain.
Robleda Prieto G. Levantamiento Planimétrico de la portada de la Iglesia de Santiago en La Coruña mediante restitución fotogramétrica con métodos de bajo coste. Proceedings of Graphic Expression applied to Building, XII International Conference – APEGA2014. Madrid, Spain.
Robleda Prieto G., Pérez Ramos A. Modeling and accuracy assessment for 3D-virtual reconstruction in Cultural Heritage using low-cost Photogrammetry: surveying of the “Santa María Azogue” Church’s front. The International Archives of the Photogrammetry, Remote Sensing and Spatial Information Sciences, Volume XL-5/W4, 2015 3D Virtual Reconstruction and Visualization of Complex Architectures. 25-27 February 2015, Avila, Spain.
Bevilacqua, M.G., Caroti, G., Martínez-Espejo Zaragoza, I., Piemonte, A. "Frescoed Vaults: Accuracy Controlled Simplified Methodology for Planar Development of Three-Dimensional Textured Models". Remote Sens. MDPI, Suiza, 8, 239. 2016. pp. 1-16. doi:10.3390/rs8030239
Regidor Ros J.L., Palumbo M., Gómez Chaparro G., Clavel Piá I. Restoration and proposed solution for the esposure of conserved fragments in the vault of the Santos Juanes church located in Valencia. Arché 2006 n. 1. Instituto Universitario de Restauración del Patromonio de la UPV. Valencia, Spain.
Bertocci S. Architettura dell’inganno: artifice prospettici dei quadraturisti nella grande decorazione di Età Barocca in Toscana. Proceedings of “XI Congreso International de Expresión Gráfica aplicada a la Edificación”.
Martínez-Espejo Zaragoza I. Precisiones sobre el Levantamiento 3D integrado con herramientas avanzadas, aplicado al conocimiento y la conservación del Patrimonio Arquitectónico. Doctoral Thesis. Cap. 6. Universidad Politécnica de Valencia. 2014.
Cipriani L., Fantini F. Bertacchi S. Survey and representation of vaults and cupolas: an overview on some relevant Italian UNESCO Sites. ISSN 978-1-4799-7227-2/2014. European Union 2014.
Karwacka Codini E., Piazza dei Cavalieri: urbanistica e architectura del medioevo al Novecento. Cassa di Risparmio di Firenze, Firenze 1989.
Figure 26 – Final unfolded textured mesh.