Automated Measurement of Haemozoin Malarial Pigment) Area in Liver
Histology Using Image J 1.6
Conference Paper · May 2012
CITATION
1
READS
236
3 authors, including:
Some of the authors of this publication are also working on these related projects:
Micronucleus Frequencies and DNA Repair Genes Polymorphisms in High Background Radiation Area InhabitantsView project
Detection Biomarker Gamma H2AX, 53BP1 in High Background Natural Radiation Area ResidentView project Dwi Ramadhani
Badan Tenaga Nuklir Nasional
25PUBLICATIONS 4CITATIONS
SEE PROFILE
Siti Nurhayati
PTKMR-BATAN
15PUBLICATIONS 16CITATIONS
SEE PROFILE
All content following this page was uploaded by Dwi Ramadhani on 29 May 2014.
B2-1
Abstract— Common histopathological changes in the liver due to Plasmodium infection is the presence of haemozoin (malarial pigment) in liver histology section. Identification of haemozoin generally done manually under microscope. Measurement of haemozoin area rarely done because it is quite difficult to separate the haemozoin area from other element in liver histology. Identification and measurement haemozoin area can be done by image analysis using ImageJ. ImageJ is a public domain Java image processing program that enables a plugin development. Plugins are small Java modules for extending the functionality of ImageJ by using a simple standardized interface. Aim of this research is developed ImageJ plugin to measure the haemozoin area in liver histology. Totally 60 random liver histology images were analyzed using our plugin. Algorithm of plugin contain several sequential stages, such as splitting channels, thresholding the image for detection haemozoin area in blue channel and measure haemozoin area. Average haemozoin area from 60 images defined with our plugin was 3884.5 µm2. Our plugin succeeded in detecting and measuring the haemozoin area in liver images at approximately 3.91 seconds.
Keywords.: Haemozoin, ImageJ, Liver Histology Malaria, Plasmodium berghei, Plugin transmitted by blood-feeding Anopheline mosquitoes. The disease is characterized by a range of clinical features from asymptomatic infection to a fatal disease [1,2].
Malarial involvement of liver is now a known entity with specific histopathological changes. The commonly histopathological changes in the liver due to
Plasmodium infection is the present of haemozoin [3]. Haemozoin or malaria pigment has a history in the scientific literature older than the malaria parasite itself, having first been described in the early 18th century by the noted Italian physician Lancisi [4]. Eventually, this pigment played a role in the discovery of the parasite and
the elucidation of its life cycle [1,5]. Hemozoin is a polymer of heme produced by the parasite during hemoglobin breakdown inside the host red blood cells (RBC). Red blood cells lysis during infection results in release of merozoites with this pigment, which are phagocytized by circulating monocytes, neutrophils and resident macrophages [6,7]. The amount of haemozoin in tissues increases throughout infection, so the greater amount of pigment, greater degree of chronicity of lesion [1].
Liver histology is congested with a brown or black pigmentation as a result of accumulation of haemozoin [3]. Haemozoin identification in liver histology commonly does manually under the microscope. Measurement of haemozoin in liver histology can be done by measuring the brown area. Measurement of haemozoin can be done by image analysis using ImageJ. ImageJ is a public domain Java image processing program inspired by NIH Image for the Macintosh. It runs on any computer with a Java 1.1 or later virtual machine, either as an online applet or as a downloadable application. ImageJ has a large number of native functions supplemented by an ever increasing number of “plugins” (optional extras needing installation). A plugin is a file (named *.class) which needs to be in the “plugins” sub-folder of the ImageJ folder, otherwise ImageJ will not load it [8].
Aim of this research is to build plugin for ImageJ that can be use for measure the haemozoin area in liver histology of laboratory mice that already infected with
Plasmodium berghei. The advantages of using
laboratory mice as a model for malaria include a well studied immune system of the host, the opportunity to assess pathologic changes at all stages of the disease, and the availability of genetic variants [1].
II. MATERIALS AND METHODS 2.1. Mice
Male Swiss mice age 8 to 12 weeks was purchased from Pusat Penelitian dan Pengembangan Gizi dan Makanan, Kementerian Kesehatan Indonesia.
2.2. Parasites and infections
Mice were inoculated intraperitoneally with 106
Automated Measurement of Haemozoin
(Malarial Pigment) Area in Liver Histology
Using Image J 1.6
Dwi Ramadhani
1, Tur Rahardjo
1,
and Siti Nurhayati
11
Center for Technology of Radiation Safety and Metrology,
National Nuclear Energy Agency of Indonesia
B2-2 erythrocytes infected by P. berghei. Mice were subjected to euthanasia at one week after inoculation. Fragments of the liver were fixed by immersion in 10% buffered formalin during 24 hours. These samples were then dehydrated, and processed for paraffin embedding. Five µm sections were cut and stained with hematoxylin-eosin (H&E).
2.3. Image acquisition
A Nikon Biophot microscope attached with Nikon D3000 digital single lens reflects (DSLR) camera system was used to capture images of the smears. The slides ImageJ 1.60. The algorithm of plugin can be divided into the following four sequential stages (Fig 1): (1) Splitting channels, (2) Detecting haemozoin area in blue channel, (3) Measuring haemozoin area, (4) Showing outlining haemozoin area in images, (5) Detecting total tissue area in green channel, and (6) Measuring tissue area.
2.4.1. Splitting channels
The purpose of this method is the separation of the red, green and blue channels of the RGB image. Haemozoin area is easy to identify in blue channel compared to red and green channels. In blue channel, the haemozoin area color is dark and the other component is light. Splitting channel also used for converting the RGB image to monochrome image for thresholding process. After splitting the channel we look at each channel individually to determine which one of the channel creates better contrast than another. The channel containing the highest contrast is the best one to choose for use for thresholding later on [9].
2.4.2. Detecting haemozoin area in blue channel This method is performed by thresholding the image and making the binary image with ImageJ. Thresholding is quick method to identify areas of an image to include and areas of an image to ignore.With sufficient contrast, objects of interest may then be “detected,” resulting in masking binary image components, where each pixel is either “on” or “off” [9].
Thresholding an image is a special type of quantization that separates the pixel values in two classes, depending upon a given threshold value ath. The threshold function
ƒthreshold (a) maps all pixels to one of two fixed intensity After thresholding process we selected the black area in binary image as a region of interest (ROI) using CreateSelection command so the black area can be measure using Measure command
2.4.3. Measuring haemozoin area
To measure the haemozoin area, we used the Measure command in ImageJ Analyze menu. Measure command will calculates and displays area statistics, line lengths and angles, or point coordinates the ROI. ROI defined as a black area in binary image (Fig 2).
2.4.4. Showing outlining haemozoin area in images To show the outlining haemozoin area in original image, we used Add Image function in ImageJ Overlay menu.
2.4.5. Detecting total tissue area in green channel This method is performed by detecting the total tissue area by threshold the image and making the binary image with ImageJ. Different with the haemozoin area, total tissue area is strongly easy to determine in green channel. We used 180 as a threshold value (ath), because with this
value total tissue area can be convert to black area in a binary image. After that we selected the total black area using CreateSelection command.
2.4.6. Measuring total tissue area
The purpose of this method is measuring the total tissue area using Measure function in Analyze menu in ImageJ. Detail script and flowchart of the plugin is show in Fig 1 and 2.
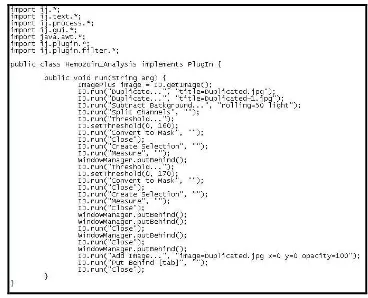
Fig 1. Script Haemozoin Analysis Plugin
III. RESULTS
B2-3 IV. DISCUSSION
In this plugin we choose to use splitting channels than ColorDeconvolution plugin. We used splitting channels because ColorDeconvolution plugin failing to produce an image that haemozoin area easy to identify. Color Deconvolution plugin commonly use for stain separation in histological images. This plugin assumes images generated by color subtraction (i.e. light-absorbing dyes such as those used in bright field histology or ink on printed paper). Our experiment showed that in the blue channel after we apply splitting channels process, a haemozoin is easy to identify because only the haemozoin area are coloring in dark and the other component showed in light color.
Fig 2. Flowchart of haemozoin area plugin
Fig 3. Chart of haemozoin area in 60 images
Images that comprise light objects on dark background or dark object on a light background can be segmented by threshold operation. Based on that we segmented and detected the haemozoin area in blue channel by thresholding the image using ImageJ. ImageJ automatically make binary image and then convert to mask after we apply thershold technique. The results is image that divides into objects in black color and background in white color.
To get measurement area result in µm not in pixel first the scale of the image must be set using Set Scale command in Analyze menu. A known distance should be measured by fitting a line to the known distance using the straight line selection tool in the ImageJ toolbar. Then open the Set Scale command, which will automatically register the distance from the straight line selection. Enter the Known Distance and the Unit of Length and after selecting Global and then OK, the scale will automatically be calculated from the registered distance [11]. A known distances we defined by capture a micrometer slide in under 40× objective lens. With the micrometer image then we define a scale using Set Scale command.
We also apply backround subtraction using rolling ball algorithm before we splitting channels to do background illumination correction in the images. Background correction can be applied while acquiring images (a priori) or after acquisition (a posteriori). The difference between these is that a priori correction uses additional images obtained at the time of image capture while in a posterioricorrection, the additional images are not available and therefore an ideal illumination model has to assumed. Substract background using rolling ball algorithm is one of the a posterioricorrection methods. Substract background function is removes smooth continuous backgrounds from images. Based on the a “rolling ball” algorithm described in Stanley Sternberg's article, “Biomedical Image Processing”, IEEE Computer, January 1983.
Overall our plugin success measured the haemozoin area in liver histology images, and the time need for analyze one images is approximately 3.91 seconds. Other research that conductes by Silva et al [1] also measured haemozoin area in liver histology images using ImageJ, unfortunatelly the details process is not explained so we can not compared with our methods.
V. CONCLUSION
We have developed ImageJ plugin that can be used measured the haemozoin area in liver histology images of mice infected with Plasmodium berghei. Time need for analyze one images is approximately 3. 91 seconds using our plugin. Overall, our plugin worked very well to measured the haemozoin area in liver histology images.
REFERENCES
[1] Silva, A.P.C., Rodrigues, S.C.O., Merlo, F.A., Paixão, T.A., and Santos, R.L. Acute and chronic histopathologic changes in wild Original Image
Substract Background, Rolling Ball Radius : 50 pixels
B2-4 [2] type or TLR-2-/-, TLR-4-/-, TLR-6-/-, TLR-9-/-, CD14-/-, and
MyD-88-/- mice experimentally infected with Plasmodium chabaudi. Braz J Vet Pathol, 2011, 4(1), 5-12.
[3] WMR UNICEF, World Malaria Report. Technical Report, WMR and UNICEF, 2005
[4] Baheti, R., Laddha, P., and Gehlot, R.S. Liver Involvement in Falciparum Malaria – A Histo-pathological Analysis. JIACM CM, 2003; 4(1): 34-8
[5] ADACHI, K., TSUTSUI, H., KASHIWAMURA, S., SEKI, E., NAKANO, H., TAKEUCHI, O., TAKEDA, K., OKUMURA, K., VAN KAER, L., OKAMURA, H., AKIRA, S., NAKANISHI, K. Plasmodium berghei infection in mice induces liver injury by an IL-12 and Toll-like receptor/myeloid differentiation factor 88-dependent mechanism. J. Immunol. Res., 2001, 167,5928–34.
[6] ANDRADE JR HF., CORBETT CEP., LAURENTI MD., DUARTE MIS. Comparative and sequential histophatology of Plasmodium chabaudi – infected BALB/C mice. Braz. J. Med. Biol. Res, 1991, 24: 1209–18.
[7] EGAN, T.J. Haemozoin (malaria pigment): a unique crystalline drug target. Targets, 2003, 2(3).
[8] SULLIVAN, A.D., and MESHNICK, S.R., Haemozoin: Identification and Quantification. Parasitology Today, 1996, 12(4).
[9] Collins, T.J., ImageJ for microscopy. BioTechniques, 2007, 43:S25-S30.
[10] SYSKO, L.R., and DAVIS, M.A., From Image to Data Using Common Image-Processing Techniques. Current Protocols in Cytometry, 2010, 12.21.1-12.21.17.
[11] BURGER, W., and BURGE, M.J., Digital Image Processing An Algorithmic Introduction using Java (1st Edition). 2008: XX+565.
[12] Papadopulos, F., Spinelli, M., Valente, S., Foroni, L., Orrico, C., and Alviano, F., Common Tasks in Microscopic and Ultrastructural Image Analysis Using ImageJ. Ultrastructural Pathology, 2007, 31:401–407.