ANALYSIS OF HUMAN ACTIVITIES IN NATURE RESERVES BASED ON NIGHTTIME
LIGHT REMOTE SENSING AND MICROBLOGGING DATA –ILLUSTRATED BY THE
CASE OF NATIONAL NATURE RESERVES IN JIANGXI PROVINCE
Feng Shi a, Xi Li b, Huimin Xuc, *
a
School of Remote Sensing and Information Engineering, Wuhan University, [email protected] b
State Key Laboratory of Information Engineering in Surveying ,Wuhan University, [email protected] c
School of Economics, Wuhan Donghu University, [email protected]
Commission VI, WG VI/4
KEY WORDS: Nighttime Light Remote Sensing, Microblogging Data, Nature Reserves, Human Activities, Jiangxi Province
ABSTRACT:
The study used the mainstream social media in china - Sina microblogging data combined with nighttime light remote sensing and various geographical data to reveal the pattern of human activities and light pollution of the Jiangxi Provincial National Nature Reserves. Firstly, we performed statistical analysis based on both functional areas and km-grid from the perspective of space and time, and selected the key areas for in-depth study. Secondly, the relationship between microblogging data and nighttime light remote sensing, population, GDP, road coverage, road distance and road type in nature reserves was analyzed by Spearman correlation coefficient method, so the distribution pattern and influencing factors of the microblogging data were explored. Thirdly, a region where the luminance value was greater than 0.2 was defined as a light region. We evaluated the management status by analyzing the distribution of microblogging data in both light area and non-light area. Final results showed that in all nature reserves, the top three were the Lushan Nature Reserve, the Jinggangshan Nature Reserve, the Taohongling National Nature Reserve of Sikas both on the total number and density of microblogging ; microblogging had a significant correlation with nighttime light remote sensing , the GDP, population, road and other factors; the distribution of microblogging near roads in protected area followed power laws; luminous radiance of Lushan Nature Reserve was the highest, with 43 percent of region was light at night; analysis combining nighttime light remote sensing with microblogging data reflected the status of management of nature reserves.
1. INTRODUCTION
In accordance with the relevant provisions of the Regulations of the People's Republic of China on Nature Reserves, nature reserves can be divided into core areas, buffer zones and experimental areas. The types of human activities prohibited in nature reserves and the areas to be developed have clearly restricted on laws and regulations, However, with the development of economy and society, the contradiction between nature reserves and economic development, human activities including all kinds of development and construction projects of nature reserves, agricultural production, resource
traditional economic statistics often have difficulties accurately describing the pressure of the tourism industry on the ecosystem since natural reserves are incompatible with administrative areas or other objective reasons.
More researches are based on the use of remote sensing data or GIS combined, with which to classify the objects and then calculate the human activities. For example, Zhang Hongyun et al. selected a variety of factors to construct a human activity impact index model based on the High Resolution CMB Resources Satellite Imaging in 2012 and Chinese Environment Series Satellite images (Zhang, 2015); SUN Ya-hui et al. studied the spatial distribution of three kinds of human activities in the western, central and eastern parts of the Daqingshan Nature Reserve in Inner Mongolia Autonomous Region, and its contribution to the landscape pattern based on forest resource inventory data and open-field investigating data, GIS spatial analysis technique and landscape index method(Sun et al., 2014). Guo Luo and the others analyzed the relationship between human activities and landscape fragmentation of protected areas, and analyzed the impact of human activities on Taishan Nature Reserve in combination with remote sensing images (Guo et al., 2005). XU Wang-gu and others used geographic information system and remote sensing technology to extract the land-use area of human activities in 407 national nature reserves in 2010, and got the total land area of human activities plots, the area of agricultural production land and the area of land for construction of villages and towns (Xu, 2015). Yet quantitative analysis of human activities’ impact on natural reserves from the perspective of social media, combined with
the remote sensing data in our countryhas not been reported.
According to the 2016 Sina microblogging first quarter earnings report, as of the end of the first quarter, microblogging monthly active users reached 261 million, daily active users reached 120 million, and microblogging become one of the main activities of Internet users in China. As one of the social media data, microblogging can be more accurately and effectively extract information such as population distribution that is difficult to get with other methods, and provides a lot of information in combination with nighttime light remote sensing that can reflect the presence of man-made buildings, human activities in the nature reserves. For example, Noam Levin et al. defined an indicator of the percentage of luminous and the percentage of
Flickr activities in each nature reserve, and thus determined the combined effects of light and human (Levin et al.,2015 ).
S
Table 1. National nature reserves in Jiangxi Province
However, it is not practical to use Flickr data to study the nature reserves in China, and the global scope of its research is not specific to China's specific national conditions and policies, thus unable to evaluate nature reserves objectively and accurately in China. Therefore, only use China's popular social media data combined with China's objective reality, can we get a more scientific and suitable evaluation result for the nature reserves.
2.1 Research Area
Jiangxi Province, referred to as Gan, is located in the south bank of the junction of middle and lower reaches of the Yangtze River. Its longitude between 113 degrees and 118 degrees, and latitude between 24 degrees and 30 degrees. From yearbook of 2015 we know that there are 235 nature reserves in Jiangxi Province, including 14 national nature reserves, with a total area of 1188.41 hectares. Wuyuan Forest Birds Reserve is added to the list of national nature reserves in 2016.
2.2 Data Source
We got nighttime light remote sensing data from NOAA (National Oceanic and Atmospheric Administration). The NOAA website provides two kinds of data-DMSP/ OLS and S-NPP / VIIRS, and no longer provides DMSP / OLS nighttime light remote sensing products after 2013.
Compared to DMSP / OLS data, the NPP-VIIRS data don’t filter the fire, volcanoes or aurora, and the background noise are not removed, but the image resolution reaches 15 "(about 450 m) and the image clarity is greatly improved (Li et al., 2016). We can download part of the monthly average free images from the website, all the average daily images (Li et al., 2015).
We got 6596 Sina microblogging data that came from the different groups in Jiangxi Province National Nature Reserve in 2016 through the public application program interface. The data included multiple fields but we mainly focused on three aspects: time, date and location. Road and other vector data can be obtained from the OpenStreetMap website. OpenStreetMap as an open source map, its data are completely open and update faster. The data obtained were fine to every path in the nature reserve, which meets the requirements of the study. Population and GDP distribution dataset based on kilometer grid came from the Global Change Research Data Publishing &Repository. Other types of ancillary data were got from the relevant sites or research institutions.
3. METHODS
3.1 Statistical Analysis
We counted statistical indicators such as total, average, maximum, minimum and variance of microblogging data and nighttime light remote sensing data, reflecting the true brightness of the ground after data processing, in the core area, the buffer zone and the experimental area as well as field based on 1km * 1km cell grid from the perspective of time and space. We also sorted these national natural reserves in descending order and select the key areas for in-depth study. For the nature reserves with high microblogging density, we used GIS analysis methods to study the law of microblogging quantity that changed with the month.
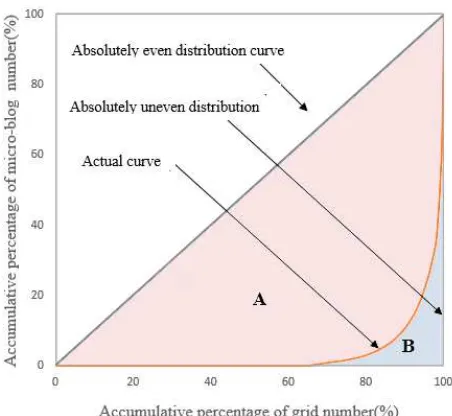
In order to evaluate the degree of aggregation of data, we introduced the idea of Gini coefficient and used curve fitting method to estimate it (Nin et al., 2010). Specific steps were as follows:
Firstly, the number of microblogging or luminous brightness values in the grid of each nature reserve were counted and sorted in ascending order, and then cumulative percentage were calculated.
Secondly, we calculated cumulative percentage of grid number.
Thirdly, we plotted with cumulative percentage of grid number as X axis and cumulative percentage of microblogging number or luminous brightness values as Y axis respectively and fitted the curve, and then we could calculate definite integrals with the help of software.
As is shown in figure1, we regarded P as the index of aggregation.
P = 2�+�� (1)
where P= degree of aggregation
A=result of subtracting integral of actual curve from integral of absolutely even distribution curve
Figure 1. The degree of aggregation 3.2 Correlation and Regression Analysis
The relationship between microblogging and nighttime light remote sensing, population, GDP, road coverage, road distance and road type etc.in nature reserves were analyzed by Spearman correlation coefficient method considering the microblogging data didn’t conformed to the normal distribution, so the distribution pattern and influencing factors of microblogging data were explored. In order to explore the relationship between the number of microblogging and their distance from the road, we divided the distance into appropriate number groups and each group of 100 meters. Using the linear regression model and the least squares method (in log coordinates), we could found the power-law relationship between them.
3.3 Analysis Combined with Microblogging and Luminous
Remote Sensing
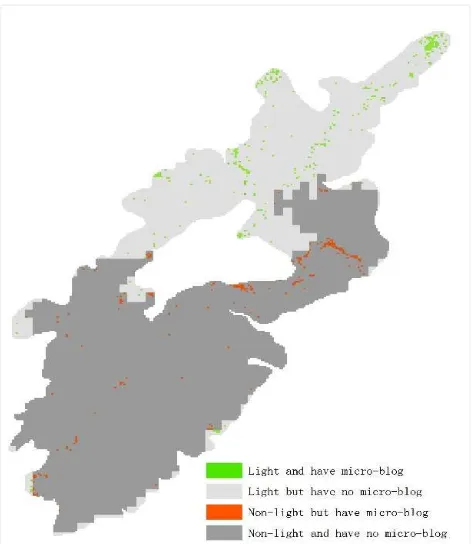
The high-resolution remote sensing images could be used to identify the artificial buildings and main structures in the nature reserves and find the potential areas of the existence of light pollution. After overlaying the base map and the nightlight remote sensing, it was possible to discover the actual existence of light pollution of the nature reserve and its distribution range.
According to experience and understanding of light pollution, a region where the true radiation luminance value greater than
0.2 × 10⁻⁹ (W / cm2 * sr) was defined as the light, otherwise
the non-light. The distribution of microblogging data in the two regions were analyzed and the common effects of light and human activities on nature reserves were discussed.
4. RESULTS
4.1 Temporal and Spatial Distribution of Microblogging
Data
After the statistics for microblogging data of all national nature reserves (Wuyuan Forest Bird National Nature Reserve excepted) in Jiangxi Province, we found that from the total amount of microblogging, buffer zone was the most, followed by the core area and experimental area, but when we considered the area of nature reserve, the result changed – most of the experimental area had a greater microblogging density, followed by the buffer zone and the core area. Final result shows that in all nature reserves, the top three were
Figure 2. Microblogging density of nature reserves
Figure 3 Mean nighttime light radiance of nature
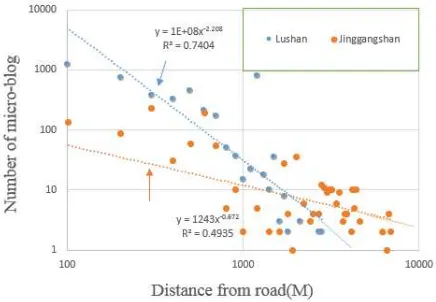
Figure 4 Microblogging number varied with distance from the road in Lushan Natural Reserve
Figure 5 Microblogging number varied with time the Lushan Nature Reserve (average of 12.8 microblogging data per square kilometer, the maximum value was 924), the JinggangShan Nature Reserve (average of 3.7 microblogging data per square kilometer, the maximum value was 247), the Taohongling National Nature Reserve of Sikas (average 1.25 microblogging per square kilometer, the maximum value was 156) both on the total number and density of microblogging.
In Lushan Nature Reserve,microblogging mainly distributed
in the Sandie Waterfalls, Lushan North Gate Interchange and Donglin Temple etc. As for time of microblogging peak, Jinggangshan and Lushan appeared in August while Taohongling National Nature Reserve of Sikas was January and Poyang Lake was November, which may be related to "the best travel time". For example, November was the best time for bird watching in Poyang Lake.
4.2 Relationship between Microblogging and Other
Factors
The results of aggregation calculation showed that the distribution of microblogging data in the nature reserves was surprisingly uneven. Microblogging number didn’t meet the
normal distribution. Take Lushan for an example, its skewness was 10.105, showing a positive skew, and kurtosis was 113.969 that means a very steep curve. These uneven-distribution microblogging mostly appeared within a certain distance (average 500 meters) from the road (far away from the road may indicate the behavior of visitors playing to their own path). Microblogging and distance from road showed power-law relationship, that is, the amount of microblogging decreased drastically as the distance increased. For all state-level nature reserves in Jiangxi Province, 80 percent of microblogging distributed within 1000 meters far away from road and the distribution feature could be
described by the function Y=891.5X-0.559
,
of that Lushan wasY=e8X-2.208 (R2=0.7404) and Jinggangshan was
Y=1243X-0.572 (R2=0.4935). Y represented the microblogging
number and X was the upper bound of the distance from the
road (100 meters for the interval). It was worth noting that the
microblogging peak was not on the road, but in the distance of about 80 meters.
The amount of microblogging in nature reserves was related to many factors, among which the number of visitors was one. Besides, it had a significant correlation with road coverage (the sum of road lengths per unit area) and road type, mainly being the main road, pedestrian road and three roads. It seems that the number of microblogging and GDP had no relationship on the basis of km-grid, but from the perspective of functional areas, they showed a significant correlation.
Figure 6. The number of microblogging within a certain distance from the road and the power-law relationship
M
Table 2. Correlation coefficient of different factors.
Significance of correlation coefficients is shown as** P < 0.01
4.3 Analysis Combined with Microblogging and Luminous
Remote Sensing
Figure 7 Distribution of microblogging around road with different type.
Nighttime light, to some extent, represented the human activities. However, not as clustered as microblogging distribution, their aggregation were mostly around 0.5 (Lushan 0.5609, Poyang Lake southern Rocky Wetland Nature Reserve 0.4198, Poyang Lake 0.3098, Taohongling National Nature Reserve of Sikas 0.4908).Statistical results showed that the luminous radiance of Lushan was the highest, with 43 percent of region was light at night, followed by Poyang Lake Nature Reserve, Poyang Lake southern Rocky Wetland Nature Reserve, Taohongling National Nature Reserve of Sikas with a little nighttime light. AS for Lushan, 42.5 percent of microblogging appeared in the light-areas. Theoretically, microblogging, representing human activity, should appear in the light areas, and if not, it was likely to indicate that there was a policy of night-control in the area, but the strong light from the city nearby would affect the judge.
Nighttime light remote sensing had a significant correlation with microblogging, which was not only reflected in the average luminous radiance but also in the range, and the latter was even more significant when based on km-grid. We speculated that the impact of urban lighting made the natural protection area appear overall brighter, leading to the average couldn’t be a good response to human activities. The strong correlation between the nighttime light remote sensing and the microblogging indicated that the places with frequent human activities were usually equipped with more lighting equipment (such as street lamps, etc.), which also showed that most visitors followed the procedures, in line with management practices.
5. DISCUSSION
Nighttime light remote sensing is highly related to human activities, and with the advantages of space-time continuity, independence and objectivity it can intuitively and clearly reflect the information of human activities (Li et al., 2015). Microblogging data can independently represent the distribution of each user and obtain the individual trajectory in chronological order. It is a powerful data to study the characteristics of human spatial behavior in the nature reserves with the advantages of large volume, large spatiotemporal span and abundant information. Study combining the two can effectively analyze the human activities in the nature reserves, reflect the ecological tourism
and management policies that are difficult to get through other methods, thus making up for the lack of conventional methods.Definitely, microblogging users tend to younger and highly-educated, which gives our research some limitations. Besides, the position of mobile phone can’t be accurately determined, leading to error results. As a new idea, we believe that this will be solved in the future development and analysis means will be more comprehensive and objective.
ACKNOWLEDGEMENT
This research was supported by Key Laboratory of Spatial Data Mining & Information Sharing of Ministry of Education, Fuzhou University: [Grant Number 2016LSDMIS03], the Fundamental Research Funds for the Central Universities: [Grant Number 2042016kf0162], Natural Science Foundation of Hubei Province: [Grant Number 2014CFB726].
REFERENCES
GUO Luo, YU Shi-Xiao, XIA Bei-Cheng, J., 2015. Effect of human activities on spatial-temporal changes of landscape diversity in the Mountain Tai. Ecologic Science, 24(1), pp. 202-206.
Levin N, Kark S, Crandall D, J., 2015. Where have all the people gone? Enhancing global conservation using night lights and social media. Ecological Applications, 25(8), pp. 2153.
LI Deren, LI Xi, J., 2015. An Overview on Data Mining of Nighttime Light Remote Sensing. Acta Geodaetica Et Cartographica Sinica, 44(6), pp. 591-601.
Li F, Mi X N, Liu J, et al, J., 2016. Spatialization of GDP in Beijing using NPP-VIIRS data. Remote Sensing for Land & Resources, 28(3), pp. 19-24.
NIU Xiao Qi, YUAN Xin Sheng, J., 2010. Two methods of gini coefficient estimation. Journal of Henan University of Science & Technology (Natural Science), 31(6), pp. 95-99.
SUN Ya-hui, MENG Li, TIAN Lü, LI Guo-liang, LI Yue-hui, SUN,Jian-xin, J., 2014. Spatial distribution of human activities and their influences on landscape patterns in
Ecology. 25(11), pp. 3247-3254.
XU Wang-gu , QIN Wei-hua , LIU Xiao-man, XIA Xin, ZHOU Da-qing, FAN Lu-ning , JIANG Ming-kang, J., 2015. Status Quo of Distribution of Human Activities in the National Nature Reserves. Journal of Ecology & Rural Environment, 31(6), pp. 802-807.