AN OPEN SCIENCE APPROACH TO GIS-BASED PALEOENVIRONMENT DATA
C. Willmes∗, D. Becker, J. Verheul, Y. Yener, M. Zickel, A. Bolten, O. Bubenzer, G. Bareth
Institute of Geography, University of Cologne, Albertus-Magnus-Platz, 50923 Cologne, Germany (c.willmes, daniel.becker, jverheul, yyener, m.zickel, andreas.bolten, olaf.bubenzer, g.bareth)@uni-koeln.de
Commission II, ThS14 - Recent Developments in Open Data
KEY WORDS:Paleoenvironment, GIS, SDI, Spatio-Temporal, Data integration, Data management, FOSS4G, Open Science, Open Access, Open Data.
ABSTRACT:
Paleoenvironmental studies and according information (data) are abundantly published and available in the scientific record. However, GIS-based paleoenvironmental information and datasets are comparably rare. Here, we present an Open Science approach for creating GIS-based data and maps of paleoenvironments, and Open Access publishing them in a web based Spatial Data Infrastructure (SDI), for access by the archaeology and paleoenvironment communities. We introduce an approach to gather and create GIS datasets from published non-GIS based facts and information (data), such as analogous maps, textual information or figures in scientific publications. These collected and created geo-datasets and maps are then published, including a Digital Object Identifier (DOI) to facilitate scholarly reuse and citation of the data, in a web based Open Access Research Data Management Infrastructure. The geo-datasets are additionally published in an Open Geospatial Consortium (OGC) standards compliant SDI, and available for GIS integration via OGC Open Web Services (OWS).
1. INTRODUCTION
The presented project is developed in the frame of the interdisci-plinary and inter-institutional Collaborative Research Centre 8061 (CRC 806). Scientists from the Universities of Cologne, Bonn and Aachen are researching Culture-Environment interaction in the late Quaternary to answer questions about the complex nature of chronology, regional structure, climatic, environmental and socio-cultural contexts of major intercontinental and transconti-nental events of dispersal of anatomically modern humans (AMH) from Africa to Western Eurasia, and particularly to Europe (Richter et al., 2012).
Within the Data Management and Data Services (Z2) sub-project of the CRC 806, the here presented approach is applied for pro-viding GIS-based geo-data and maps, according to the given re-search questions, to the collaborating projects, and also via online publication to the wider research community.
It is obvious, that the core of almost all research questions within this research setting is of spatio-temporal nature. Thus, maps of certain spatial regions displaying published scholarly knowledge of environments in different times are valuable information, that help to answer and solve some of the questions present in the project.
Until now, the availability of paleoenvironmental information from reconstructions, simulations, or qualitative synthesis depicted on a map are most often not available in GIS data formats. These informations are mostly published in written text, tables, maps and figures of scientific publications. A quite notable amount of paleoenvironmental information is available in literature and also in analogue map publications.
The main aim of our project is to make these existing informa-tions available in GIS-based geo-data formats, and publish these geo-data for further use by archaeologists and paleoenvironment researchers.
Thus, the resulting maps and GIS data sets of the here presented
∗Corresponding author: [email protected] 1
http://www.sfb806.de
approach are finally published in the Spatial Data Infrastructure (SDI) of the CRC806-Database2(Willmes et al., 2014), which is the web based Research Data Management (RDM) platform of the CRC 806. The CRC806-Database platform is implemented using Open Source software, and implements Open Science, Open Access and Open Data principles. The data published via the platform is by default assigned an open Creative Commons li-cense (Friesike, 2014), to implement Open Data, additionally the data is openly accessible, and by minting DOI’s for datasets, the resources are also citeable to implement Open Science (Sitek and Bertelmann, 2014).
In the following, the tasks to acquire and produce the GIS data, the map production, and the Open Access publication of the dataset, are exercised by describing the process of producing a Last Glacial Maximum (LGM) paleoenvironment GIS dataset and a map, that is published via the CRC806-Database.
2. METHODS AND DATA ACQUISITION
The approach for collecting data mainly consists of digitalization of maps (scanning, georeferencing and digitizing), or GIS mod-eling from textual information, of published paleoenvironmental information, which are not yet available in GIS formats. Thus, the main focus of this paper is on the acquisition of qualitative and analogue paleoenvironmental information, and on producing GIS datasets representing these information. These gathered and created datasets are then combined with existing GIS datasets, in order to produce comprehensive paleoenvironment geo-dataset and maps. In the following of this section, some of these hetero-geneous data sources are introduced.
2.1 Non-GIS data sources
A vast amount of information (data) in form of textual informa-tion or (non-GIS) maps exist in form of published records. To
2
make this data available in GIS formats is one of the main foci of this work.
2.1.1 Published maps A lot of paleoenvironmental informa-tion is published in the form of maps, for example in large format printed educational maps, see fig. 1, or as a figure in a research publication, in an atlas or other publications. If the map is avail-able only in analogous form, i.e. as print, at first, the map has to be scanned. For this purpose large format scanners are avail-able within the project. The next step is the digitalization of the map. If the map is from a publication, that is available in digital format, for example as a PDF, the map figures can be extracted and formatted to a Bitmap (PNG, JPG or Tiff). In some cases the resolution is scaled before the next step, to increase the quality of the map. Afterwards, the Bitmap is georeferenced using desktop GIS georeferencing functionalities. To be able to georeference a map successfully, it is important to identify spatial features in the paleo map, that are also existent on other GIS datasets (basemap). This can be sometimes a problem, if the map has no coordinates given at the map border or in form of a coordinate grid. Figure 1
Figure 1: An example scan of a DIN A1”Palaeohydrography and Geology of the Murzuq Basin”map, published as supple-mental map of (Pachur and Altmann, 2007).
shows an example of an analogue map containing paleoenviron-mental information. In this case it is a map of ”Palaeohydrog-raphy and Geology of the Murzuq Basin”published in a Book (Pachur and Altmann, 2007), as a large (DIN A1) appended fold-able map. The underlying digital data is not published, this way of digitization, by first scanning the map in a large format (A0) scanner, then georeferencing and importing into a GIS as a tem-plate for digitizing, is the method to make the spatial features available in GIS format. Useful are also paleohydrographic in-formation, such as the geometries of paleo-rivers and lakes. This kind of information is mostly only published within the literature. It is taken care of attributing and citing the original publications and sources from which the GIS data was digitized or gathered from, see sec. 4. for more details about how the original sources are attributed.
2.1.2 Alphanumerical information The case of textual or al-phanumeric information, as part of a scientific publication, as a source of paleoenvironment informations is more complicated. For example, if the information is available as a description of
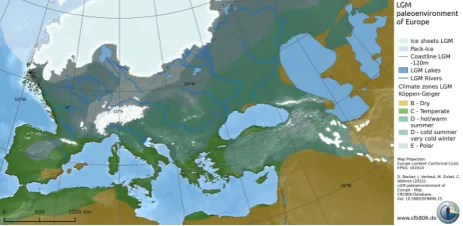
a glaciation extent (described as a line between place A and B) published without an according map, or the textual description of paleo lake levels, or coastlines according to a sea level. In these cases the geometries are digitized freely using the vector geometry editing capabilities of a GIS, or computed from topog-raphy / Bathymetry datasets according to sea level or lake level. This kind of data source is taken, if there are no maps or other datasets available with this information. Though, this alphanu-meric information of a definite sea level can result in very acurate GIS information, by computing the according water body from a DEM of Bathymetry dataset. In many cases the information that are the basis for this production process, are actually a combina-tion of non-GIS data in publicacombina-tions, definite numbers that can be used to derive an accurate GIS datasets, and free text descriptions of environmental features, where the geometries are then kind of drawn using GIS software package to produce an according GIS dataset. An example for the altter one, would be the assumed lake south of the skandinavian ice shield, shown in the map of figure 2.
2.2 Available GIS data
There are also data sources available in GIS formats, that can be directly used for the production of paleoenvironmental maps. Some of them are introduced in the following of this section.
2.2.1 Topography The main ingredient of every base map is the topography. This information is typically provided in form of DEMs and Bathymetry data. For time-slices since the last glacial maximum (LGM, 21k yBP), we can assume that DEMs with resolutions>1 arc second are tolerable and sufficient for the creation of meso scale maps, because in most regions, geomor-phic changes since the LGM are minor on this scale. This would of course not work for local scale maps, where anthropological as well as geomorphological changes would be visible, but can not be represented by the available recent data. Using combined DEM and Bathymetry data sets, like the GEBCO dataset (General Bathymetric Chart of the Oceans, 2014), allows to draw paleo coastlines dependent on the assumed sea level of a given time-slice. In the late Quaternary, the sea level varied over a range of more than 150m, and therefore considerable changes in coastal environments occurred, see figure 2 for example.
Figure 2: A map of the LGM paleoenvironment, including glacia-tion, climate classifications, inland waters and sea level adapted coastlines (Becker et al., 2015).
K¨oppen-Geiger classification can be computed (Willmes et al., 2016), to provide GIS based paleoclimate zonal data.
WorldClim (Hijmans et al., 2005), is a further well known source for paleoclimate data in GIS format. Data for mid-Holocene (6k yBP), LGM (21k yBP) and last interglacial (LIG, 125k yBP), as temperature and precipitation variables, as well as BIOCLIM (Busby, 1991) classified continuous data, can be downloaded from the project’s website3.
The BIOME datasets provided by (Edwards et al., 2000), rep-resent paleoenvironmental Biomes, that are derived from actual observations, such as drill core and sediment analyses.
There are more datasets like these published, but in many cases not openly accessible. It is also a goal of this project to help im-prove this situation.
2.2.3 Glaciation extends and inland waters (Ehlers et al., 2011) published an extensive volume about Quaternary glacia-tions and inland waters, containing a world wide map of Quater-nary, and prevalent LGM, glaciation extends, and further larger scale (smaller region) datasets containing glaciation extends and according inland water data like paleolakes and paleoriver ge-ometries of different Quaternary periods.
Data bases like the NOAA-World Data Center for Paleoclima-tology4 contain further datasets representing glaciation extends, paleo hydrology and in particular paleo lakes.
3. GIS AND MAPS PRODUCTION
The data management process to handle the information about the heterogeneous data sources, the overall GIS production work-flow, and the map production approach are summarized in this section.
3.1 Database and data management
Paleoenvironmental data sources are internally collected, orga-nized, and spatio-temporally indexed in a Semantic MediaWiki (SMW) (Kr¨otzsch et al., 2006) based database. A data integra-tion concept (Willmes and Bareth, 2012) was developed to in-tegrate published archaeological and metadata of paleoenviron-mental GIS data sets in one consistent data base, based on the Mediawiki User Interface (UI) for collaborative editing of con-tent. This SMW based application allows the querying and filter-ing of all available data sources, and its visualization, for example as graphs, tables or as web maps (simple indication of locations only). Finally, its export into many data formats is possible from one consistent interface. The application allows to filter accord-ing to defined and custom time slices, as well as spatially by a defined region, coordinate bounding box, or via map extent. The GIS datasets are published in the CRC806-Database SDI (see section 4.) but its metadata and according links are also stored in the SMW based application, to help organize available data for the map and dataset production process.
3.2 Geo-data production
As introduced in section 2., the source data is acquired from het-erogeneous data sources. This data gathering, integration and processing are the most laborious tasks of the production pro-cess. These tasks are not limited to the time demanding tasks of digitizing analogous maps, or creating geo-data from textual in-formations, it also includes data format conversions, for example from data formats of different domains, like for example NetCDF climate research data or plain coordinates in CSV files. Another
3
http://www.worldclim.org/paleo-climate 4
http://www.ncdc.noaa.gov/paleo/wdc-paleo.html
case are GIS datasets, that are organized along different criteria, than those that are applied for data organization in this project. In these cases features of interest are reorganized, for example from one layer containing geometries of several time-slices into layers representing one time-slice each.
3.3 Maps production
Maps can be produced from GIS datasets that are available in our internal database for a given context. A context can be de-fined as a query on the database. For example a query searching for ”All datasets in Europe for the time interval Aller¨od”, would yield all GIS datasets, that are within the defined BoundingBox of Europe, and that are temporally within the TimePeriod defined for the Aller¨od interval (e.g. between 13.3k and 12.6k yBP). Additionally, the Topography and sea level for the given spatial and temporal context is produced, by deriving coastlines for the sea levels that are known for that context, as well as topogra-phy from datasets like GEBCO 2014 (General Bathymetric Chart of the Oceans, 2014) and SRTM (Jarvis et al., 2008; Farr et al., 2007) for example. By the use if the resulting GIS datasets, an ad-ditional qualitative selection according to the purpose of the map is eventually deducible. Finally, the map is crafted in common desktop GIS software packages like QGIS (QGIS Development Team, 2015) and ArcGIS (esri, 2015).
4. PUBLICATION AND SDI
The produced GIS datasets and maps are finally published in the CRC806-Database (Willmes et al., 2012, 2014), in form of a downloadable data set, including DOI, and via Open Geospatial Consortium (OGC) web services in the Spatial Data Infrastruc-ture (SDI) of the CRC806-Database. In the following of this sec-tion, the publication of an example dataset, the ”LGM paleoenvi-ronment of Europe - Map” (Becker et al., 2015), is described.
4.1 Copyright and Licensing
Data sources, as described in section 2., that are scholarly pub-lished, are properly cited and attributed in the according meta-data documents (see section 4.3). We assume, that by publishing a dataset scholarly, the copyright is in accordance or comparable to a CC-BY or CC-BY-NC license, and thus allowed to re-use if properly cited. On a side note, if the copyright would be differ-ent, i.e. more restrictive in terms of re-use, from this assumption it could be questioned, if principles of good scientific practice are violated by this kind of publication.
GIS datasets that are produced in the course of this project are all explicitly published under CC-BY license. And thus fulfill the Open Data criteria, according to the Open Definition (OKFN, 2016). The CRC806-Database also holds datasets under more restrictive licenses. These datasets are mostly primary research data published by members of the CRC 806 not in the course of this Open Data and Open Science approach sub-project of the CRC 806.
4.2 Dataset DOI publication
Geo-datasets and according maps are published including an Dig-ital Object Identifier (DOI) minted via DOIDB5, the cooperation partner of the CRC 806 for issuing DOI’s. A DOI is a name (not a location) for an entity on digital networks. It provides a system for persistent and actionable identification and interopera-ble exchange of managed information on digital networks (NISO,
5
2010). This allows other researchers, who use the maps in their work to properly cite and reference the data in scholarly publi-cations. Examples of paleoenvironmental GIS datasets, created with the here presented approach, and published in the CRC806-Database are Verheul et al. (2015) and the here further described (Becker et al., 2015) dataset.
The datasets and maps are published with an appended strictly formalized descriptive document (see fig. 3), containing the meta-data and some contextual information, citation of the meta-data sources, as well as advice on the further citation of the dataset.
Figure 3: Example CRC806-Database publication metadata doc-ument of Becker et al. (2015).
The metadata of the example dataset (Becker et al., 2015) are explained in the following sub-sections.
4.2.1 Basic Metadata The basic metadata, that are annotated to every published dataset:
Title LGM paleoenvironment of Europe - Map
Author(s) D. Becker, J. Verheul, M. Zickel, C. Willmes
Year 2015
License CC-BY
Topic Environment
Keywords LGM, Paleoclimate, Paleoenvironment.
Publisher CRC806-Database
DOI 10.5880/SFB806.15
4.2.2 Spatial Metadata The spatial metadata that are anno-tated to every published GIS dataset:
Type BoundingBox
Place European part of the SFB 806 area
BoundingBox (SW, NE)
-31.8 1.3, 53.85 85.95
Region Europe
4.2.3 Temporal Metadata The temporal metadata, that are annotated to every published paleoenvironmental dataset:
Type Interval.
Name Last Glacial Maximum (LGM).
Interval 26500, 19000
4.2.4 Resources For consistency, the resources of the dataset are also listed in the metadata description document.
File resources attached to the dataset:
File Format Size
LGM Europe Map.png PNG image file containing the map
3,8 MB
LGM Europe Map.pdf PDF file containing the map 2 MB
Web resources attached to the dataset:
DOI 10.5880/SFB806.15
WMS http://www.sfb806db.uni-koeln.de/ owsproxy.php?service=wms&version=1. 3.0&request=GetCapabilities
WebGIS http://crc806db.uni-koeln.de/layer/
show/253/
4.3 Citation and attribution of sources
All publications, that are data sources and re-used for the pre-sented new datasets are properly cited in the according dataset description document, as described in section 4.2 and shown in figure 3. For the re-use of the derived dataset it is suggested, to cite the derived dataset, as well as the original sources, to guar-antee proper credit and attribution for the creators of the data sources. Because the CRC806-Database DOI publications are not indexed by any renown publication index databases like Tomp-sons Reuters Web of Knowledge or Google Scholar, the proper citation as practiced in this approach does unfortunately not re-sult in the due credits for the original data creators, in terms of impact measured by these citation indizes.
4.4 SDI open geospatial webservice publication
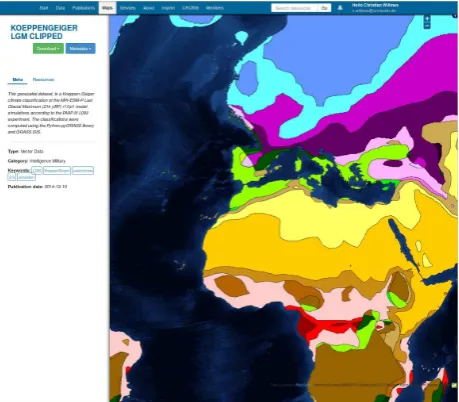
The GIS datasets are also published as OGC Open geospatial Web Service (OWS), to enable the networked integration of the data into client desktop GIS and WebGIS applications. The Spa-tial Data Infrastructure (SDI) consists of a GeoNode (GeoNode Contributors, 2015) based backend, and an OpenLayers (Open-Layers Contributors, 2015) based frontend (see figure 4 for a screenshot of the interactive WebGIS SDI frontend, showing the K¨oppen-Geiger classification (Willmes et al., 2016) of an LGM climate simulation dataset). The publication of OGC conform
Figure 4: Screenshot of the CRC806-Database SDI interactive OpenLayers based WebGIS User Interface.
5. DISCUSSION
Published data, prepared and digitized into GIS formats for reuse, provide valuable contributions for the paleoenvironmental record, and for facilitating further research that is based on this new GIS data sources. Especially, the publication in GIS formats is helpful for data integration in different projects, because the spatial inte-gration is already clear, as well as the data handling requirements. The produced maps can be used, for example, by researchers of the CRC 806 to contextualize archaeological sites and finds in their according paleoenvironments. Another aim is to consoli-date available paleoenvironmental informations and make them accessible for computational research, for example in the context of niche modeling (Becker et al., 2016b) and GIS-based analyses as site catchments analysis (Becker et al., 2016a) for example. This work contributes to the ideas of Open Access, Open Data, and Open Science, by implementing these principles to enhance the ability and possibility of data reuse. In this realm of Open Data publishing, the SDI also has its role, to facilitate data shar-ing and interoperability via OGS OWS. As described in section 4.1, we believe that the re-use of published information is at the core of what science and good scientific practice is about, and thus now copyright issues insist in this presented approach. For the future, the main aim of the project is to produce and deliver data that helps the researchers within the CRC 806 projects, as well as the wider paleoenvironmental community. Furthermore, we are looking into implementing a process for peer-review of these datasets in the future. The idea is to implement Open Sci-ence peer-review, by documentation of all review requests, com-ments and according changes to the dataset. Informally this is already implemented, it is possible for anyone to submit com-ments to the dataset by email to the authors, but a formalization of this process is not yet implemented. The documentation of the review process, including reviewers names will be visible on the datasets website and the according metadata documents. This ap-proach will help to improve the quality and thus credibility of the datasets, which possibly will have positive effects on the reuse of the open data produced by this project.
ACKNOWLEDGEMENTS
The presented research was conducted in the frame of the German Research Foundation (www.dfg.de) funded Collaborative Research Centre 806 (www.sfb806.de).
References
Becker, D., de Andr´es-Herrero, M., Willmes, C., Bareth, G. and Weniger, G.-C., 2016a. Investigating the influence of differ-ent DEMs and environmdiffer-ental data on GIS-based cost distance modelling for a case study of prehistoric sites in Andalusia.
ISPRS International Journal of Geo-Information. (in prep.). Becker, D., Verheul, J., Zickel, M. and Willmes, C., 2015. LGM
paleoenvironment of Europe - Map. CRC806-Database, DOI:
http://dx.doi.org/10.5880/SFB806.15.
Becker, D., Willmes, C., Bareth, G. and Weniger, G.-C., 2016b. A plugin to interface openModeller from QGIS for species’ potential distribution modelling.ISPRS Annals of Photogram-metry, Remote Sensing and Spatial Information Sciences. (in prep.).
Boundless Inc., 2014. OpenGeo Suite plugin for QGIS.http:// qgis.boundlessgeo.com/static/docs/intro.html, ac-cessed: 2015-04-09.
Braconnot, P., Otto-Bliesner, B., Harrison, S., Joussaume, S., Pe-terschmitt, J.-Y., Abe-Ouchi, A., Crucifix, M., Driesschaert, E., Fichefet, T., Hewitt, C. D., Kageyama, M., Kitoh, A.,
Laine, A., Loutre, M.-F., Marti, O., Merkel, U., Ramstein, G., Valdes, P., Weber, S. L., Yu, Y. and Zhao, Y., 2007. Results of PMIP2 coupled simulations of the Mid-Holocene and Last Glacial Maximum - Part 1: experiments and large-scale fea-tures.Climate of the Past3(2), pp. 261–277.
Busby, J., 1991. Bioclim-a bioclimate analysis and prediction system.Plant Protection Quarterly (Australia).
Edwards, M. E., Anderson, P. M., Brubaker, L. B., Ager, T. A., Andreev, A. A., Bigelow, N. H., Cwynar, L. C., Eisner, W. R., Harrison, S. P., Hu, F.-S., Jolly, D., Lozhkin, A. V., MacDon-ald, G. M., Mock, C. J., Ritchie, J. C., Sher, A. V., Spear, R. W., Williams, J. W. and Yu, G., 2000. Pollen-based biomes for Beringia 18,000, 6000 and 0 14C yr BP. Journal of Biogeog-raphy27(3), pp. 521–554.
Ehlers, J., Gibbard, P. L. and Hughes, P. D., 2011. Quaternary Glaciations - Extent and Chronology A Closer Look. Devel-opments in Quaternary Sciences, Vol. 15, Elsevier.
esri, 2015. ArcGIS for Desktop. http://www.esri.com/ software/arcgis/arcgis-for-desktop, accessed: 2015-12-2.
Farr, T. G., Rosen, P. A., Caro, E., Crippen, R., Duren, R., Hens-ley, S., Kobrick, M., Paller, M., Rodriguez, E., Roth, L., Seal, D., Shaffer, S., Shimada, J., Umland, J., Werner, M., Oskin, M., Burbank, D. and Alsdorf, D., 2007. The Shuttle Radar To-pography Mission.Reviews of Geophysics45(2), pp. RG2004. Friesike, S., 2014. Creative commons licences. In: Opening Science – The Evolving Guide on How the Internet is Changing Research, Collaboration and Scholarly Publishing, Springer Open, Heidelberg, pp. 287 – 289.
General Bathymetric Chart of the Oceans, 2014. GEBCO 2014 Grid - Gridded bathymetry data. http://www.gebco. net/data_and_products/gridded_bathymetry_data/, accessed: 2015-10-22.
GeoNode Contributors, 2015. Geonode–open source geospa-tial content management system. http://geonode.org, ac-cessed: 2015-10-23.
GeoServer Contributors, 2015. Geoserver – open source server for sharing geospatial data. http://geoserver.org, ac-cessed: 2015-10-23.
Hijmans, R., Cameron, S., Parra, J., Jones, P. and Jarvis, A., 2005. Very high resolution interpolated climate surfaces for global land areas.International Journal of Climatology25, pp. 1965– 1978.
Jarvis, A., H.I. Reuter, A. and Nelson, E. G., 2008. Hole-filled SRTM for the globe Version 4. http://srtm.csi.cgiar. org, accessed: 2015-08-12.
Kr¨otzsch, M., Vrandecic, D. and V¨olkel, M., 2006. Semantic mediawiki. In: I. Cruz, S. Decker, D. Allemang, C. Preist, D. Schwabe, P. Mika, M. Uschold and L. Aroyo (eds),The Se-mantic Web - ISWC 2006, Lecture Notes in Computer Science, Vol. 4273, Springer Berlin Heidelberg, pp. 935–942.
NISO, 2010. Z39.84-2005 (r2010) syntax for the digital object identifier. www.niso.org/standards/z39-84-2005/, ac-cessed: 2015-12-05.
OKFN, 2016. Open definition 2.1. http://opendefinition. org/od/2.1/en/, accessed: 2016-03-15.
OpenLayers Contributors, 2015. Openlayers - a high-performance, feature-packed library for all your mapping needs.http://openlayers.org/, accessed: 2015-10-23. Pachur, H.-J. and Altmann, N., 2007. Die Ostsahara im
Sp¨atquart¨ar: ¨Okosystemwandel im gr¨oßten hyperariden Raum der Erde. Springer Verlag.
QGIS Development Team, 2015. QGIS Geographic Information System.www.qgis.org, accessed: 2015-12-2.
during the late pleistocene and early holocene. Quaternary International274(0), pp. 1 – 4.
Sitek, D. and Bertelmann, R., 2014. Open access: A state of the art. In: Opening Science – The Evolving Guide on How the Internet is Changing Research, Collaboration and Scholarly Publishing, Springer Open, Heidelberg.
Verheul, J., Zickel, M., Becker, D. and Willmes, C., 2015. LGM major inland waters of Europe - GIS dataset. CRC806-Database, DOI: http://dx.doi.org/10.5880/SFB806. 14.
Willmes, C. and Bareth, G., 2012. A data integration concept for an interdisciplinary research database. In: A. Degbelo, J. Brink, C. Stasch, M. Chipofya, T. Gerkensmeyer, M. I. Hu-mayun, J. Wang, K. Brolemann, D. Wnag, M. Eppe and J. H. Lee (eds), Proceedings of the Young Researchers forum on Geographic Information Science - GI Zeitgeist, ifgiPrints 44, Akademische Verlagsgesellschaft AKA, Heidelberg, pp. 67 – 72.
Willmes, C., Becker, D., Brocks, S., H¨utt, C. and Bareth, G., 2016. High resolution K¨oppen-Geiger classifications of paleoclimate simulations. Transactions in GIS. DOI: 10.1111/tgis.12187.
Willmes, C., Brocks, S., Hoffmeister, D., H¨utt, C., K¨urner, D., Volland, K. and Bareth, G., 2012. Facilitating integrated spatio-temporal visualization and analysis of heterogeneous ar-chaeological and palaeoenvironmental research data. ISPRS Annals of Photogrammetry, Remote Sensing and Spatial Infor-mation SciencesI-2, pp. 223–228.
Willmes, C., K¨urner, D. and Bareth, G., 2014. Building Research Data Management Infrastructure using Open Source Software.