CREATION OF A HIGH-RESOLUTION PRODUCT CLC2006_BACKDATING BY A
BACKWARD LOOK FROM THE DIGITAL LAND COVER MODEL DLM-DE2009
TO 2006 - A CONTRIBUTION TO THE GERMAN CORINE LAND COVER 2012
PROJECT WITHIN A BOTTOM-UP APPROACH
M. Keil a, T. Esch a, S. Feigenspan b, M. Marconcini a, A. Metz a, M. Ottinger a, J. Zeidler a
a
German Aerospace Center (DLR), Earth Observation Center, German Remote Sensing Data Center (DFD), Oberpfaffenhofen, 82234 Weßling, Germany – (manfred.keil, thomas.esch, mattia.marconcini, annekatrin.metz, marco.ottinger, julian.zeidler)@dlr.de
b Federal Environment Agency (UBA), 06844 Dessau-Roßlau, Germany – [email protected]
Commission VI, WG VI/4
KEY WORDS: CORINE Land Cover 2012, Backdating, Bottom-Up, Multi-Seasonal Remote Sensing, Object-Based Approach, DLM-DE 2009, DLM-DE 2012, LBM-DE 2012
ABSTRACT:
For the update 2012 of CORINE Land Cover, in Germany a new approach has been developed in order to profit from the higher accuracies of the national topographic database. In agreement between the Federal Environment Agency (UBA) and the Federal Agency for Cartography and Geodesy (BKG), CLC2012 has been derived from an updated digital landscape model DLM-DE, which is based on the Official Topographical Cartographic Information System ATKIS of the land survey authorities. The DLM-DE 2009 created by the BKG served as the base for the update 2012 in the national and EU context, both under the responsibility of the BKG.
In addition to the updated CLC2012, a second product, the layer "CLC_Change" (2006-2012) was also requested by the European Environment Agency. The objective of the project part of DLR-DFD was to contribute the primary change areas from 2006 to 2009 in the phase of method change using the refined 2009 geometry of the DLM-DE 2009 for a retrospective view back to 2006. A semi-automatic approach was developed for this task, with an important role of AWiFS time series data of 2005 / 2006 in the context of separation between grassland – arable land. Other valuable datasets for the project were already available GMES land monitoring products of 2006 like the soil sealing layer 2006. The paper describes the developed method and discusses exemplary results of the CORINE backdating project part.
1. INTRODUCTION AND OBJECTIVE
Various geo-service developments have been performed since 2001 within EU and ESA programs in the field of land monitoring (GSE Forest Monitoring, 2010, Copernicus, 2014a, Copernicus, 2014b, Kuntz et al., 2014), as part of the GMES or Copernicus programs. In Europe, as one central component of these services the CORINE Land Cover (CLC) assessment remained, which was performed for the reference years 1990, 2000, 2006, and which is currently in production for 2012 (Copernicus, 2014c). Several service developments had the goal to supplement the information layers of CLC by higher thematic and geometric resolution as e. g. by the Pan-European “High Resolution Layers” concept. By this concept, the EEA aimed to introduce five thematic „High Resolution Layers“ (HRL) for a more detailed characterization of land cover and land use in their member countries – the raster datasets of sealed soil (imperviousness), forests (by tree cover density and forest type), permanent grasslands, wetlands and permanent water bodies (Copernicus, 2014d). One aspect of the HR Layers was to use them in further land monitoring and updating tasks (like CLC) by integrating specific developments, e.g. urbanization. In addition, EEA supported national activities to combine their specific national mapping programs with CLC assessment (see Arozarena et al. 2006), and to derive later in a bottom-up approach the relevant European land cover information for CORINE Land Cover due to the EEA specifications (e.g. with 25 ha minimum mapping unit, MMU).
A specific national approach has been chosen in Germany for updating land cover according to CORINE for the status 2012. This approach uses a more accurate geometry of the Official Topographical Cartographic Information System ATKIS of the land survey authorities (AdV, 2012). The “Digital Land Cover Model” DLM-DE, derived from ATKIS, was applied as base for the deduction of CLC classes, with an attribution to a specific CLC class for each polygon due to the CLC nomenclature. In the responsibility of the German Federal Agency for Cartography and Geodesy (BKG), the DLM-DE 2009 database was built-up for the reference year 2009 with a minimum mapping unit (MMU) of 1 ha (Arnold, 2009; BKG, 2012). Currently, an updated database DLM-DE 2012 (now named as LBM-DE 2012; BKG, 2015) is established by the BKG with the adjustment of an update using satellite data of 2012. By methods of generalization, this database will be trans-ferred into the CLC2012 database (Arnold et al., 2014).
spatial information on the changes regarding the more detailed geometry of DLM-DE 2009 (Keil et al., 2010a).
The modelling of changes between 2006 and 2009 in the detailed geometry of DLM-DE 2009 was task of DLR`s German Remote Sensing Data Center (DFD). For that purpose, a database „CLC2006_backdating“ had to be created by a „backward look“ from DLM-DE 2009 to the situation of land cover / land use in 2006. This was done using an approach including the 46 most common change classes (based on the changes between 2000 and 2006). As far as possible, automatic or semi-automatic methods were used.
2. DATA BASE
The available data base for the retrospective derivation of the land cover situation in 2006 consists of several vector data and satellite imagery products.
2.1 Vector Data
2.1.1 Land Cover Model DLM-DE2009: The database DLM-DE 2009 is based on the ATKIS Basis-DLM for the year 2009 which has been produced in responsibility of the BKG and checked and updated using various high resolution satellite imagery of the sensors RapidEye and DMC (BKG, 2012). DLM-DE 2009 was the base of „Backdating“ to the year 2006.
2.1.2 ATKIS Basis-DLM Flat Layer 2006 Federal States: The ATKIS Basis-DLM 2006 for all federal states was available in form of a prepared non-overlapping vector database, which was not checked and updated by satellite imagery. “Basis-DLM_2006_flat” was fixed to the status of early summer 2006.
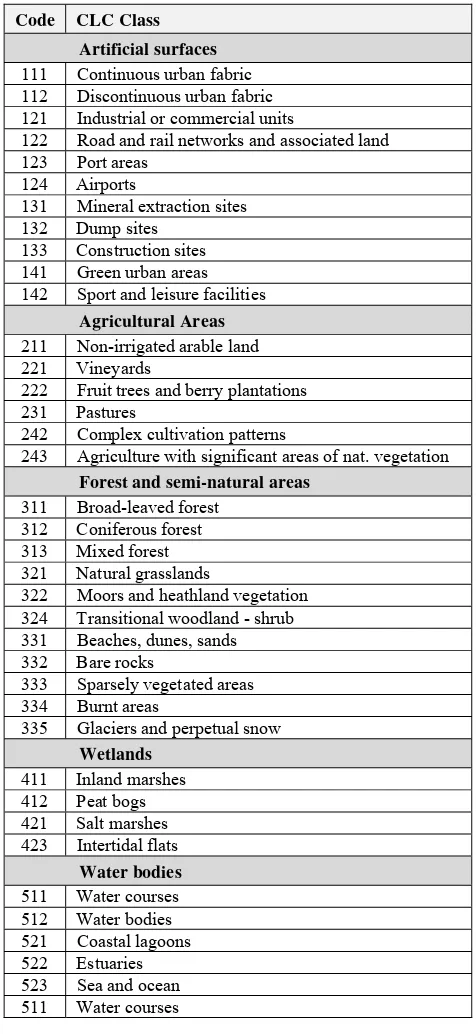
2.1.3 CORINE Land Cover 2006 (with 25 ha MKF): The dataset of CLC2006 (Keil et al., 2010b) was used directly only for special situations because of the minimum mapping unit (MMU) of 25 ha. However, the dataset was applied for many comparison tasks. The codes and the description of the CLC classes relevant for Germany are listed in Table 1.
2.2 Raster Data:
Besides datasets of satellite imagery of the period 2005 to 2007, several already available thematic products from GMES services were used.
2.2.1 Satellite imagery IMAGE2006 spring and summer: From the conventional approach of CORINE Land Cover production, the satellite database IMAGE2006 was available and used for the Backdating tasks. It consists of satellite images from the IRS-P6 LISS-III and SPOT-4 HRVIR / Spot-5 HRG sensors for two seasonal coverages (spring and summer aspect).
2.2.2 Satellite imagery Landsat-5 summer: Landsat-5 TM images covering entire Germany formed an additional homogeneous coverage in summer aspect for the year 2006. At the same time, the Landsat imagery built a backup input dataset in regions with restricted IMAGE2006 data availability caused by atmospheric conditions (high cloud cover).
2.2.3 Satellite imagery AWiFS 2005/2006 multi-seasonal: During pre-studies, the high potential of multi-seasonal AWiFS imagery was proven concerning the differentiation between arable land and pasture land (Metz, 2009); Keil et al., 2010a).
The AWiFS data with a spatial resolution of about 60 m were used to derive indicators for the characterization of vegetation dynamics and for the separation between arable and grassland. For the multi-seasonal coverage of Germany, 43 AWiFS scenes were purchased in the project. In order to reach at least applicable image data from four different months, it was necessary to built-up also German wide coverages of 2005 besides the reference year 2006.
Code CLC Class
Artificial surfaces 111 Continuous urban fabric 112 Discontinuous urban fabric 121 Industrial or commercial units
122 Road and rail networks and associated land 123 Port areas
124 Airports
131 Mineral extraction sites 132 Dump sites 133 Construction sites 141 Green urban areas 142 Sport and leisure facilities Agricultural Areas
211 Non-irrigated arable land 221 Vineyards
222 Fruit trees and berry plantations 231 Pastures
242 Complex cultivation patterns
243 Agriculture with significant areas of nat. vegetation Forest and semi-natural areas
311 Broad-leaved forest 312 Coniferous forest 313 Mixed forest 321 Natural grasslands
322 Moors and heathland vegetation 324 Transitional woodland - shrub 331 Beaches, dunes, sands 332 Bare rocks
333 Sparsely vegetated areas 334 Burnt areas
335 Glaciers and perpetual snow Wetlands
411 Inland marshes 412 Peat bogs 421 Salt marshes 423 Intertidal flats Water bodies
511 Water courses 512 Water bodies 521 Coastal lagoons 522 Estuaries 523 Sea and ocean 511 Water courses
Table 1: The 37 CORINE Land Cover classes for Germany
version „EEA Fast Track Service Precursor – Degree of soil sealing“ includes built-up areas, mineral extraction sites, and still open construction sites. The version „Revised Soil Sealing 2006, degrees of sealing 20 m and 100 m“ had been completely revised in the FP7 project „geoland2” and does not include mineral extraction sites and open construction sites (EEA, 2009; EEA, 2010).
2.2.5 Regional available data: For various regions of Germany, forest map products were available from the project „GSE Forest Monitoring“, produced under responsibility of the GAF AG (GSE Forest Monitoring, 2010).
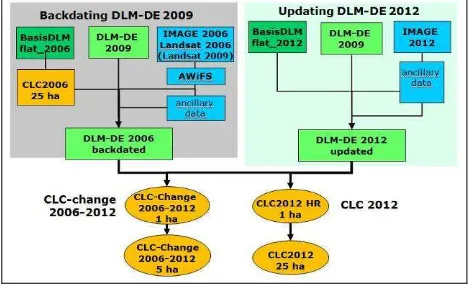
Figure 1 shows a summing-up of data flows and working steps (as part of the whole project CLC2012). Two tasks can be identified: First, the updating for the description of CLC status in the year 2012; secondly, the backdating as part of the deduction of „CLC-Change“, including the changes between 2006 und 2012. The updating component (data flows on the right) was carried out by BKG as explained before.
Figure 1: The two tasks of updating and backdating during the production of CLC2012 and CLC-change (2006 – 2012) showing also the related data flows. Source: Keil et al, 2015.
3. METHODS
As the fine-scale geometry of the DLM-DE 2009 vector database played an emphasized role in the project, an object-based approach was chosen, with the combination of quite a number of data sources. Five different software packages were used: The processing system CATENA, developed by the DLR Remote Sensing Technology Institute, was deployed for various steps of pre-processing (Krauß et al., 2013). The GIS software ESRI ArcGIS 10 was used for all GIS related steps. For image processing, ERDAS Imagine version 2011, eCognition Developer version 64 of Trimble company (particularly for image segmentation), and the „Interactive Description Language“ IDL (version 7.1 and 8.1) were used. In the following, the main steps of the applied methodology are described.
3.1 Approach to assess primary change processes:
For backdating the DLM-DE2009 onto the situation of land cover in 2006, an approach was chosen which uses the most common 46 change classes (based on the changes between 2000 and 2006, assessed in CLC2006; Keil et al., 2015). A grouping of the change classes was helpful to characterize and to understand the different change processes (see Table 2).
Table 2: Grouping the change classes in nine main change processes
The first 8 change processes already cover 51.2% of cumulated percentages of change areas, composed by changes in forest composition because of storm damages (clearing and reforestation), transitions from grassland to arable land in agriculture, development of new settlements, industrial built-up and mineral extraction sites on arable land. Taking into account the 46 most frequent change classes, a coverage of 89.7 % of the changed areas in CLC2006 was given. To reach up to 80% of the change areas (with the estimate of CLC2006), about 27 change classes are required (see Table 3).
Rank
Table 3: The dominating 27 change classes due to CLC changes between 2000 and 2006 in Germany, delivering a cumulated value of about 80% of all change areas. Concerning the used background colours, see the associated groups of change processes in Table 2.
No Group of change processes 1 Intensivication in agriculture 2 Extensivication in agriculture 3 Afforestation
4 Areas with forest loss
5 Urbanisation / Increase of soil sealing 6 New mineral extraction sites 7 Recultivation of extraction sites 8 New water bodies
Through suitable grouping of change classes it was initiated to refer on thematic raster layers for their status in the reference year 2006 - e.g. a layer of mineral extraction sites, CLC class 131, delivers certain proportions in the polygons of DLM-DE2009 during a recultivation process. By segmentations of generally affected polygons, based on high resolution satellite data like in IMAGE2006, sub-areas in the change polygons were to be integrated.
3.2 Pre-processing steps:
Germany was divided into 6 working units – so called regions - consisting of one or more federal states. Thus, macro-region BY contained the area of Bavaria, NW the area of North Rhine-Westphalia, Hesse, Rhineland-Palatinate, and Saarland.
Prepared mosaics of IMAGE2006 coverages (spring and summer) for each macro-region and an additional dataset of Landsat summer data built the high resolution satellite data base. The preparation step of the mosaics included cloud and cloud shadow masking to define invalid pixels. The cloud identification for the IMAGE2006 data and the AWiFS data was performed within CATENA. For the Landsat data an approach by Zhu et al, 2012 was used. By the seamline polygons, information on radiometric similar mosaic parts was available for the use in further classification steps.
As one main thematic information layer in agricultural areas, the multi-seasonal information of IRS-P6 AWiFS time series was to be integrated for the separation of arable and grassland areas. For this it was necessary to apply a co-registration of the AWiFS data, as well as a generation of multi-seasonal mosaics and a deduction of temporal statistics for AWiFS.
In several studies, the potential of multi-seasonal satellite data for agricultural tasks was shown, for crop type mapping as well as for separation of arable land and grassland (Itzerott & Kaden, 2006; Esch et al., 2014 a, b). Multi-seasonal data of AWiFS was also integrated in a contribution to the EEA GIO Land project, concerning the HR layer of Grassland (Zillmann et al., 2014).
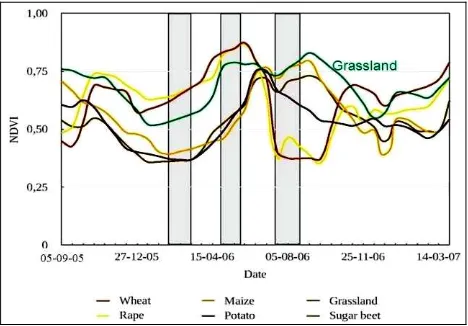
In this project, the vegetation index NDVI („Normalized Difference Vegetation Index“) derived from AWiFS was used as an indicator for the description of vegetation development in the single objects along the year (providing information on phenological characteristics for vegetated areas), with the NDVI time series data containing valuable information for the affiliation to arable land or grassland. In general, it can be assumed that the temporal dynamic range of NDVI is higher for arable land than for grassland. But characteristic phenological periods have to be included as investigated by Metz (2009). An example of phenology curves is presented in Figure 2 (from Metz, 2009), including curves of different crops and grassland derived from MODIS NDVI. Three periods during the vegetation cycle are marked in grey, important for the task of arable / grassland separation.
Finally, a set of temporal statistics parameters minimum, maximum, mean, standard deviation and range was calculated and evaluated from AWiFS (Keil et al., 2015) which seemed to be a quite robust parameter set valid also along a period of two years (2005 and 2006). As already remarked, it was not possible to get full coverages for the months of April, May, July, and September within one year.
Figure 2: Average phenology curves derived from MODIS NDVI for wheat, rape, maize, potatoes, sugar beets and grassland showing potential intervals for a separation of cropland and grassland (grey intervals; source: Metz, 2009, modified).
3.3 Derivation of thematic raster layer:
The derived thematic raster layers with the status of 2006 had partly the role of interim layers. These layers were also further processed using logical linking. On the other hand, the raster layers, such as the deduced layer of mineral extraction sites (CLC class 131) to the status of 2006, could directly be integrated to derive potential transitions of land cover (e.g. for the transition 131 → 512, mineral extraction site in 2006 to water body in 2009).
The following interim layers are to be named:
• Two variants of „Soil Sealing Layer 2006“: including and excluding mineral extraction and construction sites, information layer for extraction sites in 2006 (EEA, 2009, 2010);
• Built-up Layer 2006 from Basis-DLM_2006_flat (with high degree on timeliness), including at least one of the CLC-classes 111, 112 or 121;
•Layer for forest cover 2006 (forest mask 2006) from Basis-DLM_2006_flat (also highly up-to-date concerning the outer limit of forest areas), with at least one of the forest classes in CLC showing 311, 312, 313, or 324.
By combinations of interim layers and satellite image products, or solely by products derived from satellite data, the following raster layers were deduced, which can be directly integrated in the land cover situation of 2006:
• Water mask (CLC 512), derived by combined threshold
classifications from three deduced indices from the Landsat mosaics (NDVI, water index MNDWI due to Xu (2006), SWIR band); the water class is not considered for potential change areas, but it is important for the manual checks (e. g. for mineral extraction sites or transitions in 2006) and as an exclusion layer for checking certain changes;
and the single Landsat scenes of 2006, concerning vegetation cover status (Keil et al., 2015);
•Construction sites (CLC133), derived by the two variants of soil sealing layer, with an additional rule on membership to at least one of the DLM-DE2009 classes: 133, 111, 112, 121, or 122;
• Arable areas (CLC 211), delineation by a combination of thresholds for the temporal statistics results of the AWiFS based NDVI time series, and exclusion of built-up areas, forest areas, and water areas in 2006;
•Grassland areas (CLC 231, partly also CLC 321), in addition delineation by a combination of thresholds for the temporal statistics results of the AWiFS based NDVI time series, and exclusion of built-up areas, forest areas, and water areas in 2006, and sometimes other areas like permanent crops / fruit tree plantations;
•Forest distribution concerning the four forest classes (CLC 311, 312, 313, 324); diversification within the forest mask 2006, use of CLC2006, determination of detailed distribution of forest areas with status 324 in DLM-DE2009 and (still) 312 in 2006 or (already) 324 in 2006 by using IMAGE2006 and Landsat based information, especially in the SWIR bands, for classification (Keil et al., 2015);
•Only regional distributed land cover classes (CLC 222, 321, 331, 333), with the initial situation deduced by CLC2006, partly adapted by manual improvements.
3.4 Integrating the information from DLM-DE2009, satellite imagery 2006 and raster layers 2006:
The 12 thematic raster layers keep the thematic information on land cover / land use in the status of 2006 and correspond with one of the CLC classes (see before). They determine the participating classes for 2006 concerning the main changes and their spatial distribution. For modelling the backdating dataset, the following further tasks had to be performed:
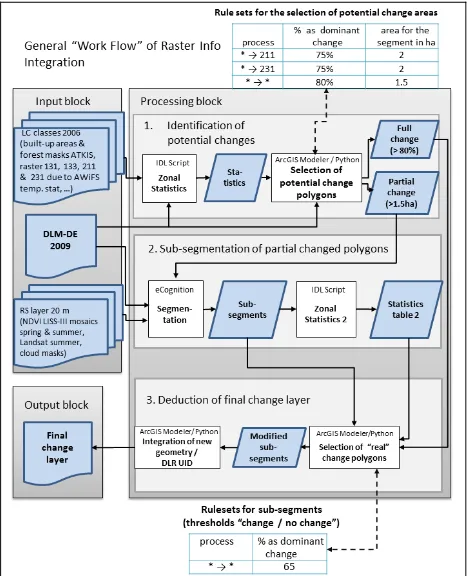
• Derivation of polygons which are potentially affected by changes in the geometric skeleton of DLM-DE2009 (calculation of zonal statistics);
• Determination of polygons which show a complete (or by high dominance) transition to another CLC class in 2006 (calculation of zonal statistics);
• Sub-segmentation of polygons which are partly affected by changes between 2006 and 2009 using eCognition Developer; the segmentation used suitable high resolution satellite data in form of the three mosaics “summer aspect LISS-III“ including cloud and cloud shadow masks, „spring aspect LISS-III“ including cloud & cloud shadow masks, and „summer aspect Landsat-5 Thematic Mapper“ with cloud masks;
• Allocation of the dominant CLC classes due to the thematic raster layers as class members in the selected sub-segments (determination using zonal statistics assessment) and output of the change polygons.
The work flow including the data flow is presented in the overview graph in Figure 3.
Figure 3: Work flow during the integration of satellite imagery, thematic raster layers and the input data of DLM-DE 2009 vector database
3.5 Plausibility checks and improvement of change polygons:
The determined polygons which showed a change in comparison to 2009 were investigated by a number of plausibility checks. The results were first noted in additional attributes. Before thematic inspections, checks were done for polygons with an area below 0.5 ha and 1.0 ha, respectively, followed by form parameter checks to identify small objects.
These polygons were not included in the plausibility checks but were marked and were still available for later tasks in the context of complex change areas (Keil et al., 2015). As one example, the checks for potential changes from arable land / pasture land (CLC classes 211 and 231) to recreation and sports areas (CLC class 142) are mentioned here. CLC class 142 is not covered by the built-up or the forest mask. Thus, class 142 is included in the classification of arable and pasture land for 2006. Most indicated changes are not real changes. But a check is necessary to identify changes from arable or pasture land to new golf courts which are part of CLC class 142 in 2009.
4. RESULTING PRODUCTS
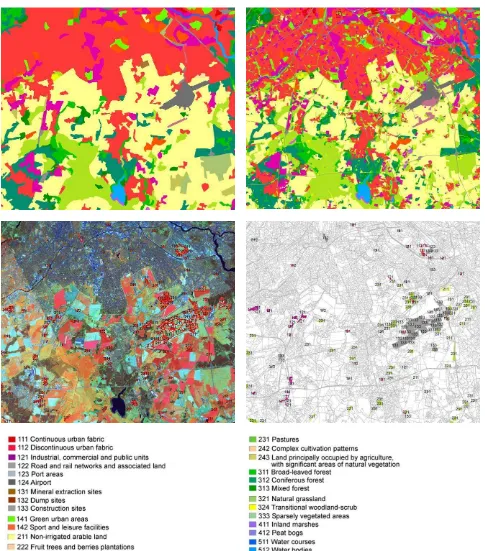
Figure 4 shows several city districts of the Southern parts of Berlin and the adjoining region in Brandenburg with the area of Berlin-Brandenburg International Airport (Berlin Schönefeld) under construction. A comparison of CLC2006 (upper left) and DLM-DE_Backdating (upper right) shows the much higher spatial details in DLM-DE. As main change, the starting preparation of the airport in 2009 (construction site 131 in 2009, mainly arable land 211 in 2006) is apparent. Further change classes belong to changes within agriculture (transfers 211 → 231 or vice versa), and to new urbanization processes, with industrial and commercial areas in 2009, on former arable land (211) in 2006.
A statistical assessment on the amount of changes concerning the six defined macro-regions showed that the percentages of change areas varied between 1.9% and 3.1%.
5. CONSIDERATIONS OF DATA QUALITY
Concerning the indicated changes in agricultural areas, full-cover checks of the contribution to arable land or pasture land were necessary, as in several situations, the AWiFS indicators were disturbed or reflected special situations in the statistical indicators. Together with the multi-seasonal AWiFS indication, also the combination of visual inspection of the three high resolution satellite mosaics was considered for the decision if polygons had to be marked with an index for real change or no change. Due to time limits, the checks had to be done on scales ranging from 1:30,000 to 1:40,000.
One source of error in the distribution assessment of arable and grassland can be found in riparian zones where temporal flooding in spring time or during other seasons influences the NDVI values of AWiFS time series. In several situations, the AWiFS indicators show wrong changes, with low values of the NDVI for the flooding periods, and thus also marking higher dynamics on the flooded meadows like on neighboring areas used for arable agriculture.
In addition, the deduced statistical parameters (e.g. minimum, mean, standard deviation) depend on the representativeness of available acquisition times in the AWiFS scenes and on local gap-free or gap-disturbed coverage by 4 up to 7 scenes. In the combined use of AWiFS indicators and the three mosaic variants of LISS-III and Landsat products, an essential improvement of allocation to real and non-real changes in agriculture was possible. It can be assumed that the multi-seasonal coverage can be optimized in future, e. g. by time series data of the future Sentinel-2 system, thus also improving the automatic arable land / pasture land separation.
An area-wide check of indicated change polygons was also performed concerning changes in several forest areas (e.g. affected by storm damages) and transformation processes in areas surrounding mineral extraction sites. For other change types, the largest change polygons per change combination were checked, followed by checks on smaller polygons. Partly, this approach was combined by area-wide checks in regions with indications of false change contributions and in “hot spots” of changes.
6. CONCLUSION
In this project, a semi-automated approach was used for the derivation of land cover changes, based on 46 change classes which were indicated to cover about 90% of change areas. The
applied method was proven to be a feasible approach, delivering satisfying results. However, a quite large amount of pre-processing was connected with this, especially regarding satellite image mosaics and the checks and manual improvements of the automatically detected change polygons. With respect to the large data volume of the DLM-DE vector database with 1 ha MMU, it should be remarked that an effective pre-selection of potential change polygons and a manageable segmentation were crucial steps during the project progress.
With an improved multi-seasonal database in the upcoming Sentinel-2 era, there will be an improved multi-seasonal coverage for analyses in the field of agriculture. Altogether, a similar semi-automated approach is also conceivable in the context of a forward-looking update of a land cover database by applying available vector geometries.
ACKNOWLEDGEMENTS
The authors acknowledge the support and funding by the Federal Ministry for the Environment, Nature Conservation, Building and Nuclear Safety, which financed the project under the funding code UBA FKZ 3712 12 282.
The following Copyrights and Credits are indicated concerning the satellite products used in the reported project:
• Concerning the use of ortho-rectified IRS LISS-III products: “Includes material © ANTRIX Corporation Limited 2007, Distribution by Euromap GmbH, Germany, all rights reserved; produced by DLR/Metria from IRS products provided under ESA contract for FTS LM IMAGE2006”.
• Concerning the use of ortho-rectified SPOT products: “Includes material © CNES 2007, Distribution Spot Image S.A., France, all rights reserved; produced by DLR/Metria from SPOT products provided under an ESA contract for FTS LM IMAGE2006”.
• Concerning IRS-P6 AWiFS products: "Includes material © Antrix, distributed by Euromap GmbH, Germany".
• Concerning Landsat products: “Landsat imagery courtesy of NASA Goddard Space Flight Center and U.S. Geological Survey”.
REFERENCES
AdV, 2012. Amtliches Topographisch-Kartographisches Informationssystem (ATKIS). http://www.adv-online.de/AdV-Produkte/Geotopographie/ATKIS/ (3 Mar. 2015).
Arnold, S., 2009. Digital Landscape Model DLM-DE – Deriving Land Cover Information by Integration of Topographic Reference Data With Remote Sensing Data.
ISPRS Hannover Workshop 2009.
http://www.isprs.org/proceedings/xxxviii/1_4_7-w5/paper/Arnold-167.pdf (3 Mar. 2015).
BKG, 2012. Digitales Landbedeckungsmodell für Deutschland - DLM-DE2009. Stand der Dokumentation: 30.03.2012. http://www.geodatenzentrum.de/docpdf/dlm-de2009.pdf (3 Mar. 2015).
BKG, 2015. Bundesamt für Kartographie und Geodäsie - Digitales Landbedeckungsmodell für Deutschland (LBM-DE). http://www.bkg.bund.de/nn_168418/DE/Bundesamt/Produkte/ Geodaten/Landbedeckungsmodell/DLM-DE__node.html (20 Mar. 2015).
Copernicus, 2014a. Copernicus Land Monitoring Services - Copernicus - The European Earth Observation Programme. http://land.copernicus.eu (10 Mar. 2015).
Copernicus, 2014b. Copernicus – The European Earth Observation Programme - geoland2.
http://www.copernicus.eu/pages-principales/services/land-monitoring/geoland2/ (15 Mar. 2015).
Copernicus, 2014c. Copernicus Land Monitoring Services – Corine Land Cover 2012. http://land.copernicus.eu/pan-european/corine-land-cover/clc-2012/view (15 Mar. 2015).
Copernicus, 2014d. Copernicus Land Monitoring Services – High Resolution Layers. http://land.copernicus.eu/pan-european/high-resolution-layers/view (15 Mar. 2015).
EEA, 2009. GMES Fast Track Service Precursor on Land Monitoring 2006, High-resolution core land cover data – built-up areas incl. degree of soil sealing. Updated Delivery Report European Mosaic (EEA-FTSP-Sealing-Enhancement_DeliveryReport-EuropeanMosaic Issue 1.0), Date Issued: 22 Dec. 2009.
EEA, 2010. EEA Fast Track Service Precursor on Land Monitoring - Degree of soil sealing.
http://www.eea.europa.eu/data-and-maps/data/eea-fast-track-service-precursor-on-land-monitoring-degree-of-soil-sealing (13 Mar. 2015).
Esch, T., Metz, A., Marconcini, M., Keil, M., 2014a. Differentiation of Crop Types and Grassland by Multi-scale Analysis of Seasonal Satellite Data. In: Manakos, I. & Braun, M. (Ed.), Land Use and Land Cover Mapping in Europe - Practices and Trends. Remote Sensing and Digital Image Processing, Volume 18, 2014, pp 329-339. Springer Dordrecht. ISBN: 978-94-007-7968-6 (Print) 978-94-007-7969-3 (Online).
Esch, T., Metz, A., Marconcini, M., Keil, M., 2014b. Combined use of multi-seasonal high and medium resolution satellite imagery for parcel-related mapping of cropland and grassland. International Journal of Applied Earth Observations and Geoinformation, 2014, 28, pp. 230-237.
GSE Forest Monitoring, 2010. Welcome to GSE Forest Monitoring. http://www.gmes-forest.info/ (15 Mar. 2015).
Itzerott, S. & Kaden, K., 2006. Ein neuer Algorithmus zur Klassifizierung landwirtschaftlicher Fruchtarten auf Basis spektraler Normkurven – An algorithm to classify agricultural crops on the basis of spectral standard curves. -
Photogrammetrie, Fernerkundung, Geoinformation, 6/2006, p. 509-518, Stuttgart.
Keil, M., Metz, A., Nieland, S., 2010a. Begleitende Arbeiten zur Aktualisierung 2006 von CORINE Land Cover -
Abschlussbericht zum UBA Auftrag Z6 - 00335 4218. Deutsches Zentrum für Luft- und Raumfahrt e.V., Deutsches Fernerkundungsdatenzentrum Oberpfaffenhofen.
Keil, M., Bock, M., Esch, T., Metz, A., Nieland, S., Pfitzner, A., 2010b. CORINE Land Cover Aktualisierung 2006 für Deutschland. Abschlussbericht zu den F+E Vorhaben UBA FKZ 3707 12 200 und FKZ 3708 12 200. Deutsches Zentrum für Luft- und Raumfahrt e.V., Deutsches Fernerkundungsdatenzentrum, Oberpfaffenhofen.
Keil, M., Esch, T., Divanis, A., Marconcini, M., Metz, A., Ottinger, M., Voinov, S., Wiesner, M., Wurm, M., Zeidler, J., 2015. Updating the Land Use and Land Cover Database CLC for the Year 2012 - „Backdating“ of DLM-DE of the Reference Year 2009 to the Year 2006. Final Report for the R&D Project UBA FKZ 3712 12 282, German Aerospace Center (DLR), German Remote Sensing Data Center (DFD), Oberpfaffenhofen.
Krauß, T., D’Angelo, P., Schneider, M., Gstaiger, V., 2013. The Fully Automatic Optical Processing System CATENA at DLR. International Archives of the Photogrammetry, Remote Sensing and Spatial Information Sciences, Volume XL-1/W1, ISPRS Hannover Workshop 2013, 21 – 24 May 2013, Hannover, Germany.
Metz, A., 2009. Knowledge based update of DLM–DE with remote sensing and geo-data for deduction of a high resolution land use / land cover mapping using CORINE Land Cover. Diplomarbeit, Technische Universität Dresden.
Xu, H., 2006. Modification of normalised difference water index (NDWI) to enhance open water features in remotely sensed imagery. International Journal of Remote Sensing Vol. 27, No. 14, 20 July 2006, 3025–3033.
Zhu, Z. & Woodcock, C. E., 2012. Object-based cloud and cloud shadow detection in Landsat imagery. Remote Sensing of Environment 118 (2012) 83–94.