www.elsevier.nlrlocateraqua-online
Dietary lipid level, hepatic lipogenesis and flesh
ž
/
quality in turbot Psetta maxima
C. Regost
a, J. Arzel
a, M. Cardinal
b, J. Robin
a, M. Laroche
c,
S.J. Kaushik
d,)a
Fish Nutrition Laboratory, Unite mixte INRA-IFREMER, Centre de Brest IFREMER,´
29280 Plouzane, France´
b
VPrGA, IFREMER, 44000 Nantes, France
c
LEIMA, INRA, 44316 Nantes, France
d
Fish Nutrition Laboratory, Unite mixte INRA-IFREMER, Lab. de Nutrition des Poissons, Station´
d’Hydrobiologie, BP 3, 64310 Saint Pee-sur-Ni´ Õelle, France
Received 21 January 2000; received in revised form 2 August 2000; accepted 2 August 2000
Abstract
A study was undertaken with marketable size turbot to evaluate the effects of dietary fat levels on chemical composition, lipogenesis and flesh quality. Four experimental diets containing graded levels of fish oil in order to obtain 10%, 15%, 20% and 25% of crude fat were fed to triplicate
Ž .
groups of turbot initial body weight of 660 g for 12 weeks in full strength seawater at temperature of 178C. Nutrient digestibility was not influenced by dietary fat levels. The best growth performance was observed in fish fed 10% and 15% dietary fat. High dietary lipid levels
Ž led to higher fat deposition in whole fish, although lipid level in muscle remained low 1.1% in
.
dorsal muscle and 1.7% in ventral muscle irrespective of diet . Significant subcutaneous fat accumulation was detected in turbot. No protein sparing effect by lipid was observed in turbot fed
Ž
high dietary fat. Hepatic lipogenic enzymes glucose-6-phosphate dehydrogenase, G6PD; malic .
enzyme, ME and acetyl CoA carboxylase did not show any clear change in activity in response to dietary fat content. With regards to quality parameters, there were no differences in gutted and fillet yields among treatments. Sensory analyses of dorsal fillets indicated only a difference in
Ž .
exudation corresponding to loss of water and whiteness within treatments in accordance with instrumental colour analyses and on ventral fillets, only a difference of sweet flavour was observed. No differences in hardness were detected by either instrumental texture analysis or
)Corresponding author. Tel.:q33-5-59-51-59-51; fax:q33-5-59-54-51-52.
Ž .
E-mail address: [email protected] S.J. Kaushik .
0044-8486r01r$ - see front matterq2001 Elsevier Science B.V. All rights reserved. Ž .
sensory analysis. In conclusion, although high dietary lipid levels affected growth and whole body composition of turbot adversely they induced very few alterations in flesh quality.q2001 Elsevier Science B.V. All rights reserved.
Keywords: Psetta maxima; Dietary lipids; Fat deposition; Lipogenesis; Flesh quality
1. Introduction
Ž .
Fish lipids are rich in ny3 polyunsaturated fatty acids PUFA , which are essential for fish health and growth. In comparison with terrestrial animal meat, lipids of fish flesh are recognised as beneficial to human health by decreasing cardiovascular and
Ž .
inflammatory disorders Piclet, 1987; Nettleton, 1991; Klor et al., 1997 . In fish nutrition, lipids as a nonprotein energy source allows protein sparing by effectively
Ž .
reducing organic matter and nitrogen losses Lee and Putnam, 1973 and salmonid aquaculture today uses high fat diets. There is, however, concern that high level of dietary lipids may lead to increased fat deposition in fish, depending upon species and age, and modifies flesh quality in terms of storage stability, transformation yield and
Ž
organoleptic and physical properties Austreng and Krogdahl, 1987; Fauconneau et al.,
.
1993; Guillaume et al., 1996; Gjedrem, 1997; Lie, 1997 . A number of studies with
Ž
salmonids have shown that nutritional factors, such as dietary protein sources Kaushik
. Ž . Ž
et al., 1995 , fat sources Guillou et al., 1995 , dietary fat content Bjerkeng et al.,
. Ž . Ž
1997 , vitamin E Boggio et al., 1985 and starvation Einen and Thomassen, 1998;
.
Einen et al., 1998 , can influence the physical and organoleptic flesh quality. Some studies in marine flatfish, such as Atlantic halibut, have also shown the importance of
Ž
dietary fat levels in modifying flesh quality Berge and Storebakken, 1991; Nortvedt and
.
Tuene, 1998 .
Turbot is a highly valued marine flatfish farmed in northern waters in Europe especially along the Atlantic coast and appreciated by consumers. Turbot is known to have high dietary protein requirements and in juvenile turbot high levels of dietary lipids
Ž
appear to have adverse effects on growth and body composition Cacerez-Martinez et
.
al., 1984; Danielssen and Hjertnes, 1993 . In some species, such as the salmonids, fat deposition is mainly in the viscera and to a lesser extent in the muscle. In species, such
Ž
as the European seabass, fats accumulate in liver and viscera Corraze and Kaushik,
. Ž
1999 . In turbot, lipid accumulation is localised in the marginal body parts Andersen
.
and Alsted, 1993 with little or no fat deposition in the viscera. The few studies, which have dealt with flesh quality in turbot, involved some descriptive methodological aspects
Ž .
of volatile compounds on aroma Prost et al., 1998 and on methods of cooking fillets of
Ž .
Greenland turbot Madeira and Penfield, 1985 .
In terms of the lipogenic process, fish are recognised as comparable to mammals
ŽIritani et al., 1984 . High fat diets depress the activities of several lipogenic enzymes,.
Ž .
such as fatty acid synthetase, malic enzyme ME and glucose-6-phosphate
dehydroge-Ž . Ž .
nase G6PD in salmonids Lin et al., 1977a; Arnesen et al., 1993; Alvarez et al., 1998
Ž .
The aim of this study was to evaluate in marketable size turbot the effects of dietary fat levels on nutrient utilisation, tissue composition, fat deposition, lipogenesis, sensory and physical quality of flesh.
2. Material and methods
2.1. Experimental diets
Ž
Four isonitrogenous digestible protein: 59%, calculated from apparent digestibility
Ž . .
coefficients ADC of protein diets were formulated to contain 10%, 15%, 20% and
Ž .
25% of crude fat, using gradient increases in fish oil. Yttrium oxide 0.1% was added as an indicator for digestibility measurements. Diets were manufactured industrially by
Ž .
Nutreco Aquaculture Research Centre, Stavanger, Norway , using a twin-screw ex-truder, in the form of 9-mm-diameter pellets. Ingredient and chemical composition of the diets are reported in Table 1.
Table 1
Ingredients and proximate composition of the experimental diets Experimental diets
10 15 20 25
( ) Ingredients %
Ž .
Fish meal Norseamink 50.0 50.0 50.0 50.0
Soluble fish protein concentrate 8.0 8.0 8.0 8.0
Whole wheat 22.1 15.3 8.3 1.5
Wheat gluten 13.1 14.7 16.4 18.0
Fish oil 3.8 9.0 14.3 19.5
a
Mineral mix 1.0 1.0 1.0 1.0
a
Vitamin mix 1.0 1.0 1.0 1.0
Ž .
Binder Edelbind 0.9 0.9 0.9 0.9
Yttrium oxide 0.1 0.1 0.1 0.1
Proximate composition
Ž .
Dry matter DM , % 89.8 90.1 91.0 93.6
Crude protein, % DM 61.3 62.2 62.5 61.3
Crude fat, % DM 11.3 16.2 21.4 27.7
b
Phospholipids, % DM 2.7 3.0 3.2 3.8
Ash, % DM 8.5 8.2 8.1 8.3
Gross energy, kJrgDM 22.1 23.2 24.1 24.6
c
Ž .
Digestible protein DP , % DM 58.7 59.9 59.9 59.1
Ž .
Digestible energy DE , kJrgDM 19.0 20.9 21.6 22.3
DPrDE ratio, mgrkJ 30.8 28.6 27.7 26.5
a Ž . Ž .
Proprietary mixtures Nutreco, ARC providing levels meeting requirements as proposed by NRC 1993 .
b
Levels of phospholipids were calculated from lipids of Folch analyses.
c Ž .
2.2. Digestibility measurements
ADC of the experimental diets were determined with triplicate groups of fish. Fifteen
Ž .
turbot body weight: 815"8 g; mean"S.D. were allotted to cylindroconical tanks, each of which was equipped with a flat-bottomed large-mesh basket and was supplied
Ž .
with fresh seawater temperature maintained at 17"18C; mean"S.D. in a flow-through system. Fish were fed to satiety once a day and faecal samples were collected using a
Ž .
faeces settling column similar to the one developed by Cho et al. 1982 . For each treatment, faecal samples were collected once a day each morning over 2 consecutive
Ž .
weeks and were centrifuged 3000=g at 68C for 20 min and kept frozen at y208C. After freeze-drying, the faeces were analysed for yttrium, crude protein, crude fat and gross energy. The ADC of the experimental diets was calculated as follows:
% Tracer in Diet % Nutrient or Energy in Faeces
ADC %
Ž .
s100yž
100 =/
% Tracer in Faeces % Nutrient or Energy in Diet
2.3. Growth study
Ž
The growth trials were conducted in the experimental facilities of IFREMER Centre
.
de Brest at a constant seawater temperature of 17"0.58C with a salinity of 35‰ in a flow through system for a period of 12 weeks. Twenty-two turbot, Psetta maxima,
Žinitial body weight: 657"6 g; mean"S.D. were randomly allotted to each tank, 1. Ž
3 y1.
m tank with a water flow rate of 18 l min . A 12r12 h lightrdark cycle was adopted. The different diets were randomly allotted and triplicate groups were fed by
Ž .
hand once a day to visual satiety visual observation of first feed refusal over a 90-min period and feed intake was recorded. Each group was weighed every 3 weeks to follow growth and feed utilisation.
2.4. Samplings
At the beginning of the growth study, six fish from an initial pool of fish were sampled and stored aty208C for analyses of whole body composition. Six fish from the same initial pool were also withdrawn to weigh the liver and the digestive tract for
Ž . Ž .
calculating hepatosomatic index HSI and viscerosomatic index VSI .
At the end of the trial, the same protocol of slaughter was followed for each tank.
Ž
Five fish per tank were withdrawn for comparative carcass analyses water, ash, protein,
. Ž .
fat and energy and nutrient retention calculation. Blood samples 1 ml were withdrawn
Ž
from the best replicate using heparinised syringes. After centrifugation 1200=g, 10
.
min, 58C , plasma was separated and stored frozen at y208C as separate aliquots for analyses of triglyceride and total cholesterol concentrations. Six livers and viscera were withdrawn from fish from the same replicate for analyses of lipid and hepatic enzyme
Ž .
were measured in fresh liver samples. For quality analyses, fish were stunned, bled to death in ice cold water before dissection. After slaughter, gutting was done immediately and filleting was over within 30 min. Eight fish per tank were withdrawn to weigh the liver and the digestive tract for calculating HSI and VSI and for the following analyses:
Ž .
three fish fillets with skin for sensory analyses, three other fish for instrumental
Ž .
analyses of texture fillets within skin and, finally, two fish were withdrawn for lipid
Ž .
analyses in muscle dorsal and ventral fillets and skins. Samples of muscle and organs for lipid analyses were frozen in liquid nitrogen and stored aty808C.
2.5. Analytical methods
The fish for whole body composition were ground frozen and a representative part was freeze-dried before analysis. Proximate composition analyses of diets, faeces and chemical composition of whole body and tissues were conducted following standard
Ž . Ž
laboratory procedures AOAC, 1984 : dry matter after desiccation in an oven 1058C for
. Ž . Ž
24 h , ash incineration at 5508C for 12 h , crude protein N=6.25 using a Dumas
. Ž
nitrogen analyser, Fisons Instrument , crude fat dichloromethane extraction by Soxhlet
. Ž .
method and gross energy IKA Adiabatic Calorimeter C4000 A . Plasma total
choles-Ž
terol and triglyceride concentrations were determined using commercial kits Boehringer
.
no. 1442341, Mannheim, Germany and bioMerieux no. PAP150, France, respectively .
´
Analysis of yttrium in the diets and faecal matter was done in predigested samples as
Ž .
detailed in Mambrini et al. 1999 .
In liver, viscera, muscle and skin samples, total lipid was determined according to
Ž .
Folch et al. 1957 , chloroform being replaced by dichloromethane. The separation of neutral lipids and phospholipids were realised according to the procedure described by
Ž .
Juaneda and Rocquelin 1985 . The total lipid extracts were fractionated on silica
Ž .
cartridges Sep-Pack, Waters , neutral lipids were eluted by chloroform and phospho-lipids by methanol.
For assays of hepatic lipogenic enzyme activities, liver samples were homogenised in
Ž
three volumes of ice-cold buffer 0.02 M Tris–HCl, 0.25 M sucrose, 2 mM EDTA, 0.1 M sodium fluoride, 0.5 mM phenyl methyl sulphonyl fluoride, 0.01 M b
-mercapto-.
ethanol, pH 7.4 and the homogenates were centrifuged at 20,000=g at 48C for 20 min. Soluble protein content of liver homogenates was determined by the method of Bradford
Ž1976 using bovine serum albumin as the standard. Selected lipogenic enzyme activities.
Ž .
were assayed on supernatant fractions: G6PD EC 1.1.1.49 according to Bautista et al.
Ž1988 , ME EC 1.1.1.40 according to Ochoa 1955 and ACoAC EC 6.4.1.2 as per. Ž . Ž . Ž .
Ž . Ž .
Holland et al. 1984 . Enzyme activity units IU defined asmmol substrate converted to
Ž .
product per min at assay temperature 308C , were expressed per mg hepatic soluble
Ž .
protein and per g liver tissue wet weight .
2.6. Flesh quality eÕaluation
Ž .
Sensory profiling Stone et al., 1974; ISO 11035 was performed on cooked fillets by
Ž .
their interest, availability and sensorial capacities of memorising stimuli or discriminat-ing intensities. All were volunteers and received regular traindiscriminat-ing sessions to develop their sensory performances and knowledge of marine products. Sessions were conducted in an air-conditioned room designed for sensory analysis divided into ten individual
Ž .
boxes with standardized light Ts65008K and equipped with a computerised system
ŽFizz, Biosystemes, Dijon . These conditions were conducive to concentration and
`
. Žavoided communication between assessors and disturbance by external factors AFNOR
.
V-09-105, 1995 . The samples with skin were cooked for 2.5 min in a microwave oven
ŽPanasonic NN8550, 850 W in closed bowl before analyses. Products were assigned.
three-digit numbers, randomised and served simultaneously. The samples were evaluated
Ž .
using a continuous scale presented on a computer screen from 0 low intensity to 10
Žhigh intensity for the following attributes: intensity,. ApotatoesB, fat fish, marine-iodine and milky for odour; white colour and fatness for visual aspect; intensity, fatty fish, marine, sweet, acid flavour and bitter aftertaste for flavour; and hardness, elasticity,
Ž .
moisture, fat, exudation and sticky for texture in mouth see Table 7 . The odour attributes were assessed immediately after opening the bowl, while flavour and texture in mouth were evaluated after cutting the samples. The data were immediately trans-ferred by the network to a central computer for statistical processing.
Instrumental colour and texture analysis were performed 7 days after slaughter, on
Ž
fillets kept in ice in sealed vacuum packing and were done on raw and cooked fillets 60
. Ž .
min at 708C in vacuum packing . For texture, a Kramer shear press 64=64 mm was
Ž
used with compression up to breaking using a universal testing machine INSTRON,
.
model 4501 with a load cell of 5 kN and during this test, a constant speed of 1 mmrs into the fillets was adopted. Samples were withdrawn from the caudal part of fish and measured 64 mm long and fillet size in width. The weight of each Kramer sample was
Ž .
recorded to avoid possible size differences Szczesniack et al., 1970 . Instrumental colour analysis of raw or cooked fillets was made on the internal part of the fillet with a
Ž .
chromameter Micro-Color, Dr. Lange using light source D65 and 108 observer angle. Five measurements per fish were made directly on the fillets behind the head to the tail. Data were expressed as L) a) b) system, representing lightness, redness and
yellow-Ž .
ness, respectively, recommended by CIE 1976 . The pH of fillets was measured using a pH meter Metrohm on internal part of fillet. The instrumental analyses followed
Ž .
procedures described by Laroche et al. 1996 .
2.7. Statistical analysis
All data except sensory analysis were subjected to one-way analysis of variance to test the effects of experimental diets. In cases where significant differences occurred
Žsignificance levels0.05 , the means were compared using Newman–Keuls test. The.
Ž .
statistical tests ANOVA and regression were performed using the STAT-ITCF
soft-Ž .
3. Results
3.1. Nutrient and energy digestibility
The ADC of protein was above 95% for all diets, with a low but significant
Ž .
difference between diets Table 2 . ADC of fat was not affected by dietary treatment
ŽP)0.05 but ADC of energy was significantly higher for diets with 15% and 25%.
Ž .
lipid than for the low-fat diet. The digestible protein to digestible energy DPrDE ratios of the four experimental diets decreased from 30.8 to 26.5 mg of DPrkJ of DE
ŽTable 1 ..
3.2. Growth performance
Ž .
There was a decrease in growth with the increase in dietary fat level Table 3 . Fish
Ž .
fed the diet containing 10% lipid had the highest growth performance P-0.05 , significantly higher than those fed diets containing 20% and 25% lipid. Although there
Ž . Ž .
was no difference P)0.05 between groups for feed efficiency FE or protein
Ž .
efficiency ratio PER , the highest values were observed in turbot fed diets with 10% and 15% lipid.
3.3. Whole body and tissue composition and retention
No significant difference was found in whole body moisture, ash and protein content
Ž .
of fish fed the different fat levels Table 4 . Whole body fat content increased significantly from 3.0% to 4.8% when fish were fed diets containing 10% and 25% lipid.
Ž .
HSI and VSI did not vary significantly P)0.05 among treatments and were similar to values of the initial fish. Viscera only represented between 2.5% to 2.7% of body weight.
Ž .
Protein and energy retention as % of intake were lightly affected by the increase in dietary fat level. Protein retention was the highest in fish fed the low-fat diet. Likewise,
Ž .
daily N gain Fig. 1 of turbot tended to decrease with increasing dietary fat levels
Ž .
although without any significant difference P)0.05 between treatments. Lipid gain was high in fish fed the diet containing 25% lipid. In fish fed the low-fat diet, practically no fat deposition was observed.
Table 2
Ž .
Apparent digestibility coefficients ADC % of experimental diets
Ž .
ADC % Experimental diets
10 15 20 25
b a b a
Proteins 95.8"0.0 96.3"0.1 95.8"0.1 96.4"0.2
Fat 94.4"0.6 95.2"0.2 93.2"0.9 93.4"0.6
c a,b b a
Energy 86.1"0.1 90.0"0.4 89.5"0.1 90.6"0.1
Ž .
Values are means"standard deviations ns3 . Values in the same row with different superscripts are
Ž .
Table 3
Growth performance, feed efficiency and protein efficiency ratio in turbot fed gradient levels of fat in isonitrogenous diets over 12 weeks at 178C
Experimental diets
Values are means"standard deviations ns3 except for diet 1 ns2 . Values in the same row with different
Ž .
superscripts are significantly different P-0.05 .
1
IBWsinitial body weight.
2
WGsweight gain.
3 ŽŽ . .
SGR, specific growth rates100= ln FBWyln IBWr84 days .
4
FE, feed efficiencyswet weight gainrdry feed intake.
5
PER, protein efficiency ratioswet weight gainrcrude protein intake.
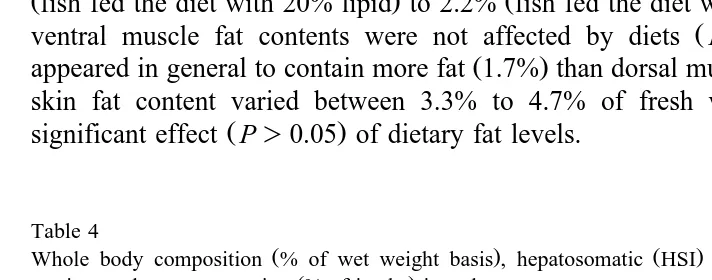
Dry matter and fat contents of liver were significantly higher in turbot fed the 20%
Ž .
lipid diet than in those fed diets containing 10% and 25% lipid Table 5 . Hepatic fat content varied between 12% to 21% of wet weight and was significantly higher in fish fed the 20% lipid diet than in the other groups. Visceral fat content varied between 1.6%
Žfish fed the diet with 20% lipid to 2.2% fish fed the diet with 25% lipid . Dorsal and. Ž .
Ž .
ventral muscle fat contents were not affected by diets P)0.05 . Ventral muscle
Ž . Ž .
appeared in general to contain more fat 1.7% than dorsal muscle 1.1% . The values of skin fat content varied between 3.3% to 4.7% of fresh weight, however, with no
Ž .
significant effect P)0.05 of dietary fat levels.
Table 4
Ž . Ž . Ž .
Whole body composition % of wet weight basis , hepatosomatic HSI and viscerosomatic index VSI ,
Ž .
nutrient and energy retention % of intake in turbot Experimental diets
Values are means"standard deviations ns3 except for diet 1 ns2 . Values in the same row with different
Ž .
Fig. 1. Effects of dietary fat levels on daily whole body protein and lipid gain of turbot.
Table 5
Ž .
Fat content of liver, viscera, dorsal and ventral muscle and skin in turbot % wet weight basis Experimental diets
10 15 20 25
LiÕer
b a,b a b
Moisture 65.7"1.7 64.0"1.5 60.1"1.4 67.0"1.3
b b a b
Fat 13.8"1.9 15.9"1.0 21.1"1.8 12.3"1.2
Viscera
b a,b b a
Moisture 83.7"0.3 83.0"0.2 83.9"0.2 82.7"0.4
a,b a,b b a
Fat 1.9"0.1 2.0"0.1 1.6"0.1 2.2"0.1
Dorsal muscle
Moisture 78.9"0.7 78.5"0.2 78.4"1.3 78.7"0.2
Fat 1.0"0.1 1.1"0.1 1.2"0.1 1.3"0.1
Dorsal skin
Moisture 74.8"1.3 75.8"0.4 75.6"0.7 76.1"0.6
Fat 4.5"1.1 3.7"0.5 3.8"0.8 4.1"0.3
Ventral muscle
Moisture 78.6"0.8 78.0"0.2 78.0"0.4 78.1"0.3
Fat 1.6"0.3 1.6"0.1 1.7"0.3 1.8"0.1
Ventral skin
Moisture 74.7"1.4 75.5"0.4 74.6"0.7 75.9"0.5
Fat 4.7"1.4 3.3"0.5 4.4"1.1 4.2"0.3
Ž .
Values are means"standard deviations ns6 . Values in the same row with different superscripts are
Ž .
Fig. 2. Effect of different fat levels in diets on plasma cholesterol and triglyceride concentrations in turbot.
3.4. Plasma cholesterol and triglyceride concentrations
Plasma total cholesterol and triglyceride concentrations are reported in Fig. 2. Both plasma cholesterol and triglyceride concentrations increased with increasing dietary fat levels. However, only cholesterol concentrations showed a significant difference among
Ž .
the dietary treatment P-0.05 , turbot fed the high lipid diet showing significantly higher values than those found for the other groups.
Table 6
Effects of experimental diets on hepatic lipogenic enzyme activities Experimental diets
10 15 20 25
Glucose-6 phosphate dehydrogenase
b a a,b a,b
IUrg liver 7.03"0.62 9.92"0.90 7.57"0.75 8.04"0.40
b a b b
IUrmg protein 0.22"0.02 0.34"0.02 0.23"0.02 0.27"0.02 Malic enzyme
IUrg liver 1.15"0.10 0.93"0.18 0.79"0.15 0.89"0.05 IUrmg protein 0.05"0.00 0.04"0.01 0.03"0.00 0.04"0.01 Acetyl-CoA carboxylase
mIUrg liver 16.26"1.48 13.32"2.19 16.70"1.87 14.11"1.61 mIUrmg protein 0.36"0.04 0.31"0.08 0.43"0.05 0.36"0.04
Ž .
Values are means"standard deviations ns6 . Values in the same row with different superscripts are
Ž .
Table 7
Sensory analyses of dorsal fillets of turbot
Attributes Diets
10 15 20 25 ANOVA
Odour intensity 5.23 4.86 5.04 4.66 ps0.61
potatoes 2.68 3.21 2.36 2.35 ps0.37
fat fish 2.25 1.95 2.16 2.20 ps0.90
marine-iodine 2.35 1.74 2.41 2.06 ps0.50
milky 1.96 2.36 2.41 2.58 ps0.55
a a b b
Aspect whiteness 3.38 4.29 4.98 5.17 ps0.018
fatness 3.18 3.14 2.39 2.97 ps0.28
Flavour intensity 4.64 4.47 4.71 4.27 ps0.74
fatty fish 2.49 1.98 1.77 1.88 ps0.19
marine 3.51 2.80 3.22 2.95 ps0.38
sweet 1.41 1.08 1.49 1.53 ps0.54
acid 0.46 0.51 0.55 0.25 ps0.36
bitter aftertaste 0.79 0.74 0.76 0.71 ps0.98
Texture in mouth hardness 5.01 4.86 5.16 4.78 ps0.87
elasticity 3.33 3.34 3.35 3.06 ps0.94
moisture 4.25 4.88 3.68 4.45 ps0.19
fat 3.01 2.34 3.25 2.72 ps0.15
a a b b
exudation 3.79 3.64 2.58 3.12 ps0.02
sticky 2.41 2.28 1.87 2.05 ps0.69
Ž .
Values in the same row with different superscripts are significantly different P-0.05 .
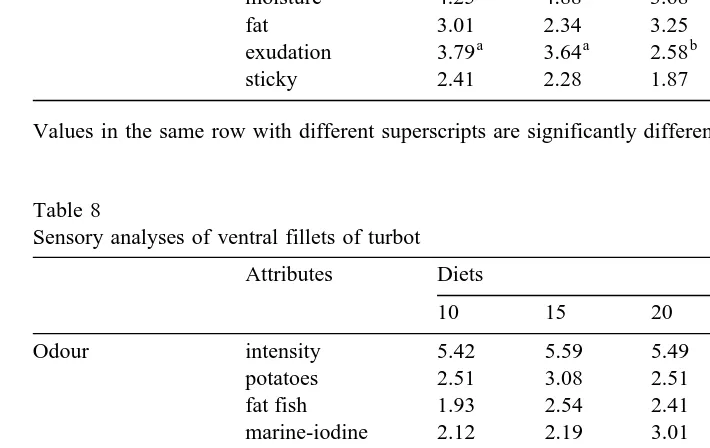
Table 8
Sensory analyses of ventral fillets of turbot
Attributes Diets
10 15 20 25 ANOVA
Odour intensity 5.42 5.59 5.49 5.18 ps0.84
potatoes 2.51 3.08 2.51 2.92 ps0.64
fat fish 1.93 2.54 2.41 1.95 ps0.50
marine-iodine 2.12 2.19 3.01 2.34 ps0.15
milky 2.19 2.24 1.88 2.46 ps0.65
Aspect whiteness 4.12 4.38 3.95 3.99 ps0.89
fatness 3.53 3.40 3.19 3.10 ps0.70
Flavour intensity 3.99 5.09 4.77 3.79 ps0.057
fatty fish 2.28 1.94 2.45 1.99 ps0.43
marine 3.12 3.80 3.84 2.94 ps0.26
b a b a
sweet 0.89 1.83 1.30 1.57 ps0.005
acid 0.44 0.52 0.28 0.29 ps0.11
bitter aftertaste 0.96 0.99 0.38 0.85 ps0.06
Texture in mouth hardness 3.86 4.85 5.06 4.79 ps0.07
elasticity 2.41 3.09 3.32 2.73 ps0.13
moisture 4.45 4.32 3.91 3.64 ps0.25
fat 3.89 2.78 2.57 3.22 ps0.09
exudation 3.75 2.93 2.82 3.00 ps0.16
sticky 2.89 2.95 2.49 2.54 ps0.63
Ž .
3.5. ActiÕities of lipogenic enzymes
Data on the activities of the lipogenic enzymes assayed in turbot liver are reported as
Ž .
IU or mIU of g liver and per mg protein Table 6 . ACoAC and ME had low activities and were not affected by dietary treatment. Only the activities of G6PD showed significant differences with G6DPH activities in fish fed the 15% lipid diet being
Ž .
significantly higher than those in turbot fed the low fat diet P-0.05 .
3.6. Flesh quality
Sensory analyses were realised on ventral and dorsal fillets and the assessors did not find any difference between the dorsal and ventral fillets. On dorsal fillets, visual aspects of white colour appeared higher for groups fed diets rich in lipids than in flesh from fish
Ž .
fed diets low in lipids Table 7 . Fillets from fish fed diets containing 10% and 15% lipid appeared significantly less white than fillets of fish fed diets containing 20% and
Ž .
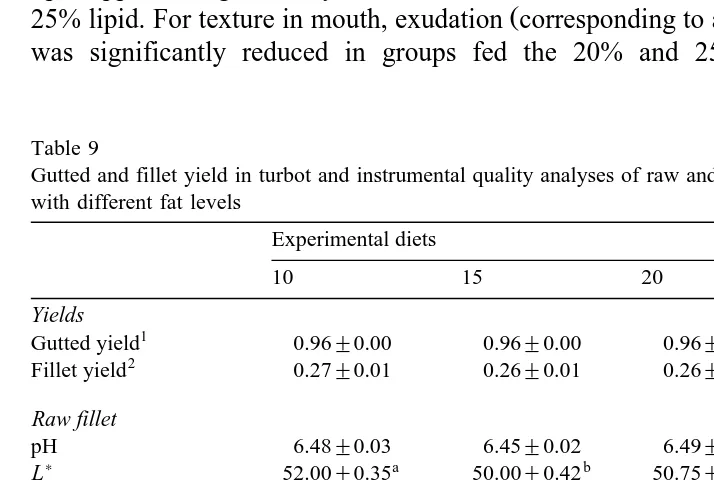
25% lipid. For texture in mouth, exudation corresponding to a loss of water of the fillet was significantly reduced in groups fed the 20% and 25% lipid diets. For other
Table 9
Gutted and fillet yield in turbot and instrumental quality analyses of raw and cooked fillets of turbot fed diets with different fat levels
Experimental diets
10 15 20 25
Yields
1
Gutted yield 0.96"0.00 0.96"0.00 0.96"0.00 0.96"0.00
2
Fillet yield 0.27"0.01 0.26"0.01 0.26"0.01 0.27"0.01 Raw fillet
Maximal force Nrg 66.61"5.48 59.00"2.68 70.43"5.88 70.02"8.54
Ž .
Work mJrg 305.16"16.79 320.02"13.93 329.01"21.36 339.83"31.67
Ž .
Slide force Nrg 5.10"0.35 4.68"0.38 4.65"0.35 5.19"0.42 Cooked fillet
Maximal force Nrg 15.25"0.70 16.05"0.91 15.45"0.96 14.34"0.80
Ž .
Work mJrg 72.22"3.05 85.01"3.50 80.46"4.41 73.90"4.01
Ž .
Slide force Nrg 6.26"0.29 7.28"0.37 6.11"0.42 6.15"0.34
Ž .
Values are means"standard deviations ns8 . Values in the same row with different superscripts are
Ž .
significantly different P-0.05 .
1
Gutted yieldscarcass weightrfish weight.
2
attributes, no effect of dietary treatments was observed on dorsal fillets. On ventral fillets, no significant effect of dietary fat levels was observed except for sweet flavour: fillets from fish fed the 10% and 20% lipid diets were statistically less sweet than fillets
Ž .
from groups fed diets containing 15% and 25% lipid Table 8 . Intensity of flavour appeared more pronounced in fillets of turbot fed the 15% and 20% lipid diets and hardness of texture in mouth was lower in fillets of turbot fed the low-fat diet.
Ž .
Gutted yield in turbot was very high and fillet yield was low -30% with no
Ž .
significant differences among treatments Table 9 . On raw fillets, pH values were not affected by dietary treatment; however, on cooked fillets, pH values of fish fed the 20%
Ž .
lipid diet were significantly lower than those of the other groups P-0.05 . Concerning
) Ž .
colour analyses, L lightness values were significantly influenced by dietary fat levels
) Ž .
on raw and cooked fillets. On cooked fillets, b yellowness values were significantly higher for fish fed diets rich in lipid. No significant effect of dietary fat levels was observed for any of the parameters of instrumental texture analyses on raw or cooked
Ž .
fillets Table 9 .
4. Discussion
Given that high quality protein sources were used, protein digestibility was high
Žabove 95% and comparable to values generally found in other teleosts Cho and. Ž .
Kaushik, 1990; NRC, 1993 . The decantation method was chosen instead of the
Ž .
continuous screen collector Choubert et al., 1982 since preliminary trials had shown that faecal matter from turbot had a tendency to stick to the mesh screens. Nutrient leaching was reduced by the addition of binder in the diets and the losses in the supernatant after centrifugation were unimportant. Using the same method in European
Ž .
seabass, the nitrogen leaching was found to be insignificant Spyridakis et al., 1989 .
Ž .
Data on growth performance of turbot of this size )650 g are comparable to
Ž .
summary data provided by Nijhof 1991 for turbot of similar body weight range. The decline in growth rate with increasing fat levels has already been observed by
Cacerez-Ž . Ž .
Martinez 1984 in juvenile turbot weighing 10 g , fed diets with fat levels ranging
Ž .
from 10% to 20%. However, Danielssen and Hjertnes 1993 reported no adverse effect of fat levels of up to 22% on growth of juvenile turbot. In Atlantic halibut, Berge and
Ž .
Storebakken 1991 did not observe any effect of dietary fat on body weight gain when dietary fat content increased from 8% to 20%. Contrary to many other species like
Ž
salmonids or seabass where a protein sparing has been well demonstrated Lee and Putnam, 1973; Watanabe, 1982; Beamish and Medland, 1986; Cho and Kaushik, 1990;
.
Arzel et al., 1994; Dias et al., 1998 , an increase in dietary lipid levels does not appear to improve protein utilisation in turbot with no clear protein sparing effect of dietary fat.
Ž .
Ž .
Turbot appear to generally have a low whole body fat content -5% , in agreement
Ž .
with the data of Sheehan et al. 1994 . An increase in dietary lipid level, however, led to increased whole body lipid content in turbot, as reported also by Andersen and Alsted
Ž1993. when dietary fat levels increased from 13% to 32%. Such effects are in Ž
agreement with data from other salmonids Arzel et al., 1994; Hillestad and Johnsen,
. Ž
1994; Alvarez et al., 1998 or other marine teleosts, such as seabass Alliot et al., 1979;
. Ž .
Peres and Olivia-Teles, 1999 , gilthead sea bream Vergara et al., 1996; 1999 or
Ž .
Atlantic halibut Aksnes et al., 1996 . Total liver lipid content ranged from 12% to 21% of fresh liver weight in this present study, which was relatively low in comparison with
Ž .
seabass or high in comparison with salmonids Corraze and Kaushik, 1999 . The accumulation of fat in the liver of turbot fed the 20% lipid diet and the relatively poor growth of these fish is difficult to explain and needs further analysis.
Ž .
Muscle fat content in turbot was very low near 1% and comparable to data of Serot
´
Ž .
et al. 1998 in farmed turbot of 1 kg. The latter study reported that compared to wild
Ž .
fish of similar body weight, cultured fish muscle contain more fat 1.1% vs. 0.6% . In this present study, skin fat content was around 4% of wet weight, showing that turbot accumulate a part of the fat under the skin. The weight of liver, viscera, muscle and skin only represented about 40% of body weight. If the values of previous tissue fat content
Žcf. Table 5 were reported in terms of body weight, this study showed that turbot.
Ž .
accumulated a significant amount estimated around 2r3 of fat in the rest of carcass
Žbones, fins, head, etc. ..
Tissue cholesterol concentrations are known to vary depending upon the nutritional
Ž .
status of fish Fremont and Leger, 1981; Kennish et al., 1992; Kaushik et al., 1995 .
´
Plasma cholesterol concentrations observed here increased with an increase of dietary fat
Ž .
and were low compared to other species Alexis et al., 1985; Kaushik et al., 1995 , but higher than those observed in juvenile turbot fed a fish meal diet in a previous study
ŽRegost et al., 1999 ..
Ž
The preferential site of de novo fatty acid synthesis in fish is the hepatic tissue Lin et
.
al., 1977a,b; Sargent et al., 1989 . With respect to the two NADPH-generating enzymes, the activity of G6PD was nearly 10 times higher than that of ME in turbot, in
Ž
accordance with data from other finfish Iritani et al., 1984; Bautista et al., 1988; Dias et
.
al., 1998 . The activities of G6PD, ME and ACoAC observed in the present study were
Ž
lower than those reported for rainbow trout and seabass Alvarez et al., 1998; Dias et al.,
.
1998 . In most teleosts studied to date, G6PD, ME and fatty acid synthetase activities decrease with an increase in dietary lipid level and a concurrent decrease in dietary
Ž
carbohydrate Likimani and Wilson, 1982; Arnesen et al., 1993; Shimeno et al., 1995;
.
Alvarez et al., 1998; Dias et al., 1998 . The absence of any change in hepatic lipogenic enzymes studied here possibly reflect the high protein requirements, low lipid deposition and the relative absence of response to high dietary lipids of turbot. In rats, it is known
Ž .
that even a slight increase in the order of 3% in dietary fat reduces the activity of these
Ž .
enzymes Kelley et al., 1987 , whereas in other teleosts, such a reduction occurs only
Ž .
Ž .
low growth rates in big fish. In rainbow trout, Walzem et al. 1991 have indeed shown that liver enzyme activities were correlated with food intake and growth.
Relatively few studies have dealt with flesh quality in turbot farmed under controlled conditions. One of the striking features, despite a high gutted yield, was the poor fillet
Ž .
yield -30% in turbot of this size compared to salmonids where it is not uncommon to
Ž . Ž .
have yields above 50% Einen et al., 1998 . Aksnes et al. 1996 in Atlantic halibut
Ž .
found that high dietary lipid level 13% to 32% affected slaughter quality increasing the entrails index and decreasing the slaughter yield. Such a change was not found in turbot where visceral fat depositions were low. In fact, VSI were also low in turbot compared
Ž
to other teleosts Fauconneau, 1988; Ballestrazzi et al., 1994; Oliva-Teles et al., 1994;
. Ž .
Dias et al., 1998 . The relatively low near 1% HSI in turbot found here has been
Ž . Ž
reported earlier in turbot Cacerez-Martinez, 1984 and in Atlantic halibut Aksnes et al.,
.
1996; Helland and Grisdale-Helland, 1998 . These values are much lower than those
Žaround 2.3% reported for other marine species, such as European seabass Ballestrazzi. Ž
. Ž .
et al., 1994; Dias et al., 1998 or red sea bream Takeuchi et al., 1991 . Sensory attributes of turbot were not affected by dietary fat level except whiteness; this was also confirmed by instrumental colour analysis. There was also no relation between sensory descriptors of fat and muscle fat level probably due to the low fat content in turbot
Ž .
muscle. The methods to cook fillets were different in sensory analyses microwave and
Ž . Ž .
in instrumental analyses double boiler . According to Madeira and Penfield 1985 , no
Ž
difference in acceptability of Greenland turbot heated by two cooking methods
conven-.
tional oven and microwave oven was observed. The values obtained in instrumental texture analyses in turbot showed that texture of turbot fillet was firm in comparison to
Ž .
salmonids Laroche et al., 1996 . Given the scarcity of data from the literature, it is difficult to draw generalised conclusions in this regard.
In conclusion, this present study under controlled conditions with a wide range of
Ž .
dietary fat levels confirms that high dietary lipid levels above 15% do not bring about any clear protein sparing effect in turbot. Fat deposition in turbot was localised under the skin and in the carcass. The low hepatic lipogenic activities and poor fat utilisation in turbot needs further investigation. Given that diets for turbot are rich in protein and that they do not seem to benefit from dietary lipid, it would be worth investigating how far dietary protein levels or carbohydrates can affect changes in lipid metabolism.
Acknowledgements
Ž .
This study was supported by the project with the Nutreco ARC Stavanger, Norway . The authors would like to express their gratitude to Herve Le Delliou for his technical
´
assistance for proximate analysis. C. Regost is a recipient of a partial financial scholarship from Region Bretagne.
´
References
Ž
AFNOR, 1995. Directives generales pour l’implantation de locaux destines a l’analyse sensorielle NF V´ ´ ´ ` .
09-105 . Controle de la Qualite des Produits Alimentaires, Analyse Sensorielle, 5eme edition AFNOR,ˆ ´ ` ´
Ž .
AOAC Association of Official Analytical Chemists , 1984. Official Methods of Analysis. 12th edn. Association of Official Analytical Chemists, Washington DC, USA, 1141 pp.
Aksnes, A., Hjertnes, T., Opstvedt, J., 1996. Effect of dietary protein level on growth and carcass composition
Ž .
in Atlantic halibut Hippoglossus hippoglossus L. . Aquaculture 145, 225–233.
Alexis, M.N., Papaparaskev-Papoutsoglou, E., Theochari, V., 1985. Formulation of practical diets for rainbow
Ž .
trout Salmo gairdneri made by partial or complete substitution of fish meal by poultry by-products and certain plant by-products. Aquaculture 50, 61–73.
Alliot, E., Pastoureaud, A., Nedellec, J., 1979. Etude de l’apport calorique et du rapport calorico-azote dans´
l’alimentation du bar Dicentrarchus labrax. Influence sur la croissance et la composition corporelle. In:
Ž .
Halver, J.E., Tiews, K. Eds. , Proc. World Symp. on Finfish Nutrition and Fishfeed Technology, Hamburg, Germany, vol. I. Heenemann, Berlin, pp. 241–255.
Alvarez, M.J., Lopez-Bote, C.J., Diez, A., Corraze, G., Arzel, J., Dias, J., Kaushik, S.J., Bautista, J.M., 1998. Dietary fish oil and digestible protein modify susceptibility to lipid peroxidation in the muscle of rainbow
Ž . Ž .
trout Oncorhynchus mykiss and sea bass Dicentrarchus labrax . Br. J. Nutr. 80, 281–289.
Ž .
Andersen, N.G., Alsted, N.S., 1993. Growth and body composition of turbot Scophthalmus maximus in
Ž .
relation to different lipidrprotein ratios in the diet. In: Kaushik, S.J., Luquet, P. Eds. , Fish Nutrition in Practice, Biarritz, France, INRA Editions. Les Colloques NO. 61, pp. 479–491.
Arnesen, P., Krogdahl, A., Kristiansen, I.O., 1993. Lipogenic enzyme activities in liver of Atlantic salmon
ŽSalmo salar . Comp. Biochem. Physiol. 105B, 541–546..
Arzel, J., Martinez Lopez, F.X., Metailler, R., Stephan, G., Viau, M., Gandemer, G., Guillaume, J., 1994.´ ´
Ž .
Effect of dietary lipid on growth performance and body composition of brown trout Salmo trutta reared in seawater. Aquaculture 123, 361–375.
Austreng, E., Krogdahl, A., 1987. Food quality of cultured salmonids can be influenced. Feedstuffs 59, 12–14. Ballestrazzi, R., Lanari, D., D’Agaro, E., Mion, A., 1994. The effect of dietary protein level and source on
Ž
growth, body composition, total ammonia and reactive phosphate excretion of growing sea bass
Di-.
centrarchus labrax . Aquaculture 127, 197–206.
Bautista, J.M., Garrido-Pertierra, A., Soler, G., 1988. Glucose-6-phosphate dehydrogenase from Dicentrar-chus labrax liver: kinetic mechanism and kinetic of NADPH inhibition. Biochim. Biophys. Acta 967, 354–363.
Beamish, F.W.H., Medland, T.E., 1986. Protein sparing effects in large rainbow trout, Salmo gairdneri. Aquaculture 55, 35–42.
Berge, G.M., Storebakken, T., 1991. Effect of dietary fat level on weight gain, digestibility, and fillet composition of Atlantic halibut. Aquaculture 99, 331–338.
Bjerkeng, B., Refstie, S., Fjalestad, K.T., Storebakken, T., Rødbotten, M., Roem, A.J., 1997. Quality
Ž .
parameters of the flesh of Atlantic salmon Salmo salar as affected by dietary fat content and full-fat soybean meal as a partial substitute for fish meal in the diet. Aquaculture 157, 297–309.
Boggio, S.M., Hardy, W.H., Babbitt, J.K., Brannon, E.L., 1985. The influence of dietary lipid source and
Ž .
alpha-tocopheryl acetate level on product quality of rainbow trout Salmo gairdneri . Aquaculture 51, 13–24.
Bradford, M.M., 1976. A rapid and sensitive method for the quantitation of microgram quantities of protein
Ž .
utilizing the principle of protein-dye binding. Anal. Biochem. 72 2 , 248–254.
Ž .
Cacerez-Martinez, C., 1984. Etudes sur les besoins nutritionnels de la sole SoleaÕulgaris et du turbot
ŽPsetta maxima . These de Doctorat, Universite de Bretagne Occidentale, Brest, France, 132 pp.. ` ´ Ž
Cacerez-Martinez, C., Cadena-Roa, M., Metailler, R., 1984. Nutritional requirements of turbot Scophthalmus´ .
maximus : I. A preliminary study of protein and lipid utilization. J. World Maric. Soc. 15, 191–202. Cho, C.Y., Kaushik, S.J., 1990. Nutritional energetics in fish: protein and energy utilization in rainbow trout.
Ž .
In: Bourne, G.H. Ed. , Aspects of Food Production, Consumption and Energy Values. World Rev. Anim. Nutr., vol. 61, pp. 132–172.
Cho, C.Y., Slinger, S.J., Bayley, H.S., 1982. Bioenergetics of salmonids fishes: energy intake expenditure and productivity. Comp. Biochem. Physiol. 73B, 25–41.
Choubert, G., De la Noue, J., Luquet, P., 1982. Digestibility in fish: improve device for the automatic collection of feces. Aquaculture 29, 185–189.
Ž .
Corraze, G., Kaushik, S.J., 1999. Les lipides des poissons marins et d’eau douce. OCL: Ol. Corps Gras, Lipides 6, 111–115.
Ž
Danielssen, D.S., Hjertnes, T., 1993. Effect of dietary protein levels in diets for turbot Scophthalmus
. Ž .
maximus to market size. In: Kaushik, S.J., Luquet, P. Eds. , Fish Nutrition in Practice, Biarritz, France, 24-27r06r1991, INRA Editions. Les Colloques no. 61, pp. 89–96.
Dias, J., Alvarez, M.J., Diez, A., Arzel, J., Corraze, G., Bautista, J.M., Kaushik, S.J., 1998. Regulation of
Ž .
hepatic lipogenesis by dietary proteinrenergy in juvenile European seabass Dicentrarchus labrax . Aquaculture 161, 169–186.
Ž .
Einen, O., Thomassen, M.S., 1998. Starvation prior to slaughter in Atlantic salmon Salmo salar : II. White muscle composition and evaluation of freshness, texture and colour characteristics in raw and cooked fillets. Aquaculture 169, 37–53.
Ž
Einen, O., Waagen, B., Thomassen, M.S., 1998. Starvation prior to slaughter in Atlantic salmon Salmo
.
salar : I. Effects on weight loss, body shape, slaughter and fillet-yield, proximate and fatty acid composition. Aquaculture 166, 85–104.
Fauconneau, B., 1988. Partial substitution of protein by single amino acid or an organic acid in rainbow trout diets. Aquaculture 70, 97–106.
Fauconneau, B., Chmaitilly, J., Andre, S., Cardinal, M., Cornet, J., Vallet, J.L., Dumont, J.P., Laroche, M., 1993. Caracteristiques de la chair de truite arc en ciel: II. Composantes physiques et sensorielles. Sci.´
Alim. 13, 188–199.
Folch, J., Lees, M., Sloane Stanley, G.H., 1957. A simple method for the isolation and purification of total lipides from animal tissues. J. Biol. Chem. 226, 497–509.
Ž .
Fremont, L., Leger, C., 1981. Le transport des lipides plasmatiques. In: Fontaine, M. Ed. , Nutrition des´
Poissons, Editions du Centre National de la Recherche Scientifique, Paris, pp. 263–282. Gjedrem, T., 1997. Flesh quality improvement in fish through breeding. Aquacult. Int. 5, 197–206. Guillaume, J., Arzel, J., Stephan, G., Fauconneau, B., 1996. Lipides et qualite de la chair de poisson. In:´
Ž .
Gandemer, G. Ed. , Lipides et Qualite des Aliments d’Origine Animale, Journees Chevreul, Nantes,´ ´
France, 5–6 Nov. 1996, pp. 47–59.
Guillou, A., Soucy, P., Khalil, M., Adambounou, L., 1995. Effects of dietary vegetable and marine lipid on
Ž
growth, muscle fatty acid composition and organoleptic quality of flesh of brook charr SalÕelinus
.
fontinalis . Aquaculture 136, 351–362.
Helland, S.J., Grisdale-Helland, B., 1998. Growth, feed utilization and body composition of juvenile Atlantic
Ž .
halibut Hippoglossus hippoglossus fed diets differing in the ratio between the macronutrients. Aquacul-ture 166, 49–56.
Hillestad, M., Johnsen, F., 1994. High-energyrlow protein diets for Atlantic salmon: effects on growth, nutrient retention and slaughter quality. Aquaculture 124, 109–116.
Holland, R., Witters, L.A., Hardie, D.G., 1984. Glucagon inhibits fatty acid synthetis in isolated hepatocytes via phosphorylation of acetyl CoA carboxylase by cyclic AMP-dependent protein kinase. Eur. J. Biochem. 140, 325–333.
Iritani, N., Ikeda, Y., Fukuda, H., Katsurada, A., 1984. Comparative study of lipogenic enzymes in several vertebrates. Lipids 19, 828–835.
ITCF, 1988. STAT-ITCF. 4 eme ed Service des Etudes Statistiques, Paris, France.` ´
Juaneda, P., Rocquelin, G., 1985. Rapid and convenient separation of phospholipids and non phosphorus lipids from rat heart using silica cartridges. Lipids 20, 40–41.
Kaushik, S.J., Cravedi, J.P., Lalles, J.P., Sumpter, J., Fauconneau, B., Laroche, M., 1995. Partial or total replacement of fish meal by soya protein on growth, protein utilization, potential estrogenic or antigenic effects, cholesterolemia and flesh quality in rainbow trout. Aquaculture 133, 257–274.
Kelley, D.S., Nelson, G.J., Serrato, C.M., Schimdt, P.C., 1987. Nutritional regulation of hepatic lipogenesis in the rat. Nutr. Res. 7, 509–517.
Kennish, J.M., Sharpdahl, J.L., Chambers, K.A., Thrower, F., Rice, S.D., 1992. The effect of a herring diet on lipid composition, fatty acid composition, and cholesterol levels in muscle tissue of pen-reared chinook
Ž .
salmon Oncorhynchus tshawytscha . Aquaculture 108, 309–322.
Klor, H., Hauenschild, A., Holbach, I., Kretschmer, H., Stroh, S., 1997. Nutrition and cardiovascular disease. Eur. J. Med. Res. 2, 243–257.
Ž
. Ž . Ž
congelation sur des caracteristiques de texture de filets de truite fario Salmo trutta et de carpe Cyprinus´ ´ .
carpio .AFroid et AquacultureB, Comptes rendus Reunion de la Commission C2 de l’Institut International´
du Froid, Bordeaux, France, 20–22 mars 1996, pp. 393–400.
Lee, D.J., Putnam, G.B., 1973. The response of rainbow trout to varying proteinrenergy ratios in a test diet. J. Nutr. 103, 916–922.
Lie, O., 1997. Fish nutrition and product quality. 16th International Congres of Nutrition, Montreal, Canada, August 1997, 4 pp.
Likimani, T.A., Wilson, R.P., 1982. Effects of diet on lipogenic enzyme activities in channel catfish hepatic and adipose tissue. J. Nutr. 112, 112–117.
Lin, H., Romsos, D.R., Tack, P.I., Leveille, G.A., 1977a. Influence of dietary lipid on lipogenic enzyme
Ž .
activities in coho salmon Oncorhynchus kisutch . J. Nutr. 107, 846–854.
Lin, H., Romsos, D.R., Tack, P.I., Leveille, G.A., 1977b. Effects of fasting and feeding various diets on
Ž .
hepatic lipogenic enzyme activities in coho salmon Oncorhynchus kisutch . J. Nutr. 107, 1477–1483. Madeira, K., Penfield, M.P., 1985. Turbot fillet sections cooked by microwave and conventional heating
methods: objective and sensory evaluation. J. Food Sci. 50, 172–173.
Mambrini, M., Roem, A., Cravedi, J.P., Lalles, J.P., Kaushik, S.J., 1999. Effects of replacing fishmeal by soy protein concentrate and ofDL-methionine supplementation in high energy extruded diets on growth and nutrient utilisation in rainbow trout, Oncorhynchus mykiss. J. Anim. Sci. 77, 2990–2999.
Ž .
National Research Council NRC , 1993. Nutrient Requirements of Fish. National Academy Press, Washing-ton, DC, 114 pp.
Nettleton, J.A., 1991. w-3 Fatty acids: comparison of plant and seafood sources in human nutrition. J. Am. Diet. Assoc. 91, 331–337.
Ž .
Nijhof, M., 1991. Effects of body weight on diet requirements of turbot Scophthalmus maximus with special
Ž .
reference to feed intake and body composition. In: Kaushik, S.J., Luquet, P. Eds. , Fish Nutrition in Practice, Ed INRA, Les colloques, no. 61, pp. 501–513.
Nortvedt, R., Tuene, S., 1998. Body composition and sensory assessment of three weight groups of Atlantic
Ž .
halibut Hippoglossus hippoglossus fed three pellet sizes and three dietary fat levels. Aquaculture 161, 295–313.
Ž .
Ochoa, S., 1955. Malic enzyme. In: Collowick, S.P., Kaplan, N.O. Eds. , Methods in Enzymology, vol. 1. Academic Press, New York, pp. 739–753.
Oliva-Teles, A., Gouveia, A.J., Gomes, E., Rema, P., 1994. The effect of different processing treatments on soybean meal utilization by rainbow trout, Oncorhynchus mykiss. Aquaculture 124, 343–349.
Peres, H., Oliva-Teles, A., 1999. Effect of dietary lipid level on growth performance and feed utilisation by
Ž .
European sea bass juveniles Dicentrarchus labrax . Aquaculture 179, 325–334.
Piclet, G., 1987. Le poisson aliment. Composition-interet nutritionnel. Cah. Nutr. Diet., 317–336.´ ˆ
Prost, C., Serot, T., Demaimay, M., 1998. Identification of the most potent odorants in wild and farmed´
Ž .
cooked turbot Scophtalmus maximus . J. Agric. Food Chem. 46, 3214–3219.
Regost, C., Arzel, J., Kaushik, S.J., 1999. Partial or total replacement of fish meal by corn gluten meal in diets
Ž .
for turbot Psetta maxima . Aquaculture 180, 99–117.
Ž .
Sargent, J., Henderson, R.J., Tocher, D.R., 1989. The lipids. In: Halver, J.E. Ed. , Fish Nutrition. Academic Press, San Diego, pp. 153–218.
Serot, T., Gandemer, G., Demaimay, M., 1998. Lipid and fatty acid compositions of muscle from farmed and´
wild adult turbot. Aquacult. Int. 6, 331–343.
Sheehan, E.M., Sheehy, P.J.A., Morrissey, P.A., Fitzgerald, R., 1994. Compositional analysis on wild and
Ž .
farmed turbot, and fish feeds in Ireland. In: Lavens, P., Remmerswaal, R.A.M. Eds. , Turbot Culture: Problems and Prospects. European Aquaculture Society No. 22, Gent, Belgium, pp. 302–311.
Shimeno, S., Keyyali, D., Shikata, T., 1995. Metabolic response to dietary lipid to protein ratios in common carp. Fish. Sci. 61, 977–980.
Spyridakis, P., Metailler, R., Gabaudan, J., Riaza, A., 1989. Studies on nutrient digestibility in European sea´
Ž .
bass Dicentrarchus labrax : 1. Methodological aspects concerning faeces collection. Aquaculture 77, 61–70.
Stone, H., Sidel, J.L., Oliver, S., Woolsey, A., Singleton, R.C., 1974. Sensory evaluation by quantitative
Ž .
descriptive analysis. Food Technol. 28 11 , 24–34.
compression cell of the shear press and the effect of sample weight on peak area and maximum force. Texture Stud. 1, 356–378.
Takeuchi, T., Shiina, Y., Watanabe, T., 1991. Suitable protein and lipid levels in diet for fingerlings of red sea
Ž .
bream Pagrus major . Nippon Suisan Gakkaishi 57, 293–299.
Vergara, J.M., Robaina, L., Izquierdo, M., de la Higuera, M., 1996. Protein sparing effect of lipids in diets for fingerlings of gilthead sea bream. Fish. Sci. 62, 624–628.
Vergara, J.M., Lopez-Calero, G., Robaina, L., Caballero, M.J., Montero, D., Izquierdo, M.S., Aksnes, A.,
Ž .
1999. Growth, feed utilization and body lipid content of gilthead seabream Sparus aurata fed increasing lipid levels and fish meals of different quality. Aquaculture 179, 35–44.
Watanabe, T., 1982. Lipid nutrition in fish. Comp. Biochem. Physiol. 73B, 3–15.