THE PHIL-LIDAR 2 PROGRAM: NATIONAL RESOURCE INVENTORY OF THE
PHILIPPINES USING LIDAR AND OTHER REMOTELY SENSED DATA
A.C. Blanco a, *, A.M. Tamondong a, A.M.C. Perez a, M.R.C.O. Ang a, E.C. Paringit a a
Department of Geodetic Engineering and Training Center for Applied Geodesy and Photogrammetry University of the Philippines, Diliman, Quezon City, Philippines
[email protected]; [email protected]
KEY WORDS: LiDAR, agriculture, forest, hydrology, renewable energy, coastal resources
ABSTRACT:
The Philippines embarked on a nationwide mapping endeavour through the Disaster Risk and Exposure Assessment for Mitigation (DREAM) Program of the University of the Philippines and the Department of Science and Technology (DOST). The derived accurate digital terrain models (DTMs) are used in flood models to generate risk maps and early warning system. With the availability of LiDAR data sets, the Phil-LiDAR 2 program was conceptualized as complementary to existing programs of various national government agencies and to assist local government units. Phil-LiDAR 2 aims to provide an updated natural resource inventory as detailed as possible using LiDAR point clouds, LiDAR derivative products, orthoimages and other RS data. The program assesses the following natural resources over a period of three years from July 2014: agricultural, forest, coastal, water, and renewable energy. To date, methodologies for extracting features from LiDAR data sets have been developed. The methodologies are based on a combination of object-based image analysis, pixel-based image analysis, optimization of feature selection and parameter values, and field surveys. One of the features of the Phil-LiDAR 2 program is the involvement of fifteen (15) universities throughout the country. Most of these do not have prior experience in remote sensing and mapping. With such, the program has embarked on a massive training and mentoring program. The program is producing more than 200 young RS specialists who are protecting the environment through RS and other geospatial technologies. This paper presents the program, the methodologies so far developed, and the sample outputs.
* Corresponding author.
1. INTRODUCTION
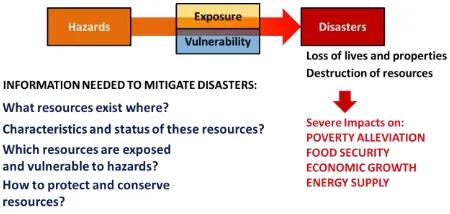
The Philippines is an archipelago with an area of around 300,000 km2. The country is rich in natural resources, both terrestrial and coastal marine. However, the inventory of these resources throughout the country is too variable, with some area well surveyed and mapped, while other have very general assessment and mapping done many years ago. With increasing pressures due to a rapidly growing population coupled with natural disturbances exacerbated by climate change, a detailed and up to date inventory of the natural resources is warranted. This will address the data and information gaps in natural resource assessment (Figure 1). It is also critical to know how the natural resources are impacted by hazards, which areas are exposed to these hazards and how vulnerable these resources are to anthropogenic and natural disturbances.
Figure 1. Data and information gaps in natural resource assessment and DRRM
2. THE PHIL-LIDAR 2 PROGRAM
2.1 Program Overview and Objectives
The Phil-LiDAR 2 Program is a 3-year program funded by the Philippines’ Department of Science and Technology (DOST) to provide detailed resource inventory using LiDAR and other remotely sensed data. This program started in July 2014 with the University of the Philippines Diliman (UPD), through its Training Center for Applied Geodesy and Photogrammetry, leading fourteen (14) other State Universities and Colleges (SUCs) and Higher Educational Institutes (HEIs) throughout the Philippines. The program is tasked to map the following resources for the entire Philippines: agricultural, forest, coastal, water, and renewable energy.
The program has the following objectives:
a. To complement on-going programs of government agencies (e.g. Department of Agriculture, Department of Environment and Natural Resources, Department of Energy) by utilizing LIDAR data;
b. To develop methodologies for extracting resource features from LiDAR and other RS data for various applications: production of high value crops, irrigation assessment, coastal resource conservation; aquaculture production, forest protection, and discovery of renewable energy sources;
c. Produce high-resolution national resource maps; d. Produce vulnerability assessment maps for high-value
e. Formulate recommendations to help address future local supply and demand in agriculture, coastal, forest, and renewable resources.
2.2 Structure of the Program
The Phil-LiDAR 2 Program at UPD is composed of five (5) projects as shown in Figure 2 and listed below:
a. Project 1. Agricultural Resources Assessment using LIDAR (PARMap)
b. Project 2. Coastal Resources Assessment using LIDAR (CoastMap)
c. Project 3. Forest Resources Assessment using LIDAR (FRExLS)
d. Project 4. Development of the Philippine Hydrologic Datasets (PHD) for Watersheds using LIDAR e. Project 5. Renewable Energy Resources Mapping
(REMaps) using LIDAR
Pertinent workflows and algorithms are developed by each of these projects. These include the methodologies for the following:
a. Agricultural land cover and land use mapping using LiDAR and other RS data,
b. Benthic cover (corals, seagrass, macroalgae), mangrove, aquaculture and mariculture mapping, c. Forest cover, canopy height, biomass, carbon stock
assessment,
d. Extraction of various hydrological features and establishment of the Philippine Hydrologic Dataset, e. Assessment of biomass, hydropower, solar energy,
and wind energy at national and urban scales.
These workflows are then cascaded to the participating SUCs and HEIs through a suit of training and mentoring sessions conducted by UPD. The UP TCAGP is also responsible for coordinating with national government agencies (NGAs) to ensure complementarity with existing programs, minimize duplication of mapping efforts, secure secondary data, and undertake collaborative activities. Selected NGA staff members are part of the program for training and mentoring to ensure smooth transition from program-level to NGA-level implementation.
Figure 2. The Phil-LiDAR 2 Program Structure
The SUCs and HEIs are clustered into three (Luzon, Visayas, Mindanao) following the major island groupings of the Philippines. These universities are tasked with implementing
the methodologies for assigned areas (see Figure 3) and resources, introducing enhancements to improve the results of the mapping process considering local conditions (e.g., crop types, topography, data availability, etc.), and performing first-level accuracy assessments. Proper coordination with local government units (LGUs) and regional offices of DOST and partner institutions is carried out by these universities.
Figure 3. The Phil-LiDAR 2 implementing institutions and their respective assigned provinces and regions of the Philippines
2.3 Training, Mentoring, and Colloquia
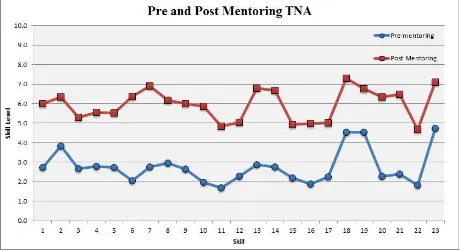
Trainings on basic remote sensing and digital image analysis were first conducted while resource-specific workflows were being developed. Training needs assessment was conducted before and after the trainings. Knowledge and skills on various image processing phases as well as GIS were self-evaluated by the research assistants (RAs) using a scale of 1 (lowest) to 10 (highest). Most of the RAs have rated themselves low considering that their academic preparation did not included remote sensing and GIS courses. This was significantly improved (from an average of 3 to 6) with the first round of basic training conducted at each university (Figure 4).
Figure 4. Self-evaluation of knowledge and skills in remote sensing and GIS before and after the training and mentoring
sessions
that workflows are properly implemented, the UPD Project Leaders and RAs visited each university to mentor and monitor the progress of each project.
In addition to the training and mentoring sessions, program-wide and per cluster colloquia are held twice a year and every two to three months, respectively. These serve as venues to present results obtained by implementing the workflows, the enhancements made such as using additional LiDAR derivative layers, and to share and select best practices not only in data processing but also in field validation.
3. METHODOLOGIES
This section briefly describes the resource mapping methodologies for the five resource types and some preliminary outputs.
3.1 Agricultural Resource Mapping
A multi-level approach in agricultural land cover is implemented by the Phil-LiDAR 2 PARMap Project. This project maps agricultural resources (e.g., various crop types) in detail for the entire Philippines using LiDAR and other remotely sensed data. However, it is recognized that phenology and crop rotation plays a major role in agriculture and to be able to provide a more comprehensive assessment, agricultural land use must be determined using multi-temporal and multi-type data. It is essential to provide information on how agricultural resources change over time (e.g., within a year). Agricultural land use in this case indicates the type of crop and growth stage on a per month basis. Such information is critical for providing a more reliable inventory and offers the possibility for improved damage assessment in case of exposure to hazards such as floods, drought, and salinity intrusion. Detailed crop mapping is carried out using LiDAR and orthophoto data using object-based image analysis and support vector machine (SVM). Bare and fallow areas as well as crops planted at different dates and in these bare, fallow, and other areas are determined using Landsat 8 images. SVM is applied to Landsat images using a pixel-based approach.
Figure 5. Agricultural land cover map produced using OBIA and SVM on LiDAR data and orthoimage.
Accuracy assessment indicates considerably high accuracy (>90%) of crop classification using SVM on LiDAR and Landsat images. Information on phenology and crop rotation is obtained from MODIS EVI and NDVI time series images. Prior
to the extraction of this information, reprojection and filtering using the Savitzky-Golay filter were carried out. This combination of LiDAR data and derivatives (from point clouds, nDSM, and CHM), multi-temporal Landsat images and long-term MODIS data forms would enable the generation of agricultural land use layers.
Figure 6 shows an example of a detailed agricultural cover map indicating the distribution of corn, mango, rice, and other features in Concepcion, Tarlac. Note the detailed delineation of agricultural crops in a map generated from LiDAR data set compared to the national land cover layer of 2010.
Figure 6. Detailed agricultural land cover (top image) and the corresponding portion taken from the NAMRIA land cover map
dated 2010.
3.2 Coastal Resource Mapping
Table 1 lists the various workflows developed for mapping benthic habitats, aquaculture, and mangroves. Figure 7 shows an example of output from Worldview images.
Coastal Habitat Mapping of High Resolution Images (WorldView-2) and Digital Elevation Model using Object-Based Image Analysis
Object-based Image Analysis for Benthic Habitat Mapping using LiDAR Derivatives
Aquaculture
Aquaculture Mapping of Fish Cages, Fish Pens and Fish Ponds Using LiDAR Technology and its Derivatives
Integration of LiDAR and WorldView-2 Image for the Extraction of Coastal Aquaculture Features (Fish Ponds, Fish Pens, Fish Cages Extraction) Using Object-oriented Approach
Mangroves
Extraction of Mangroves From High Resolution Multispectral Imagery and LiDAR Using Object-based Classification
Figure 7. Benthic habitat map derived from Worldview image
3.3 Forest Resource Mapping
The primary products of the FRExLS are canopy height map, canopy closure/canopy gap map, tree map (automatic delineation of tree crowns), and above ground biomass map. On the other hand, the following secondary parameters will be utilized for distinguishing between forest types:
a. Canopy Height (Mean and Maximum) (see Figure 8) b. Canopy Closure and Density (Mean Percentage) c. Vertical Distribution of Points (Point Spacing &
Point Density Height Bins)
d. Vegetation Points (Number of Points under Low, Medium, High Vegetation)
e. Point Intensity
f. Mean DBH, Crown Diameter, Average Number of trees and Mean Biomass (field data needed)
Figure 8. 3D view of the canoy height model of an area in Maipalig, Ilocos Norte, Philippines.
3.4 Hydrologic Dataset
The Philippines is composed of a wide variety of natural and man-made water resources including lakes, ponds, wetlands, marshes, dams and river networks stretching to hundreds of kilometers throughout the country. According to the National Water Resources Council (NWRC), there are in fact 421 principal river basins in the country with catchment areas ranging from 40 to 25,469 square kilometers, and 18 of which are considered as major river basins [DPWH & JICA, 2003]. Having this vast amount of resources, the first step in proper
water management is knowing the extent and state of all available aquatic resources. Compiling all important information about the hydrology in the Philippines into a single repository do only guarantee that proper accuracy standards are maintained, but as well avoids the duplication of efforts in terms of data gathering and updating. Applications requiring updated national hydrologic datasets, such as flood control planning, groundwater monitoring, sedimentation, power generation, discharge and runoff studies, are ensured to provide consistent results that can be integrated with other datasets.
Towards the objective of creating a national hydrologic dataset, workflows have been developed to automatically extract hydrologic features using LiDAR DEMs, images and other data. Figure 9 details the workflow for extracting drainage canals from LiDAR data while Figure 10 shows the results (i.e., delineated ditches).
Figure 10. Delineated agricultural ditches
3.5 Renewable Energy Assessment
Among the potential alternative sources of energy are from renewables such as wind, solar, hydropower and biomass. The Department of Energy has identified potential sites as well as potential theoretical capacity for these RE resource. With the advent of new geospatial technologies such as LiDAR coupled with updated datasets, a more refined and localized resource assessment can be done to complement or even enhance previous assessments. Moreover, site suitability assessment considering different factors can be done in a Geographic Information System (GIS) to identify potential sites for the development of these RE resources.
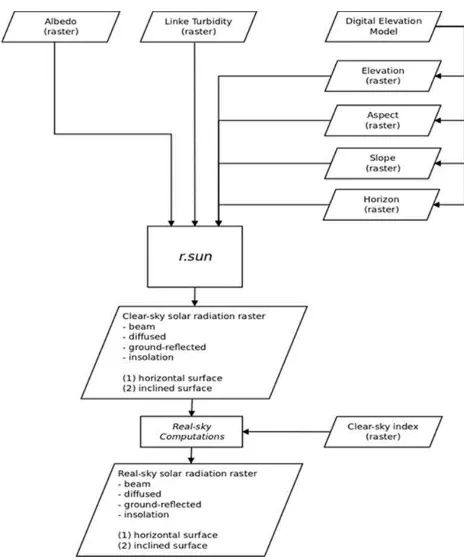
Figure 11 and 12 shows the process flow for the assessment of solar energy and hydropower.
Figure 11. Workflow for solar energy resource assessment using LiDAR DEM
Figure 12. Workflow for hydropower resource assessment using LiDAR DEM
4. SUMMARY AND CONCLUSION
With the enormous task of mapping the natural resources of the Philippines, the Phil-LiDAR 2 program consisting of 15 universities has developed a mechanism to facilitate data gathering, data processing, quality check and coordination at different levels to ensure expected outputs are completed. The program is significant in view of the following:
a. Accurate and detailed inventory of various natural resources (recent state and conditions) is conducted, b. Various methodologies on the integrated use of
LiDAR and other data sets have been developed, c. LiDAR and Spectral libraries are being produced, d. Capability building and enhancement is undertaken, e. A network of universities, agencies, and LGUs is
organized through collaborative activities
Overall, this is expected to result in a more sustainable and responsive utilization of space technologies for improved natural resource assessment of the Philippines.
ACKNOWLEDGEMENTS