Tobin’s Q, Managerial Ownership, and
Analyst Coverage
A Nonlinear Simultaneous Equations Model
Carl R. Chen and Thomas L. Steiner
This paper estimates a simultaneous equations model with analyst coverage, managerial ownership and firm valuation jointly determined within the system. We argue that both managerial ownership (serving an internal monitoring function) and analyst coverage (serving an external monitoring function) enhance firm value, while managerial ownership and analyst coverage are substitutes in the monitoring of the firm. The empirical results based upon a nonlinear three-stage-least-square procedure lead to several interesting conclusions: First, we find a diminishing substitution effect between managerial owner-ship and analyst coverage and a decreasing marginal value for managerial ownerowner-ship. Second, we find support for both an alignment effect and an entrenchment effect in the relationship between managerial ownership and Tobin’s Q after controlling for the effect of analyst coverage. Third, we find support for the argument that analyst coverage serves to enhance firm valuation after controlling for the effect of managerial ownership. Finally, we find that analyst coverage, managerial ownership and firm valuation are jointly
determined. © 2000 Elsevier Science Inc.
Keywords: Firm value; Managerial ownership; Analyst coverage JEL classification: G30; G32
I. Introduction
This paper studies the joint determination of firm valuation, managerial ownership and analyst coverage. Specifically, we argue that both internal monitoring (managerial own-ership) and external monitoring (analyst coverage) enhance firm value, although we find that firm value is retarded when managerial ownership exceeds 28.8%. We also postulate
Professor of Finance, University of Dayton, Dayton, OH (CRC and TLS).
Address correspondence to: Carl R. Chen, Department of Finance, University of Dayton, 300 College Park, Dayton, OH 45469-2251
that higher firm value inspires higher managerial ownership, and invites more analyst coverage. Yet, while we argue that both managerial ownership and analyst coverage increase firm value, we contend that they are substitutes for one another in monitoring the firm.1
Firm Value and Monitoring
Jensen and Meckling (1976) make persuasive arguments that predicts managerial own-ership serves to align the interests of managers and outside equityholders such that a positive relationship is expected between managerial ownership and firm valuation. Stulz (1988) develops a model of firm valuation in which entrenchment effects result in a negative relationship between managerial ownership and firm valuation at a sufficiently high level of managerial ownership. Furthermore, Jensen and Meckling argue analyst coverage to be a positive determinant of firm valuation. They state: “We would expect monitoring activities to become specialized to those institutions and individuals who possess comparative advantages in these activities. One of the groups who seem to play a large role in these activities is composed of the security analysts . . . .”2They further argue that if “. . . security analysis activities reduce the agency costs associated with the separation of ownership and control they are indeed socially productive. Moreover, if this is true we expect the major benefits of security analysis activity to be reflected in the higher capitalized value of the ownership claims to corporations.”3 4
Several empirical studies have used Tobin’s Q as a measure of valuation to study the relationship between managerial ownership and firm valuation. These papers include Morck, Shleifer, and Vishny (1988) and McConnell and Servaes (1990) that offer support for both the positive alignment effect and the negative entrenchment effect. The empirical models, however, do not account for the monitoring effects associated with analyst coverage. Chung and Jo (1996) fill this gap in the literature by empirically testing the relationship between the number of analysts and Tobin’s Q and find a positive relation-ship. Their study, however, does not model the effect associated with the percentage of managerial ownership. As a consequence of the incompleteness of these existing studies, it remains a vital issue as to the relationships between managerial ownership and firm valuation and between analysts coverage and firm valuation after each effect is properly controlled within the same model.
Joint Determination
In an effort to formulate a proper empirical model of these relationships, we argue that analyst coverage, managerial ownership and Tobin’s Q are jointly determined and, therefore, should be modeled within a three-equation system of equations. An argument
1We use the terms “analyst coverage” and “number of analysts” interchangeably in the paper.
2Jensen, M. and W. Meckling. 1976. Theory of the firm: managerial behavior, agency costs and ownership structure. Journal of Financial Economics 3:354.
3Jensen, M. and W. Meckling. 1976. Theory of the firm: managerial behavior, agency costs and ownership structure. Journal of Financial Economics 3:355.
for this empirical specification can be supported from a closer examination of earlier empirical research while this examination also allows us to gain additional insights into the relationships between these variables.
Chung and Jo (1996) jointly model Tobin’s Q and analyst coverage using a simulta-neous equation estimation procedure. They argue that the amount of analyst coverage is a determinant of Tobin’s Q and Tobin’s Q is a determinant of the amount of analyst coverage. Their empirical results are supportive of this joint dependency. Moyer, Chat-field, and Sisneros (1989) also model the amount of analyst coverage using a single equation estimation procedure; they find this measure to be negatively impacted by the percentage of insider ownership. This finding suggests the possibility that the Chung and Jo model should be expanded to include managerial ownership as an endogenous variable. Two points are relevant:
1. Moyer, Chatfield, and Sisneros contend that the relationship between managerial ownership and the number of analysts is consistent with a substitution effect which they infer from the arguments of Jensen and Meckling (1976). Their empirical model, however, assumes a linear substitution effect. This linear effect, in turn, implicitly assumes a constant marginal value for managerial ownership that is inconsistent with, for example, the observed entrenchment effects in the Tobin’s Q literature [McConnell and Servaes (1990)]. If the marginal value of managerial ownership diminishes, we may expect the causal inverse relationship from mana-gerial ownership to analyst coverage to diminish.
2. The substitution effect argument made by Moyer, Chatfield, and Sisneros could similarly be applied to a causal relationship from analyst coverage to managerial ownership. Indeed, it is possible that their results are spurious if they capture a relationship by which analyst coverage is a determinant of managerial ownership rather than their hypothesized relationship by which managerial ownership is a determinant of analyst coverage. This counter argument is plausible because analyst coverage mitigates the value of managerial ownership as an internal monitoring force. As a final point, the determinants of managerial ownership have been investigated by Crutchley and Hansen (1989) and Jensen, Solberg, and Zorn (1992), yet these two studies have not explored the possible effect of analyst coverage on managerial ownership.
Research Issues and Implications
the financial literature that has investigated the interactions among alternative monitoring agents and among monitoring agents and firm valuation. Our research design allows us to more carefully examine the following questions:
● What is the relationship between managerial ownership and firm valuation after controlling for the effect of analyst coverage? What is the relationship between analyst coverage and firm valuation after controlling for the effect of managerial ownership?
● What is the causal relationship between managerial ownership and analyst coverage? Is managerial ownership a determinant of analyst coverage? Is analyst coverage a determinant of managerial ownership? Are these two monitoring functions substitute or complement?
● Are firm valuation, managerial ownership, and analyst coverage jointly determined? From the results of our empirical analysis, we offer a number of interesting conclu-sions:
managerial ownership the relationship between managerial ownership and Tobin’s Q is positive in support of an alignment effect; at high levels of managerial ownership the relationship is negative in support of an entrenchment effect. The findings are consistent with the arguments of Jensen and Meckling (1976) and Stulz (1988), and shed light on the empirical research of Morck, Shliefer and Vishny (1988), McConnell and Servaes (1990), and Chung, and Jo (1996) after both analyst coverage and managerial ownership effects are included within the same model of valuation.
2. The percentage of managerial ownership is a nonlinear determinant of the number of equity analysts. We argue the result is explained by a diminishing substitution effect and a diminishing marginal value for managerial ownership that becomes negative at a sufficiently high percentage of managerial ownership. The explanation of this relationship runs parallel to the explanation for the causal relationship from managerial ownership to Tobin’s Q. Furthermore, the inflection point in the rela-tionship between managerial ownership and analyst coverage is impressively close to the inflection point in the relationship between managerial ownership and Tobin’s Q. This result serves to extend the empirical research of Moyer, Chatfield, and Sisneros (1989) and Chung and Jo (1996) by offering more insight into the interaction between internal and external monitoring forces.
3. Analyst coverage is a negative determinant of managerial ownership. This result is consistent with a substitution effect and a diminishing marginal value to external monitoring in the form of analyst coverage. The result serves to extend the empirical research of Crutchley and Hansen (1989) and Jensen, Solberg, and Zorn (1992), which do not consider the impact of analyst coverage on managerial ownership. 4. Analyst coverage, managerial ownership and firm valuation are jointly determined. 5. Our conclusions are robust to the inclusion of institutional ownership effects and to
alternative methods for measuring the financial variables.
The remainder of the paper is structured as follows: in Section II, the data, method-ology, and testable hypotheses are presented; in Section III, the empirical results are reviewed; concluding remarks are made in Section IV.
II. Data, Methodology, and Testable Hypotheses
Data and Models
We study a sample of firms as of December 1994. The sample of firms used in the study includes all NYSE and AMEX firms which have relevant financial data on Compustat, CRSP, Analyst Concensus Estimates (ACE), and Compact Disclosure databases. The total number of firms meeting these data requirements is 824. The following abbreviations are used to represent the variables employed in the study:
Q 5 Tobin’s Q;
NANL 5 Number of analysts making earnings estimates for a particular firm;
LNANL 5 Log of the number of analysts;
OWN 5 Percentage of managerial ownership defined to be the shares owned by
officers and directors (as reported in the firm’s proxy statement and the compact disclosure data base) divided by the total shares outstanding.
LTA 5 Log of the total firm value measured as the book value of total assets;
LEQTY 5 Log of the equity value measured as the stock price times the shares outstanding;
DA 5 Total debt divided by total assets;
DISP 5 Dispersion of the analyst’s consensus growth estimates as measured by the standard deviation of the estimates;
RDA 5 Research and development expense divided by the total assets in the firm;
ROA 5 Net Income divided by the total assets in the firm;
GRTH 5 Analysts’ consensus growth rate forecast;
1/P 5 The inverse of the stock price per share;
SD 5 Total risk of the firm’s equity measured as the standard deviation of the market returns;
NYSE 5 1 if the firm is listed on the New York Stock Exchange, 0 otherwise.
INST 5 The percentage of institutional ownership5
We develop a simultaneous-equation model with analyst coverage, managerial own-ership, and Tobin’s Q jointly determined within the model.6The three-equation model can be represented as:
LNANL5ƒ (OWN, OWN2, Q, LEQTY, RDA, GRTH, SD, NYSE, 1/P),7 (1)
OWN5ƒ (LANL, Q, LEQTY, DA, RDA, SD, DIV), (2)
Q5ƒ(OWN, OWN2, LANL, LTA, DA, DISP, RDA, ROA). (3)
The variables included in the models consider prior research and model identification.
Analyst Coverage Equation
Managerial ownership (OWN) is included to capture the substitution effect between internal and external monitoring. Moyer, Chatfield, and Sisneros (1989) consider this relationship using a linear specification. However, our model includes the square of managerial ownership (OWN2) to capture the possibility of a diminishing substitution effect and the possibility of a turning point in the relationship consistent with a decreasing value for managerial ownership (McConnell and Servaes (1990)). Tobin’s Q is included based upon Chung and Jo’s (1996) argument that Q is a measure of the quality of the firm and higher quality firms are easier to market.
The exogenous variables included are: size (LEQTY), stock price (1/P), risk (SD), growth potential (GRTH), research and development (RDA), and New York Stock Exchange listing (NYSE).8LEQTY is expected to be a significant, positive determinant
5We later include institutional ownership into the model as an examination of the robustness of the results. 6 The use of a simultaneous equations methodology has a been employed by a number of previous studies in finance. See, for example: Bathala, Moon, and Rao (1994), Jensen, Solberg, and Zorn (1992), Jalilvand and Harris (1984), Peterson and Benesh (1983), McCabe (1979), and Dhrymes and Kurz (1967).
7 We assume a log-liner functional form for variable NANL (number of analysts). Since most economic variables exhibit diminishing marginal returns, we conjecture that a diminishing monitoring effect is reasonable if the marginal contribution to monitoring by analysts decreases as their numbers increase (also see Chung and Jo, 1996 for similar arguments). We also assume a log-liner functional form for variables EQTY and TA as they are the most popular one for these two variables found in many prior studies.
of LNANL. Presumably a large equity value will be associated with a higher trading volume that justifies the cost of the additional information acquired by the analysts. Brennan and Hughes (1991) develop a theoretical model with empirical support for an inverse relationship between the share price and analyst following. They argue that stock splits reduce the relative share price and at the same time stock splits signal a brighter future for the firm which attracts more analysts. Bhushan (1989) contends that risk increases the value of the analyst’s supply of information. Research and development (RDA) is included to capture the possibility that R&D intensive firms are more likely to be followed by more analysts because they are perceived as higher quality firms. Chung and Jo (1996) offer arguments supportive of this reasoning. On the other hand, high RDA firms may diminish the need for external monitoring in the form of analyst coverage consistent with the free cash flow hypothesis of Jensen (1986). More specifically, if research and development serves to lower the level of free cash flow, and therefore agency problems associated with free cash flow, then the value of analyst coverage as an external monitoring force may be reduced yielding a lower level of analyst coverage. Chung and Jo (1996) similarly contend that NYSE listed firms are better known firms and perceived as being higher quality firms, therefore these firms are more likely to receive more analyst coverage. Finally, Moyer, Chatfield, and Sisneros (1989) report a positive relationship between firm growth (GRTH) and analyst coverage. They argue that high growth firms require the additional monitoring from more analysts.
Managerial Ownership Equation
We postulate that analyst coverage determines the percentage of managerial ownership. Consistent with the arguments of Jensen and Meckling (1976), who contend that both managerial ownership and analyst coverage serve as monitoring forces in the firm, we argue that a higher level of external monitoring in the form of analyst coverage will reduce the need for internal monitoring provided by managerial ownership. Moreover, we expect the magnitude of this substitution effect to decrease as the number of analysts increase. This is expected if the marginal value of an additional analyst diminishes and, conse-quently, the substitution effect is retarded. Tobin’s Q is also included as a determinant of managerial ownership. We anticipate that higher quality firms, as measured by a higher Tobin’s Q, will inspire higher percentages of managerial ownership. Consistent with the self-interest of managers, we would expect a manager’s decision to commit financial capital, as well as human capital, to a firm to be a function of the quality of the firm. The exogenous variables in this equation include size (LEQTY), debt (DA), research and development (RDA), risk (SD), and dividend policy (DIV). Each variable has been used in previous research to model managerial ownership.9
Crutchley and Hansen (1989) use the direct ownership by officers and directors as reported by Spectrum to measure managerial ownership. They find that this measure is positively related to risk (SD), negatively related to size (LEQTY), and inversely, but not significantly, related to research and development expense (RDA). Jensen, Solberg, and Zorn (1992) find insider ownership, as reported by Value Line, to be negatively related to size (LEQTY) while they also argue that insider ownership is a function of the amount of dividends (DIV) and the level of debt (DA). Size is expected to negatively impact managerial ownership because wealth constraints prevent managers from obtaining a large percentage of equity as the firm size increases. Debt is also expected to be a negative determinant of managerial ownership because higher debt firms are more intensively exposed to the monitoring process of the market. Demsetz and Lehn (1985) contend that a firm’s control potential is directly associated with the noisiness of the environment in which it operates. Their arguments suggest a more risky firm may require a higher level of managerial ownership or inside monitoring due to asymmetric information. Further-more, the higher the level of research and development expense and the higher the dividend, the lower the firm’s free cash flow and, thus, the lower the need for managerial ownership to control agency problems associated with free cash flow (Jensen, 1986).
Tobin’s Q Equation
Managerial ownership (OWN) is expected to nonlinearly impact firm valuation consistent with the alignment and entrenchment effects of Jensen and Meckling (1976) and Stulz (1988) and consistent with the empirical findings of Morck, Shleifer, and Vishny (1988) and McConnell and Servaes (1990). We expect the number of analysts (LNANL) to positively cause Q consistent with the arguments of Jensen and Meckling (1976) that outside monitoring reduces agency costs. This is also consistent with the empirical findings of Chung and Jo (1996). Firm size, measured by total assets (LTA), research and development expense (RDA), profitability (ROA), the dispersion of analysts’ forecasts (DISP) and analyst coverage (LNANL) were found to be significant determinants of Tobin’s Q in Chung and Jo (1996). A negative relation between LTA and Q may be expected due to the tendency for firms with higher total assets to be more diversified which, in turn, has been found to negatively impact firm valuation (Lang and Stulz (1994)). Both profitability (ROA) and research and development (RDA) are expected to positively cause firm valuation. In addition to Chung and Jo (1996)., these findings are also reported by Hirschey (1982), Cockburn and Griliches (1988), Morck, Shleifer, and Vishny (1988), McConnell and Servaes (1990), and Hall (1993). The dispersion of analysts’ forecasts, which serve as a proxy of ex ante risk (see Farrelly and Reichenstein, 1984), is expected to be a negative determinant of Tobin’s Q.
We estimate Equations (1–3) simultaneously using a nonlinear-three-stage-least-squares estimation procedure. The procedure yields efficient, and unbiased parameter estimates (Green, 1997).
Hypotheses
The simultaneous equations model allows us to test four primary hypotheses:
Hypothesis 1. The number of analysts following a firm is a nonlinear function of the
of managerial ownership, managerial ownership serves to align the interests of manage-ment and outside equity holders allowing for a substitution effect between managerial ownership and the amount of external monitoring through equity analysts. At higher levels of managerial ownership, managerial ownership serves to entrench management which leads to a higher level of external monitoring from equity analysts.
Hypothesis 2. The percentage of managerial ownership is an inverse function of the
number of equity analysts following a firm. This is because the number of equity analysts serves as a substitute for managerial ownership in monitoring the firm. We contend that agency costs are reduced if a firm has significant monitoring by equity analysts. Conse-quently, the firm may find it less important to institute policies which motivate managerial ownership.
Hypothesis 3. Both managerial ownership (internal monitoring) and analyst coverage
(external monitoring) reduce agency costs and thus impact firm value. The percentage of managerial ownership is a nonlinear determinant of the valuation of the firm after controlling for the level of analysts coverage. Over low levels of managerial ownership, we expect a positive relationship between managerial ownership and valuation in support of an alignment effect. Over higher levels of managerial ownership, we expect a negative relationship in support of an entrenchment effect. We further expect the number of analysts to be a significant positive determinant of firm valuation after controlling for the percentage of managerial ownership as the monitoring effect of analysts serves to enhance valuation.
Hypothesis 4. Analyst coverage, managerial ownership, and firm valuation are jointly
determined.
III. Empirical Results
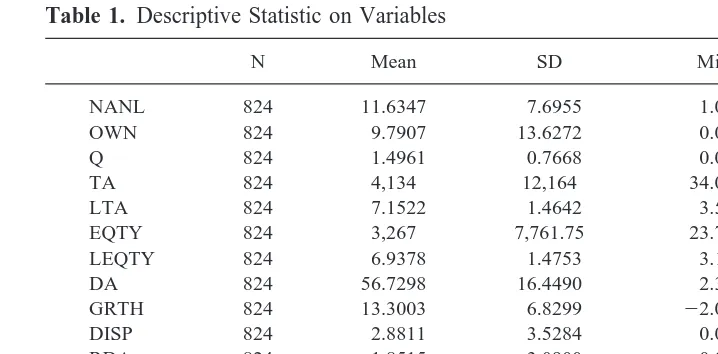
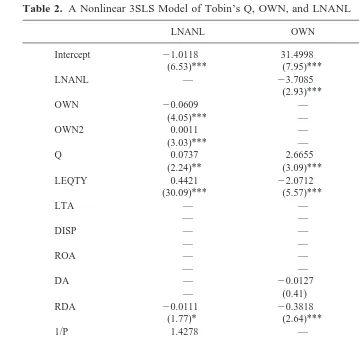
The empirical results are reported in Tables 1 through 3. Table 1 offers simple descriptive statistics on the variables used in the model. Table 2 reports the parameter estimates of Equations 1–3 using the nonlinear three-stage-least-squares estimation procedure. Figures 2 and 3 allow for a graphical representation of the findings. Table 3 examines the robustness of the results after including institutional ownership effects and after measuring the financial variables using three year averages.
Descriptive Statistics
conjunction with high stock market valuation result in higher Tobin’s Q in the 1990s. Second, variations in sample size may also explain the deviations in some statistics. For example, our sample contains 824 observations, while Crutchley and Hanses (1989) have approximately 600. The mean level of total assets is $4,134 million, and the mean value of the equity market value is $3,267 million. The mean level of the debt-to-asset ratio is 56.73%. The estimated growth in earnings for the average firm is 13.3%, with a standard deviation of 6.8%. The dispersion of the analyst growth estimates measured by the standard deviation of the growth estimates is 2.88%. Research and development, as a percentage of total assets, is 1.85% with a standard deviation of 3.09%. Return on assets has a mean level of 5.45%. The standard deviation of the market returns of a firm’s stock is 1.84%, and the dividend yield has a mean value of 2.29% with a standard deviation of 2.42%. Finally, the NYSE dummy variable shows that 93.81% of the sample firms are listed on the New York Stock Exchange.
Primary Results
Table 2 reports the results of the nonlinear three-stage-least-squares estimates for the simultaneous equation model defined by Equations 1–3. The model allows us to test the hypotheses advanced in Section II of this paper.
Equation 1 in Table 2 offers an empirical model of analyst coverage which enables us to test Hypothesis 1. In this model we find the level of managerial ownership to be nonlinearly related to the number of analysts in support of Hypothesis 1. The negative value of variable OWN is consistent with a monitoring substitution effect between NANL and OWN. This substitution effect, however, is increasingly retarded at higher percentages of managerial ownership due to the positive sign of variable OWN2. The inflection point
Table 1. Descriptive Statistic on Variables
GRTH 824 13.3003 6.8299 22.0000 74.500
DISP 824 2.8811 3.5284 0.0000 40.060
RDA 824 1.8515 3.0900 0.0000 33.884
ROA 824 5.4500 6.1485 256.7378 52.281
SD 824 1.8366 0.6545 0.7727 7.2294
DIV 824 2.2870 2.4246 0.0000 24.421
NYSE 824 0.9381 0.2411 0.0000 1.000
in the relationship is at 27.68%.10 The interpretation of this inflection point may be that as the percentage of managerial ownership increases, the marginal value of managerial ownership diminishes thus causing the substitution monitoring effect between the per-centage of managerial ownership and the number of analysts to be retarded. Indeed, for a level of managerial ownership above 27.68%, the marginal value of managerial ownership is no longer positive which increases the value of analyst monitoring. This yields a positive causal relationship between the percentage of managerial ownership and the
10 The inflection point is calculated as the derivative of analyst coverage with respect to managerial ownership. A similar inflection point is calculated for the relationships between Tobin’s Q and managerial ownership.
Table 2. A Nonlinear 3SLS Model of Tobin’s Q, OWN, and LNANL
LNANL OWN Q
number of analysts. Interestingly, this is also consistent with the empirical relationship between managerial ownership and Tobin’s Q where we find the marginal value of managerial ownership above 28.83% (the inflection point) to be negative. This empirical result is interesting because it shows how both monitoring forces interact and how they serve to impact firm valuation. The result is supportive of Hypothesis 1.
We also find the level of Tobin’s Q to positively impact analyst coverage in Equation 1. These results are consistent with the arguments advanced by Chung and Jo (1996), that analysts find it easier to market firms which are more highly regarded by the market. The exogenous variables in Equation 1 include equity value (LEQTY), research and devel-opment (RDA), growth (GRTH), inverse of the stock price (1/P), and risk (SD). Consis-tent with Moyer, Chatfield, and Sisneros (1989), the market value of equity (LEQTY) which often is used as a proxy of firm size, carries a positive and significant parameter estimate. Both the inverse of the stock price and the risk measure are positive and significant at the 1% level of confidence as expected. The negative parameter of RDA,
This figure presents graphical representations of the relationships between managerial ownership and analyst coverage. The graphs are developed based upon the estimated models in Table 2. Control variables are held constant at their mean values in order to present the functions in this figure.
however, is supportive of the free cash flow argument. Growth potential, although positive, is not statistically significant.
In Equation 2, the percentage of managerial ownership is modeled within the system of equations which enables us to test Hypothesis 2. In this equation, analyst coverage is inversely related to the percentage of managerial ownership consistent with the discus-sions of a substitution effect and Hypothesis 2 set forth in the prior section of the paper. The employment of the log of the number of analysts yields a diminishing substitution effect as the number of analysts increases. This diminishing effect is reasonable if the marginal contribution to monitoring by analysts decreases as their numbers increase. Tobin’s Q is a positive and significant determinant of managerial ownership. This is consistent with self-interested managers committing higher levels of financial capital to a high quality firm. The exogenous variables in this equation include market value of equity (LEQTY), debt (DA), research and development (RDA), risk (SD), and the dividend yield (DIV). The LEQTY has a strong inverse relationship to the percentage of managerial
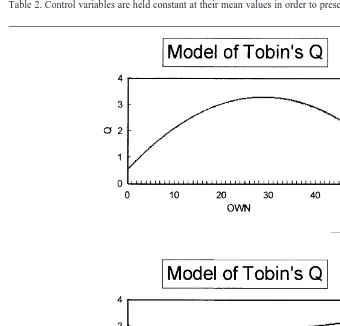
This table presents graphical representations of the relationships between Tobin’s Q and managerial ownership and between Tobin’s Q and analyst coverage. The graphs are developed based upon the estimated models in Table 2. Control variables are held constant at their mean values in order to present the functions in this figure.
Figure 3. Graphical representations of the relationships between Tobin’s Q and OWN and between
ownership, and the financial leverage measure (DA) is inversely related to the percentage of managerial ownership although the relationship is not statistically significant. The level of research and development (RDA) and the dividend yield (DIV) are both inversely and significantly related to the percentage of managerial ownership consistent with the free cash flow argument. The risk variable (SD) carries a positive sign, but is statistically insignificant.
Equation 3 studies the determinants of Tobin’s Q. In support of Hypothesis 3, the percentage of managerial ownership is a nonlinear function of the firm value as measured by Tobin’s Q. The nonlinear function estimates an inflection point at 28.83%. This can be
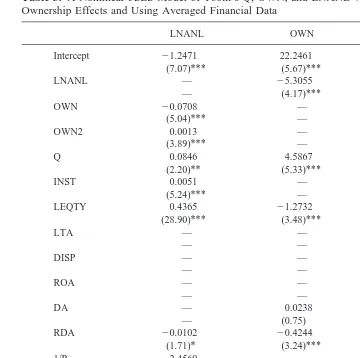
Table 3. A Nonlinear 3SLS Model of Tobin’s Q, OWN, and LNANL With Institutional
Ownership Effects and Using Averaged Financial Data
LNANL OWN Q
interpreted to support the alignment effect (a positive relationship) for a level of mana-gerial ownership below 28.83% and interpreted to support the entrenchment effect (a negative relationship) for a level of managerial ownership above 28.83%. This is close to the inflection point in the causal relationship from managerial ownership to analyst coverage (Equation 1). This result is obtained after the number of analysts has been controlled.
Additionally, we find that the number of analysts is a significant and positive deter-minant of Tobin’s Q after controlling for the effects of managerial ownership. The results extend those offered by McConnell and Servaes (1990) into a simultaneous equation model with an analyst effect. The model of Tobin’s Q also includes several exogenous variables. These variables closely resemble the model offered by Chung and Jo (1996) although their model does not include effects associated with managerial ownership. We find the measure of firm size (LTA) to be inversely related to the firm’s valuation. This is consistent with larger firms having a more diversified asset composition which, in turn, has been shown to retard market valuations (Lang and Stulz, 1994). Both RDA and ROA carry positive parameter estimates and are highly significant which is consistent with many prior findings in the Tobin’s Q literature. The debt to asset ratio (DA) and the dispersion of analysts’ earnings forecast (DISP), however, are not statistically significant. Overall, the results from estimating the simultaneous equations model defined by Equations 1–3 yield a number of interesting conclusions. First, in support of Hypothesis 1 and Hypothesis 2, we find managerial ownership and analyst coverage to be jointly dependent and inversely related. As additional clarification of these relationships, Figure 2 offers a graphical representation of the joint dependency between managerial ownership and analyst coverage. The presentation in Figure 2 is based upon the models estimated in Table 2 with control variables held constant at their mean values. Second, consistent with Hypothesis 3, we find support for both the alignment and the entrenchment effect after controlling for the monitoring performed by equity analysts, and we find the number of analysts to positively impact the firm valuation after controlling for the percentage of managerial ownership. Figure 3 offers a graphical representation of these relationships. The presentation in Figure 3 is based upon the models estimated in Table 2 with control variables held constant at their mean values. Third, consistent with Hypothesis 4, we find analyst coverage, managerial ownership, and firm valuation to be jointly determined.
Additional Results
In this section, we further examine the endogenous relationships between Tobin’s Q, managerial ownership, and analyst coverage. We examine the robustness of the findings after we control for the effects of institutional ownership and after we measure the financial variables as averages over a three-year period from 1992 through 1994.
The motivation for examining the institutional ownership effect is provided by Bat-thala, Moon, and Rao (1994) and by O’Brien and Bhushan (1990). BatBat-thala, Moon, and Rao use institutional ownership as an exogenous variable in examining a simultaneous equation model with managerial ownership and debt as endogenous variables. They identify an inverse relationship between institutional ownership and debt, but did not find such a relationship between institutional ownership and managerial ownership for NYSE
and AMEX firms.11 O’Brien and Bhushan (1990) examine a model in which analyst
coverage and institutional ownership are assumed to be endogenous. After controlling for the simultaneity effect between the changes in the analyst coverage and the changes in the institutional ownership using a two-stage-least-square method, they did not find the analyst coverage (institutional ownership) to impact institutional ownership (analyst coverage). In light of O’Brien and Bhushan’s finding, we propose that institutional holdings influence analyst coverage, which, in turn, impacts firm value.12We report the results in Table 3. We find that institutional ownership has a significant and positive effect on the level of analyst coverage. Additionally, our overall model remains robust to the inclusion of this variable.
As a final examination of the robustness of our model, we measure the financial variables as averages over a three-year period of time. This is motivated by previous researchers such as Jensen, Solberg, and Zorn (1992) who have used this approach. Table 3 offers the results from using this approach. The results are reported with the institutional ownership effects included. The conclusions we have reached in this paper are not sensitive to this change in the measurement of the variables. More specifically, we again find strong support for an endogenous relationship between Tobin’s Q, managerial ownership, and analyst coverage.
VI. Conclusions
This paper offers a nonlinear simultaneous-equations model of analyst coverage, mana-gerial ownership and firm valuation. The treatment of these measures as jointly deter-mined is motivated from earlier theoretical and empirical research. Overall, we find that after controlling for the effect of exogenous variables in the system, both internal monitoring (measured by managerial ownership) and external monitoring (measured by analyst coverage) enhance firm value (measured by Tobin’s Q) although firm value is retarded when the managerial ownership exceeds 28.8%. Furthermore, the negative relationship between analyst coverage and managerial ownership suggests the existence of a substitution effect between these two monitoring forces. More specifically, this paper offers several interesting results: First, we find a nonlinear causal relationship from managerial ownership to the number of equity analysts. The relationship supports a diminishing substitution effect and a decreasing marginal value for managerial ownership. We find the inflection point of 27.68% in this relationship to be interestingly close to the inflection point of 28.83% in the causal relationship from managerial ownership to Tobin’s Q. Second, we find an inverse, causal relationship from the number of equity analysts to the percentage of managerial ownership. Third, we find the relationship between managerial ownership and Tobin’s Q to be nonlinear after controlling for the influence of analyst coverage, and we find the relationship between analyst coverage and Tobin’s Q to be positive and significant after controlling for the percentage of managerial ownership. Finally, we find analyst coverage, managerial ownership, and firm valuation to be jointly determined in a simultaneous equation system.
References
Bathala, C., Moon, K., and Rao R. Autumn 1994. Managerial ownership, debt policy, and the impact of institutional holdings: An agency perspective,“ Financial Management 23(3):38–50. Brennan, M., and Hughes, P. 1991. Stock prices and the supply of information. Journal of Finance
46:1665–1691.
Bhushan, R. 1989. Firm characteristics and analyst. Journal of Accounting and Economics 11:255– 274.
Cockburn, I., and Griliches, Z. May 1988. Industry effects and appropriability measures in the Stock Market’s valuation of R&D and patents. American Economic Review 78:419–423.
Chung, K. H., and Jo, H. December 1996. The impact of security analysts’ monitoring and marketing functions on the market value of firms. Journal of Financial and Quantitative Analysis 31(4):493–512.
Crutchley, C., and Hansen, R. S. Winter 1989. A test of the agency theory of managerial ownership, corporate leverage, and corporate dividends. Financial Management 18(4):36–46.
Demsetz, H. 1983. The structure of ownership and the theory of the firm. Journal of Law and
Economics 26:375–393.
Demsetz, H., and Lehn, K. December 1985. The structure of corporate ownership: Causes and consequences. Journal of Political Economy 93(6):1155–1177.
Dhrymes, P., and Kurz, M. 1967. Investment, dividend and external finance behavior of firms. In
Determinants of Investment Behavior (R. Ferber, ed). New York: National Bureau of Economic
Research, pp. 427–467.
Farrelly, G. E., and Reichenstein, W. R. Summer 1984. Risk perceptions of institutional investors.
Journal of Portfolio Management 10(4):5–12.
Greene, W. H. 1997. Econometric Analysis. Englewood Cliffs, NJ: Prentice Hall.
Hall, B. May 1993. The Stock Market’s valuation of R&D investment during the 1980’s. American
Economic Review 83:259–264.
Hirschey, M. June 1982. Intangible capital aspects of advertising and R&D expenditures. Journal
of Industrial Economics 30(4):375–391.
Jalilvand, A., and Harris, R. March 1984. Corporate behavior in adjusting to capital structure and dividend targets: An econometric study. Journal of Finance 39(1):127–145.
Jensen, M., and Meckling, W. October 1976. Theory of the firm: Managerial behavior, agency costs and ownership structure. Journal of Financial Economics 3(4):305–360.
Jensen, M. May 1986. Agency costs of free cash flow, corporate finance, and takeovers. American
Economic Review 76:323–329.
Jensen, G., Solberg, D., and Zorn, T. June 1992. Simultaneous determination of insider ownership, debt, and dividend policies. Journal of Financial and Quantitative Analysis 27(2):247–263. Lang, L., and Stulz, R. December 1994. Tobin’s q, corporate diversification, and firm performance.
Journal of Political Economy 102(6):1248–1280.
McCabe, G. March 1979. The empirical relationship between investment and financing: A new look. Journal of Financial and Quantitative Analysis 14(1):119–135.
McConnell, J., and Servaes, H. October 1990. Additional evidence on equity ownership and corporate value. Journal of Financial Economics 27(2):595–612.
Merton, R. July 1987. A simple model of capital market equilibrium with incomplete information.
Journal of Finance 42(3):483–510.
Morck, R., Shleifer, A., and Vishny, W. January/March 1988. Management ownership and market valuation: An empirical analysis. Journal of Financial Economics 20(1/2):293–316.
Modigliani, F., and Miller, M. H. May 1963. Corporate income taxes and the cost of capital: A correction. American Economic Review 53:433–443.
Moyer, C. R. Chatfield, R. E., and Sisneros, P. M. December 1989. Security analyst monitoring activity: Agency costs and information demands. Journal of Financial and Quantitative Analysis 24(4):503–512.
O’Brien, P., and Bhushan, R. 1990. Analyst following and institutional ownership. Journal of
Accounting Research 28(Suppl.):55–82.
Peterson, P., and Benesh, G. December 1983. A reexamination of the empirical relationship between investment and financing decisions,“ Journal of Financial and Quantitative Analysis 18(4):439– 453.