THE TASSELED CAP TRANSFORMATION FOR RAPIDEYE DATA AND THE
ESTIMATION OF VITAL AND SENESCENT CROP PARAMETERS
M. Schönert a, E. Zillmann a , H. Weichelt a, J. U. H. Eitel b, T. S. Magney b, H. Lilienthalc, B. Siegmannd, T. Jarmerd
a BlackBridge, Dept. of Application Research, 10719 Berlin, Germany - (maurice.schoenert, erik.zillmann, horst.weichelt)@blackbridge.com
b Geospatial Laboratory for Environmental Dynamics, University of Idaho, Moscow, ID 83844-1135, USA (jeitel, tmagney)@uidaho.edu
c Julius-Kühn-Institut (JKI), Federal Research Centre for Cultivated Plants, 38116 Braunschweig, Germany – ([email protected])
d Institute for Geoinformatics and Remote Sensing, University of Osnabrueck, 49076 Osnabrueck, Germany – ([email protected])
KEY WORDS: Tasseled Cap, RapidEye, crop biophysical parameters, Greenness, Yellowness, NDVI, PSRI, LAI, chlorophyll, nitrogen
ABSTRACT:
The retrieval of crop biophysical parameters using spectral indices obtained from high temporal and spatial resolution satellite data, is a valuable tool to monitor crop growth and status. Tasseled Cap Features (TCFs) for RapidEye data were derived from spectral variances typically present in agricultural scenes. The TCF Greenness (GRE) was aligned to the spectral variance of vital vegetation, and therefore, it represents the typical reflectance characteristics of green vegetation, with relatively higher reflectance at the near-infrared (NIR) range. The TCF Yellowness (YEL) was aligned to correspond to the reflectance characteristics of senescent crops, with relatively higher reflectance in the visible portion of the spectrum due to chlorophyll breakdown, and lower reflectance in the NIR range due to cell structure decomposition compared to vital green vegetation. The goal of this work was to assess the potential of RapidEye’s TCFs for the prediction of green leaf area index (LAI), plant chlorophyll (Chl), and nitrogen (N) concentration, as well as the identification of senescence patterns. The linear relationships between the biophysical parameters and the TCFs were compared to the performance of the widely used indices NDVI and PSRI. Preliminary results indicate that GRE is strongly related to LAI in vital crops and suggests a higher predictive power than NDVI. YEL demonstrated a strong linear relation and a higher potential to estimate Chl and N concentration in senescent soft white winter wheat (Triticum aestivum L.) in comparison to PSRI. PSRI showed a stronger correlation to Chl in senescent soft white spring wheat (Triticum aestivum L.), compared to YEL. Results indicate that YEL may be used to characterize the variability in senescence status within fields. This information, in conjunction with soil fertility and yield maps, can potentially be used to designate precision management zones.
1. INTRODUCTION
The high temporal (< 5 days) and spatial resolution (5 m) of RapidEye satellite imagery allows for the assessment of in-field variability of crop biophysical characteristics, and therefore is a valuable tool for site specific management to increase the productivity and quality of crops.
Leaf area index (LAI), the ratio of one-sided green leaf area to ground area, is a key variable for estimating foliage cover, biomass, and yield in agricultural systems (Gitelson et al. 2003; Haboudane et al. 2004). LAI is a valuable parameter to assess the temporal and spatial variability of crop status and thereby can support farmer’s management decisions during the growing season (Wu et al. 2007; Kross et al. 2015).
Information on the chlorophyll (Chl) and/or nitrogen (N) concentration of wheat during senescence can be useful to predict plant water status and dry-down rates. Mapping variations of senescence (crop drying patterns) within a field can potentially provide additional information to designate precision management zones, e.g. to highlight areas that are more or less sensitive to abiotic conditions, which could ultimately drive spatial variations in grain quality and quantity. Recent studies pointed out that site specific harvesting bears potential to increase wheat quality and net return rates in quality incentive markets (Morari et al. 2013; Diacono et al. 2012; Meyer-Aurich et al. 2008; Wright et al. 2004; Freeman et al. 2003). In accordance with previous studies, Diacono et al. (2012) reported
quality parameters of wheat crops in rain fed agricultural systems (Buttafuoco et al. 2010; Ibrahim & Huggins 2011; Basso et al. 2007). Practically, the longer the duration and slower the rate of senescence, the greater is the probability for higher yields (Herbek & Lee 2009). Further, remotely estimating canopy Chl and/or N at these late stages of plant growth could provide information on salvageable N, N use efficiency, N status, and rate of senescence, and might be useful to indicate spatial patterns related to yield or wheat quality conditions.
Senescence is the final stage of annual plant development and it is characterized by well-orchestrated degradation and remobilization processes. Leaf N and other soluble constituents are mobilized from the degrading photosynthetic apparatus (Chl breakdown) to the seeds after anthesis (Hörtensteiner & Kräutler 2010; Bieker & Zentgraf 2013; Li-Hong et al. 2007). N retained from wheat leaves, in particular from the flag leaf and the upper canopy, accounts for up to 90% of the total grain N content (Kichey et al. 2007; Wang et al. 2005). Senescence is triggered by endogenous signals, e.g. plant growth regulators and hormone levels, but also by exogenous factors, such as drought, waterlogging, high soil salinity, mineral nutrition deficiency, high or low solar radiation, and extreme temperatures (Thomas & Stoddart 1980; Smart 1994; Edwards et al. 2012).
spectrum, relatively high amounts of radiation are reflected due to light scattering induced by cell structure, lack of absorbing features, and light transmission feedback of lower leaf layers (Mestre 1935; Knipling 1970; Penuelas & Filella 1998). With the onset and progress of senescence, Chl is degraded much faster than carotenoids, which causes reflectance to increase in the red spectrum, while in the blue spectrum only a small increase of reflectance is observed (Knipling 1970; Penuelas et al. 1995; Wilson et al. 2014; Sanger 1971; Verdebout et al. 1994; Gitelson et al. 2002; Zur et al. 2000). With the advancement of senescence, degradation processes form metabolites (polyphenols, denatured proteins, “brown pigments”), which visually evoke a brownish color and which were reported to absorb light in the visual and red-edge/NIR region (400-800 nm) (Verdebout et al. 1994; Penuelas & Filella 1998). The decrease of NIR reflectance during senescence is induced by the breakdown of cell structures, which decreases light scattering properties, e.g. mesophyll and intercellular space, and furthermore reduces the feedback of transmitting radiation in the subsequent canopy layers (Knipling 1970).
The Normalized Difference Vegetation Index (NDVI) is based on the above mentioned distinctive reflectance characteristics of plants in the red and near-infrared (NIR) region of the spectrum, thereby showing strong correlations to the amount of photosynthetically active vegetation and biomass (Tucker 1979). NDVI has been shown to be a good predictor of LAI (Viña et al. 2011; Gitelson et al. 2003; Colombo et al. 2003). However, it is known that NDVI saturates at moderate to high LAI values (ca. >2-3), exhibiting asymptotic relationships between these two variables (Viña et al. 2011, Hatfield et al. 2008; Serrano et al. 2000).
Merzlyak et al. (1999) developed the Plant Senescence Reflectance Index (PSRI), which was found to be responsive to changes in the carotenoid-chlorophyll ratio of senescing leaves, and therefore was proposed to be used to estimate the onset, the stage, and the relative rates and kinetics of senescence or ripening processes. Hatfield et al. (2010) found PSRI very suitable to detect differences in plant senescence across fields. Further, by comparing the change rate of the canopy from green to senescent, PSRI can be used to determine the rate of senescence in different crops.
An alternative approach to the use of indices for deriving biophysical properties of surface features from satellite imagery is the Tasseled Cap Transformation (Kauth & Thomas 1976). The Tasseled Cap Transformation assigns fixed weights to the original reflectance values of the individual spectral bands to
generate transformed features, which can directly be associated with biophysical properties of surface features, e.g. the brightness or moisture variation of surface objects. TCFs were developed for several sensors, such as Landsat (Kauth & Thomas 1976; Crist & Cicone 1984; Huang et al. 2002; Baig et al. 2014), SPOT (Ivits et al. 2008), IKONOS (Horne 2003) and RapidEye (Schönert et al. 2014).
The TCFs for RapidEye data were derived from spectral variances typically present in agricultural scenes (Schönert et al. 2014). The first TCF, Brightness, was aligned to correspond with the variance of soil brightness. The second TCF, Greenness (GRE), corresponds to the direction of the spectral variation of vital vegetation, and therefore, represents the typical reflectance characteristics of green vegetation, with relatively higher reflectance at the NIR range. Yellowness (YEL), the third TCF, shows a contrast between the Blue + Green bands, and the Red + Red Edge + NIR bands. YEL corresponds to the reflectance characteristics of senescent crops, which generally show higher reflectance at the visual spectrum due to chlorophyll breakdown, and lower reflectance at the NIR range due to cell structure decomposition.
The aim of this work was first, to assess the suitability of RapidEye’s TCFs GRE and YEL for estimating the biophysical parameters LAI, Chl, and N of agricultural crops; and second, to evaluate the performance of TCFs in comparison with the commonly used indices PSRI and NDVI.
2. MATERIALS AND METHODS
2.1 Study Area
The analysis was carried out in two study areas. The first study area, located in the federal state of Saxony-Anhalt, Germany (11°54′E, 51°47′N), is intensively used for agriculture due to the predominance of Chernozem soils. Within the study area, one winter wheat (Triticum aestivum L) field with a size of 90 ha was selected. The second study area was in the Palouse region of Northern Idaho (46°30′N, 116°49′W) and Eastern Washington (46°46′N, 117°05′W; 46°47′N, 117°26′W) USA. These study sites are managed as no-till and have silt load soils developed in loess deposits with some ash. All three USA farms are completely rain fed and have precipitation ranging from 330-610 mm annually (Soil Survey Staff 2014).
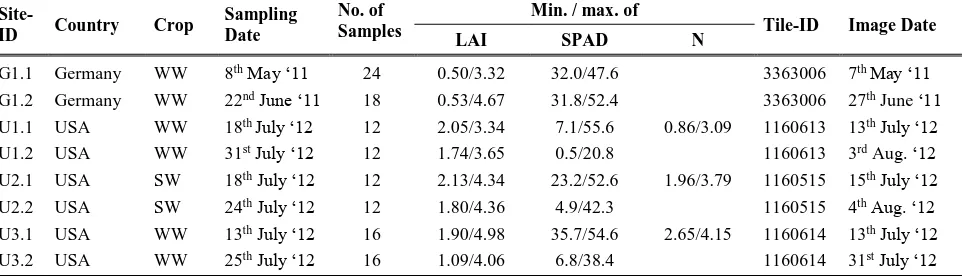
Table 1. Ground reference data of leaf area index (LAI), chlorophyll (SPAD) and nitrogen (N) concentration of winter (WW) and summer wheat (SW) and corresponding RapidEye imagery. Site-ID is coded according to country, field and date, e.g. G1.1 means: Germany, field 1, 1st date; U=USA
Site-ID Country Crop
Sampling Date
No. of Samples
Min. / max. of
Tile-ID Image Date
LAI SPAD N
G1.1 Germany WW 8thMay ‘11 24 0.50/3.32 32.0/47.6 3363006 7th May ‘11
G1.2 Germany WW 22ndJune ‘11 18 0.53/4.67 31.8/52.4 3363006 27th June ‘11 U1.1 USA WW 18th July ‘12 12 2.05/3.34 7.1/55.6 0.86/3.09 1160613 13thJuly ‘12
U1.2 USA WW 31stJuly ‘12 12 1.74/3.65 0.5/20.8 1160613 3rd Aug. ‘12
U2.1 USA SW 18thJuly ‘12 12 2.13/4.34 23.2/52.6 1.96/3.79 1160515 15thJuly ‘12
U2.2 USA SW 24thJuly ‘12 12 1.80/4.36 4.9/42.3 1160515 4thAug. ‘12
U3.1 USA WW 13thJuly ‘12 16 1.90/4.98 35.7/54.6 2.65/4.15 1160614 13thJuly ‘12
2.2 Satellite Imagery
The RapidEye satellite system is a constellation of five identical earth observation satellites with the capability to provide large area, multi-spectral images with frequent revisits in high resolution (6.5 m at nadir). In addition to the Blue (B) (440-510 nm), Green (G) (520-590 nm), Red (R) (630-685 nm) and near-infrared (NIR) (760-850 nm) bands, the sensor has a Red-edge (RE) (690-730 nm) band, especially suitable for vegetation analysis (s. Eitel et al. 2007). The RapidEye level 3A standard product covers an area of 25x25 km, is radiometrically calibrated to radiance values (Anderson et al. 2013), and is ortho-rectified and resampled to 5 m spatial resolution. All the images used in this study (Tab. 1) were calibrated to top of atmosphere reflectance. Due to atmospheric influences the Blue band of the scene corresponding to site-ID G1.1 was noisy and therefore treated with a noise removal based on the Maximum Noise Fraction approach.
2.3 Field Measurements and Data Extraction
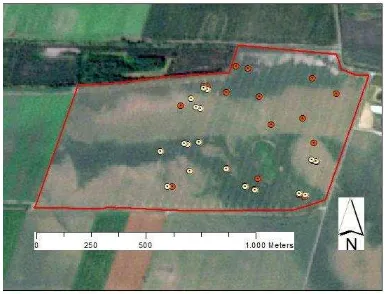
In Germany, field data collection included leaf area index (Licor LAI-2200©, Delta-T Sunscan©) and leaf chlorophyll meter readings at the upper canopy (Minolta SPAD-502©). SPAD measurements represent unit-less relative values, which have been proven to be positively correlated to chlorophyll content of wheat (Reeves et al. 1993) and other crops (Zhu et al. 2012). Ground reference data were gathered at winter wheat stem elongation (8th May) and early ripening stages (22nd June). Sample locations were defined aiming at covering the entire crop variability within the field as described in Siegmann et al. (2013) (Fig. 1). Due to extreme dry weather conditions in early summer 2011, some areas of the field were affected by premature ripening (Fig. 1).
Figure 1. Test site with the sampling locations measured on 8th of May (dark points) and 27th of June 2011 (light points). The background image from the 27th of June shows the early ripening areas in brownish tones.
In the USA, LAI and SPAD measurements were collected similarly and sample dates nearest to image acquisition were chosen. The average of twelve SPAD values from fully-expanded upper leaves and four LAI measurements within a 1 m2 location at each ground point were used in analysis. Leaf nitrogen concentration (%N) was also averaged from twelve top of canopy leaf samples processed by dry combustion. Due to the highly heterogeneous nature of the hilly Palouse, wide differences in SPAD, %N and LAI were observed during these time periods (Tab. 1).
used to calculate mean GRE, YEL, PSRI, and NDVI values for each point.
2.4 Spectral Indices
GRE, YEL (Schönert et al. 2014), NDVI (Rouse et al. 1973), and PSRI (Merzlyak et al. 1999) were calculated by
� = − . × B − . × G − . ×
R − . × RE + . × NIR (1)
� � = − . × B − . × G + . × R +
. × RE + . × NIR (2)
� �� = ���−����+� (3)
� � = �−���� (4)
where B, G, R, RE and NIR represent the values of Blue, Green, Red, Red-edge, and NIR bands respectively.
NDVI and GRE were compared to one another regarding their relationship to measured LAI, Chl, and N in vital wheat (site G1 and U3.1). The comparison of the PSRI and YEL focused on assessing the performance of estimating Chl and N in senescent wheat (G1.2, U1, U2 and U3.2).
3. RESULTS AND DISCUSSION
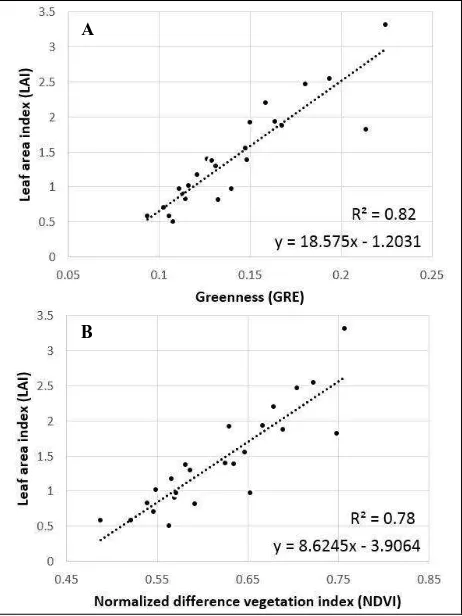
All correlations (r) related to LAI were statistically significant (p = 0.01), and ranged from 0.79 to 0.91 (Tab. 2). In Germany (sites G1.1 and G1.2), LAI was strongly correlated with NDVI and GRE, while GRE showed higher coefficients of determination (R2) at both dates (Tab. 2). In the USA (site U3.1), NDVI and GRE were only moderately correlated to LAI, with GRE performing slightly better than NDVI (Tab. 2). As an example, Figure 2 shows the linear relationship of GRE (A) and NDVI (B) to LAI at test site G1.1. The higher correlation of NDVI and GRE with LAI observed at the German test sites (G1.1, G1.2) compared to USA (U3.1), can most likely be attributed to the lack of the saturation effect in the Germany sites. In Germany, LAI ranged from 1.4 to 2.3; whereas in the USA, it ranged from 1.9 to 5. Based on the observations made, GRE seems to provide similar, if not better estimations of LAI compared to NDVI in vital crops.
Table 2. Coefficient of determination of leaf area index (LAI), chlorophyll (SPAD) and nitrogen (N) concentration, Greenness (GRE) vs. NDVI.
Site-ID Crop
Tested Index
Coefficient of Determination (R2) for
LAI SPAD N
G1.1 WW GRE 0.82 0.25*
NDVI 0.78 0.25*
G1.2 WW GRE 0.79 0.23*
NDVI 0.76 0.31*
U3.1 WW GRE 0.63 0.70 0.52
NDVI 0.62 0.69 0.56
* not significantly correlated at level of confidence p=0.01
GRE over NDVI, while NDVI performed better at the estimation of N at site U3.1 (Tab. 2). The poor performance of GRE and NDVI as estimators of Chl measurements in Germany might be explained by the small range of SPAD values.
Figure 2. Linear regression of GRE (A) and NDVI (B) to LAI measurements at sample site G1.1.
In most cases, YEL and PSRI showed a strong linear relationship to Chl concentration in senescent wheat (Tab. 3). YEL yielded higher R2 values than PSRI for all fields with winter wheat (U1, U3 and G1), whereas PSRI showed higher predictive potential at test site U2, where summer wheat was sown (Tab. 3). Generally, correlations were significant, except for PSRI at G1.2 and YEL at U2.1. At site U1.1 (winter wheat location), YEL explained approximately 16% more of the total variance compared to the PSRI (Fig. 3), whereas, at the latest senescence stage (U1.2) the estimation capacity of both indices were comparable (Tab. 3). At the summer wheat farm (U1), both indices performed poorly at the first date (U1.1), although PSRI yielded a significant correlation, while YEL did not (p = 0.01) (Tab. 3). It has to be mentioned that at site U2.2, images were acquired 11 days after the ground sampling. Changes in crop senescence during this time could have been drastic enough to make the satellite data information inconsistent with the ground measurements. In some areas of test site G1.2, crops were in a premature ripening stage, while others were in a vital condition (Fig. 1). After excluding nine vital crop samples, YEL showed a significant correlation of r = -0.84 in contrast to the PSRI, and was linearly related to Chl concentration with an R2 = 0.71. Similarly, two green samples were excluded from the correlation analysis at U3.2. However, only moderate R2 values were observed (Tab. 3).
Table 3. Coefficient of determination of leaf area index (LAI), chlorophyll (SPAD) and nitrogen (N) concentration, Yellowness (YEL) vs. PSRI.
Site-ID Crop
Tested Index
Coefficient of Determination (R2)
for
LAI SPAD N
G1.2** WW YEL 0.59* 0.71
PSRI 0.68 0.61*
U1.1 WW YEL 0.24* 0.77 0.77
PSRI 0.16* 0.61 0.57
U1.2 WW YEL 0.04* 0.84
PSRI 0.01* 0.83
U2.1 SW YEL 0.19* 0.45* 0.74
PSRI 0.21* 0.53 0.37*
U2.2 SW YEL 0.05* 0.78
PSRI 0.10* 0.89 U3.2** WW YEL 0.06* 0.60 PSRI 0.12* 0.56
*not significantly correlated at level of confidence p=0.01 ** Some vital vegetation ground reference measurements excluded
Figure 3. Linear regression of YEL (A) and PSRI (B) to Chl measurements at sample site U1.1.
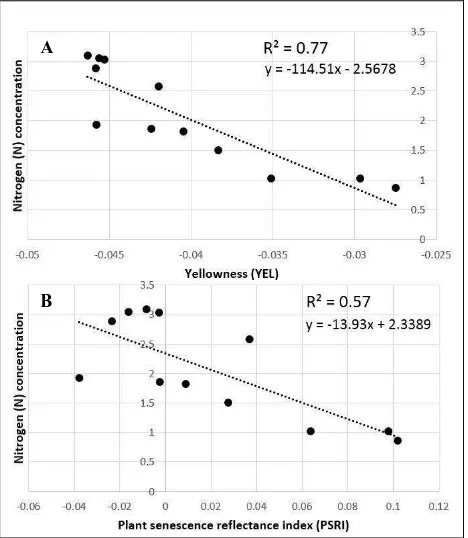
For the estimation of N concentration in senescent crops, YEL yielded significant correlations at site U1.1 and U2.1 with r = -0.88 and r = -0.86, respectively, while the PSRI was only significantly correlated to N concentration (r = -0.76) at site U1.1. Results revealed that YEL, compared to the PSRI, provided higher R2 values for the estimation of N concentration (Tab. 3, Fig. 4).
B
A
Figure 4. Linear regression of YEL (A) and PSRI (B) to N measurements at sample site U1.1.
Studies investigating the influence of varying N concentration on green canopy spectral reflectance properties have shown that variations of N concentration positively correlate with Chl concentration, which in turn is one of the key drivers of the reflectance properties of plants in the visible part of the spectrum (Evans 1983; Moorby & Besford 1983; Thomas & Oerther 1972; Knipling 1970). Thus, the N status of vital, green crops has been estimated using the relationship between vegetation indices and LAI, which corresponds to canopy Chl content (LAI × Chl) (Filella et al. 1995; Johnson 2001; Penuelas et al. 1994; Serrano et al. 2000; Zhao et al. 2005).
Even though the senescent crops investigated in this study showed different optical properties than vital crops, the field measurements indicated that the N-Chl dependency mentioned above was still present, explaining the correlations found. The significant r of YEL to N observed at site U2.1, despite the non-significant r to Chl concentration (p = 0.01), might indicate that other optical properties, which might have been masked by the strong absorbing features of Chl in a vital status, contribute to the YEL-N relationship (Tab. 3). The greater potential of YEL for the estimation of N might be attributed to the inclusion of the Red-edge band, which is more sensitive to a wider range of Chl than the Red and Green bands used in the PSRI. Red reflectance is a poor predictor of low to high levels of Chl or N, since it saturates at low Chl levels (Gitelson & Merzlyak 1998; Gitelson et al. 1996; Eitel et al. 2011). Also, several studies suggested that the wavelength in the red-edge region is superior to the green in regards to its responsiveness to stress induced changes in Chl (e.g. Carter & Knapp 2001; Eitel et al. 2011).
No significant correlations of the indices YEL and PSRI to LAI were observed at the level of confidence p = 0.01, with the exception of site G1.2, where the PSRI showed a significant correlation of r = -0.82 and a high R2 of 0.68 (Tab. 3). These results could be explained by the changing reflectance characteristics of senescent wheat. In many studies, the retrieval
e.g. NDVI or Enhanced Vegetation Index (EVI), because strongest correlations of LAI to these spectral regions were observed (Holben et al. 1980; Kimes et al. 1981; Houborg & Boegh 2008, Viña et al. 2011). With the progress of senescence, crops increase their reflectance in the red electromagnetic spectrum due to Chl degradation and decrease reflectance in the NIR region due to cell structure decomposition, which in turn might negatively influence the sensitivity of the spectral indices to LAI. Additionally, even though LAI decreases a bit, it does not change significantly when crops become senescent and therefore, no correlations of YEL and PSRI to LAI were observed.
Figure 5. Map of potential within field senescence patterns (above) and corresponding RGB RapidEye image (below) at site U1.1. A selection of ground reference samples are denoted by black circles. Red and yellow colors indicate an advanced state of senescence (lower chlorophyll (SPAD) and nitrogen (N) concentration), while green colors indicate a less advanced senescence status.
Hatfield et al. (2010) showed that PSRI was sensitive to changes in LAI at the onset and during the senescence phase, and A
B
SPAD = 7.1, N = 1.02
SPAD = 48, N = 3.03
SPAD = 12.5, N = 0.86
G1.2 (Tab. 3), which was affected by premature ripening, confirms the findings of Hatfield et al. (2010). However, at all other senescence stages present at the sites U1, U2, and U3, no significant relationship between LAI and PSRI was observed. Interestingly, PSRI and YEL showed an inverse relationship to Chl and LAI at site G1.2 (Tab. 3), suggesting that PSRI responds closely to structural properties, while YEL, to pigment-based biophysical properties. Also, regression analysis at site U1.1 revealed that measurement points were closer to the line of best fit for YEL, compared to PSRI (Fig. 3), suggesting that YEL is more sensitive to capture changes in pigment concentration. The TCFs are basically a weighted sum of all bands, which means that potentially all information contained in the discrete bands, characterizing a particular feature, e.g. vital or senescent vegetation, are considered. Vegetation indices on the other hand tend to use only few bands. This might explain the relative advantage of the TCFs compared to simple band ratios, such as NDVI or PSRI.
As mentioned in the introduction, determining Chl and/or N post anthesis could be useful to estimate senescence variations of crops within a field (crop drying patterns), which might be indicative of yield and crop quality conditions. Spatial variations of senescence within fields can potentially be mapped and used as additional information for the delineation of harvesting zones. Figure 5 illustrates an example of a map of YEL values at site U1.1, potentially depicting senescence patterns within this field. For comparison, the corresponding RGB image is displayed below the map. Black circles show the values of some ground reference measurements of Chl (SPAD) and nitrogen (N) concentration. In the map, areas coded with red and yellow colors are relatively low in Chl and N, and therefore, most likely to be in a more advanced senescence state compared to areas marked by green colors (relatively high Chl and N concentration).
4. CONCLUSION
The results of this preliminary study demonstrated that the TCFs of the RapidEye sensor offer great potential for the retrieval of crop biophysical parameters, such as LAI, Chl and N. GRE has been proven to be a good estimator of LAI in vital crops, especially for LAI values below 3, and it yielded a higher coefficient of determination than the NDVI for test sites in Germany and the USA. YEL and PSRI showed strong linear relationships to the Chl concentration in senescent wheat. However, the prediction power of YEL was greater for winter wheat, while for summer wheat, PSRI provided better results. For the prediction of N in senescent crops, YEL outperformed PSRI, showing statistically significant, strong correlations, while PSRI provided only moderate or non-significant relationships. Results demonstrated the capability of YEL to predict both Chl and N concentration, probably attributable to the additional information provided by the Red-edge band. This makes RapidEye a useful tool for understanding and mapping the variability of Chl or N concentrations, and senescence patterns within individual fields. In conjunction with soil fertility and yield maps, senescence patterns might aid in the assignment of precision harvesting zones related to yield and wheat quality parameters.
Further studies on the relationship between YEL and Chl and N concentration are needed to corroborate these results, and make them extensive to other crop types or cultivars. Furthermore, research should be focused on in-field senescence pattern variations, microclimatic conditions, and their impact on the amount of yield and yield quality parameters.
5. ACKNOWLEDGEMENT
The authors wish to express their appreciation to the Julius-Kühn-Institut (Federal Research Centre for Cultivated Plants in Germany) and the Institute for Geoinformatics and Remote Sensing of the University of Osnabrueck for kindly supplying the field data used in this study, based on the “Hyland” project supported under code 50 EE 1014. Further, we kindly thank the Geospatial Laboratory for Environmental Dynamics, University of Idaho for the provision of ground reference data. The ground data collection in Idaho was supported by USDA-NIFA Award Nos. 2011-67003-3034 and 2011-68002-30191.
REFERENCES
Anderson, C.; Thiele, M.; Brunn, A. 2013. Calibration and validation of the RapidEye constellation. In: Anais XVI Simpósio Brasileiro de Sensoriamento Remoto - SBSR, Foz do Iguaçu, PR, Brasil, 13 a 18 de abril de 2013.
Baigab, M. H. A.; Zhanga, L.; Shuaiab, T.; Tonga, Q. 2014. Derivation of a tasselled cap transformation based on Landsat 8 at-satellite reflectance. In: Remote Sensing Letters 5(5): 423-431.
Basso, B., Bertocco, M., Sartori, L., Martin, E.C., 2007. Analyzing the effects of climate variability on spatial pattern of yield in a maize-wheat-soybean rotation. In: Eur. J. Agron. 26, 82–91.
Bieker, Stefan; Zentgraf, Ulrike 2013. Plant Senescence and Nitrogen Mobilization and Signaling. In: Senescence and Senescence-Related Disorders, 53-83.
Buttafuoco, G., Castrignanò, A., Colecchia, A.S., Ricca, N., 2010. Delineation of management zones using soil properties and a multivariate geostatistical approach. In: Ital. J. Agron. 4, 323– 332.
Carter, G. A. & Knapp, A. K. 2001. Leaf optical properties in higher plants: linking spectral characteristics to stress and chlorophyll concentration. American Journal of Botany 88, 677-684.
Colombo, R.; Bellingeri, D.; Fasolini, D.; Marino, C. M. 2003. Retrieval of leaf area index in different vegetation types using high resolution satellite data. In: Remote Sensing of Environment 86(1): 120-131.
Crist, Eric P. & Cicone, Richard C. 1984. A Physically-Based Transformation of Thematic Mapper Data – The TM Tasseled Cap. In: Transactions on Geoscience and Remote Sensing GE-22(3): 256-263.
Diaconoa, M.; Castrignanòb, A.; Troccolic, A.; De Benedetto, D.; Basso, B.; Rubino, P. 2012. Spatial and temporal variability of wheat grain yield and quality in a Mediterranean environment: A multivariate geostatistical approach. In: Field Crops Research 131: 49-62.
Edwards, Kieron D.; Humphry, Matt; Sanchez-Tamburrino, Juan P. 2012. Advances in Plant Senescence. In: Senescence, 117-136.
Eitel, J.U.H.; Long, D.S.; Gessler, P.E.; Smith, a. M.S. 2007. Using in‐situ measurements to evaluate the new RapidEye TM satellite series for prediction of wheat nitrogen status. In: Int. J. Remote Sens. 28, 4183–4190.
Broadband, red-edge information from satellites improves early stress detection in a New Mexico conifer woodland. In: Remote Sens. Environ. 115, 3640–3646.
Evans, J. R. 1983. Nitrogen and Photosynthesis in the Flag Leaf of Wheat (Triticum aestivum L.). In: Plant Physiology 72(2): 297–302.
Filella, I.; Serrano, L.; Serra, J.; Peñuelas, J. 1995. Evaluating Wheat Nitrogen Status with Canopy Reflectance Indices and Discriminant Analysis. In: Crop Science 35(5): 1400-1405.
Freeman, K. W.; Raun, W. R.; Johnson, G. V.; Mullen, W. R. ; Stone, M. L.; Solie, J. B. 2003. Late-Season Prediction of Wheat Grain Yield and Grain Protein. In: COMMUNICATIONS IN SOIL SCIENCE AND PLANT ANALYSIS 34(13&14): 1837-1852.
Gates, David M.; Keegan, Harry, J.; Schleter, John C.; Weidner Victor R. 1965: Spectral Properties of Plants. In: Applied Optics 4(1): 11-20.
Gitelson, A. A.; Merzlyak, M. N.; Lichtenthaler, H. K. 1996. Detection of red edge position and chlorophyll content by reflectance measurements near 700 nm. In: Journal of Plant Physiology, 148, 501-508.
Gitelson, A. A.; Merzlyak, M. N.; Grits, Y. 1998. Remote sensing of chlorophyll concentration in higher plant leaves. In: Advances in Space Research, 22, 689−692.
Gitelson, A. A.; Zur, Y.; Chivkunova, O. B.; Merzlyak, M. N. 2002. Assessing Carotenoid Content in Plant Leaves with Reflectance Spectroscopy. In: Photochemistry and Photobiology 75(3): 272-281.
Gitelson, Anatoly A.; Viña, Andrés; Arkebauer, Timothy J.; Rundquist, Donald C.; Keydan, Galina; Leavitt, Bryan 2003. Remote estimation of leaf area index and green leaf biomass in maize canopies. In: Geophysical Research Letters 30(5): 52-1 - 52-4.
Haboudane, Driss; Miller, John R.; Pattey, Elizabeth; Zarco-tejada, Pablo J.; Strachan, Ian B. 2004. Hyperspectral vegetation indices and novel algorithms for predicting green LAI of crop canopies: Modeling and validation in the context of precision agriculture. In: Remote Sensing of Environment 90(3): 337-352.
Hatfield, J. L.; Gitelson, A. A.; Schepers, J. S.; Walthall, C. L. 2008. Application of Spectral Remote Sensing for Agronomic Decisions. In: Agronomy Journal 100(3): S-117-S-131.
Hatfield, J.L.; Prueger, J.H. 2010. Value of Using Different Vegetative Indices to Quantify Agricultural Crop Characteristics at Different Growth Stages under Varying Management Practices. In: Remote Sensing 2(2): 562-578.
Hörtensteiner, S.; Kräutler B. 2010. Chlorophyll breakdown in higher plants. In: Biochimica et Biophysica Acta (BBA) - Bioenergetics 1807(8): 977-988.
Holben, B.N., Tucker, C.J., Fan, C.J., 1980. Spectral assessment of soybean leaf area and leaf biomass. Photogrammetric Engineering and Remote Sensing 46 (5), 651–656.
Horne, James H. (2003): A Tasseled Cap Transformation for
Houborg, R. & Boegh, E. 2008. Mapping leaf chlorophyll and leaf area index using inverse and forward canopy reflectance modeling and SPOT reflectance data. In: Remote Sensing of Environment 112(1): 186-202.
Huang, Chengquan; Wylie, Bruce; Yang, Limin; Homer, Collin; Zylstra, Gregory 2002. Derivation of a Tasseled Cap Transformation based on Landsat 7 at-satellite reflectance. In: International Journal of Remote Sensing 23(8): 1741-1748.
Ibrahim, Hesham M.; Huggins, David R. 2011. Spatio-temporal patterns of soil water storage under dryland agriculture at the watershed scale. In: Journal of Hydrology 404(3–4): 186-197.
Ivits, Eva; Lamb, Alistair; Langar, Filip; Hemphill, Scott, Koch, Barbara 2008. Orthogonal Transformation of Segmented SPOT5 Images: Seasonal and Geographical Dependence of the Tasseled Cap Parameters. In: Photogrammetric Engineering and Remote Sensing 74(11): 1351-1364.
Johnson, L. 2001. Nitrogen Influence on Fresh-leaf NIR Spectra. In: Remote Sensing of Environment 78(3): 312-318.
Kauth, R. J. & Thomas, G. S. 1976. The Tasseled Cap – a graphic description of the spectral-temporal development of agricultural crops as seen by LANDSAT. In: Proceedings of the Symposium on Machine Processing of Remotely Sensed Data. Pages 4B41-4B51.
Kichey, T.; Hirel, B.; Heumez, E.; Dubois, F.; Le Gouis, J. 2007. In winter wheat (Triticum aestivum L.), post-anthesis nitrogen uptake and remobilisation to the grain correlates with agronomic traits and nitrogen physiological markers. In: Field Crop Research 102(1): 22-32.
Kimes, D.S.; Markham, B.L.; Tucker, C.J.; McMurtrey, J.E. III. 1981. Temporal relationships between spectral response and agronomic variables of a corn canopy. In: Remote Sensing of Environment 11(5): 401-411.
Knipling, Edward B. 1970. Physical and Physiological Basis for the Reflectance of Visible and Near-Infrared Radiation from Vegetation. In: Remote Sensing of Environment 1(3): 155-159.
Kross, A.; McNairn, H.; Lapen, D.; Sunohara, M.; Champagne, C. 2015. Assessment of RapidEye vegetation indices for estimation of leaf area index and biomass in corn and soybean crops. In: International Journal of Applied Earth Observation and Geoinformation 34: 235-248.
Lukina, E. V.; Freeman, K. W.; Wynn, K. J.; Thomason, W. E.; Mullen, R. W.; Stone, M. L.; Solie, J. B.; Klatt, A. R.; John, G. V.; Elliott, R. L.; Raun, W. R. 2001. Nitrogen Fertilization Optimization Algorithm Based on In-Season Estimates of Yield and Plant Nitrogen Uptake. In: Journal of Plant Nutrition 24(6): 885-898.
Merzlyak, J. "Non-destructive Optical Detection of Pigment Changes During Leaf Senescence and Fruit Ripening." In: Physiologia Plantarum 106(1999): 135-141.
Mestre, Harold 1935. The absorption of radiation by leaves and algae. In: Photochemical Reactions. Volume 3: 191-209.
Moorby J. & Besford R. T. 1983. Mineral nutrition and growth. In: Encyclopedia of Plant Physiology Vol. 15 B: 481-515.
Morari, F.; Loddo, S.; Berzaghi, P.; Ferlito, J.C.; Berti, A.; Sartori, L.; Visioli, G.; Marmiroli, N.; Piragnolo, D.; Mosca, G. 2013. Understanding the effects of site-specific fertilization on yield and protein content in durum wheat. In: Precision agriculture ’13. 321-327.
Penuelas, J.; Gamon, J.A.; Freeden, A.; Merino, J.; Field, C. 1994. Reflectance indices associated with physiological changes in N- and water-limited sunflower leaves. In: Remote Sens. Environ. 46: 100–118.
Penuelas, J.; Baret, F.; Filella, I. 1995. Semi-empirical indices to assess carotenoids/chlophyll a ratio from leaf spectral reflectance. In: Photosynthetica 31(2): 221-230.
Penuelas, J. & Filella, I. 1998. Visible and near-infrared reflectance techniques for diagnosing plant physiological status. In: Trends in Plant Science 3(4): 151-156.
Reeves, D.W.; Mask, P.L.; Wood, C.W.; Delano, D.P. 1993. Determination of Wheat Nitrogen Status with Hand-held Chlorophyll Meter: Influence of Management Practices. In: Journal Plant Nutrition, 16: 781–796.
Rouse, J.W., Haas, R.H., Schell, J.A., Deering, D.W., 1973. Monitoring vegetation systems in the Great Plains with ERTS, Third ERTS Symposium, NASA SP-351 I, 309-317.
Sanger, Jon E. 1971. Quantitative Investigations of Leaf Pigments From Their Inception in Buds Through Autumn Coloration to Decomposition in Falling Leaves. In: Ecology 52(6): 1075-1089.
Schönert, M.; Weichelt, H.; Zillmann, E.; Jürgens, C. 2014. Derivation of Tasseled Cap Coefficients for RapidEye data. In: Michel, Ulrich; Schulz, Karsten (Ed.): Earth Resources and Environmental Remote Sensing/GIS Applications V. Proc. SPIE 9245.
Serrano, L.; Filella, I.; Peñuelas, J. 2000. Remote Sensing of Biomass and Yield of Winter Wheat under Different Nitrogen Supplies. In: Crop Science 40(3): 723-731.
Siegmann, B., Jarmer, T., Lilienthal, H., Richter, N., Selige, T., Höfle, B., 2013. Comparison of narrow band vegetation indices and empirical models from hyperspectral remote sensing data for the assessment of wheat nitrogen concentration. In: Proc. 8th EARSeL SIG IS workshop, Nantes, France.
Smart, C. M. (1994) Gene expression during leaf senescence. In: New Phytologist 126(3): 419-448.
Soil Survey Staff, Natural Resources Conservation Service, United States Department of Agriculture. Web Soil Survey. Available online at http://websoilsurvey.nrcs.usda.gov/. Accessed [03/20/2014].
Strong, W.M. 1981. Nitrogen requirements of irrigated wheat in the Darling Downs. In: Australian Journal of Experimental Agriculture and Animal Husbandry 21(111): 424-431.
Thomas, H. & Stoddart, J. L. 1980. Leaf senescence. In: Annual Review of Plant Physiology 31: 83–111.
Thomas J. R & Oerther, G. F. 1972. Estimating nitrogen content of sweet pepper leaves by reflectance measurements. In: Agron. J. 64: 11-13.
Tucker, J. C. 1979. Red and photographic infrared linear combinations for monitoring vegetation. In: Remote Sensing of Environment 8(2): 127-150.
Verdebout, Jean; Jacquemoud, Stephane; Schmuck, Guido 1994. Optical Properties of Leaves: Modelling and Experimental Studies. In: Imaging Spectrometry - a Tool for Environmental Observations: 169-191.
Viña, A.; Gitelson, A. A.; Nguy-Robertson, A. L.; Peng, Y. 2011. Comparison of different vegetation indices for the remote assessment of green leaf area index of crops. In: Remote Sensing of Environment 115(12): 3468-3478.
Wang, Z.; Wang, J.; Zhao, C.; Zhao, M.; Huang, W.; and Wang, C. 2005. Vertical Distribution of Nitrogen in Different Layers of Leaf and Stem and their Relationship with Quality of Winter Wheat. In: Journal of Plant Nutrition 28(1): 73-91.
Wilson, J.H.; Zhang, C.; Kovacs, J.M. 2014. Separating Crop Species in Northeastern Ontario Using Hyperspectral Data. In: Remote Sensing 6(2): 925-945.
Wright, D. L.; Rasmussen, V. P.; Ramsey, R. D.; Baker, D. J.; Ellsworth J. W. 2004. Canopy Reflectance Estimation of Wheat Nitrogen Content for Grain Protein Management. In: GIScience and Remote Sensing 41(4): 287-300.
Wu, J.; Wang, D.; Bauer, M. E. 2007. Assessing broadband vegetation indices and QuickBird data in estimating leaf area index of corn and potato canopies. In: Field Crops Research 102(1): 33-42.
Zhao, D.; Reddy, K.R.; Kakani, V.G.; Read, J.J.; Koti, S. 2005. Selection of optimum reflectance ratios for estimating leaf nitrogen and chlorophyll concentrations of field-grown cotton. Agron. J. 97(1): 89-98.
Zhu, J.; Tremblay, N.; Liang, Y.; 2012. Comparing SPAD and atLEAF values for chlorophyll assessment in crop species In: Canadian Journal of Soil Science 92: 645-648.