Full Terms & Conditions of access and use can be found at
http://www.tandfonline.com/action/journalInformation?journalCode=vjeb20
Download by: [Universitas Maritim Raja Ali Haji] Date: 13 January 2016, At: 00:29
Journal of Education for Business
ISSN: 0883-2323 (Print) 1940-3356 (Online) Journal homepage: http://www.tandfonline.com/loi/vjeb20
The Effects of Using In-Class Focus Groups on
Student Course Evaluations
Diane M. Hamilton , Robert E. Pritchard , Carol N. Welsh , Gregory C. Potter &
Michael S. Saccucci
To cite this article: Diane M. Hamilton , Robert E. Pritchard , Carol N. Welsh , Gregory C. Potter & Michael S. Saccucci (2002) The Effects of Using In-Class Focus Groups on Student Course Evaluations, Journal of Education for Business, 77:6, 329-333, DOI: 10.1080/08832320209599684
To link to this article: http://dx.doi.org/10.1080/08832320209599684
Published online: 31 Mar 2010.
Submit your article to this journal
Article views: 42
View related articles
The Effects of Using
In-Class Focus Groups on
Student Course Evaluations
DIANE M. HAMILTON
ROBERT E. PRITCHARD
CAROL N. WELSH
GREGORY C. POTTER
zyxwvutsrqponmlkjihgfedcbaZYXWVUTSRQPONMLKJIHGFEDCBA
Rowan
UniversityzyxwvutsrqponmlkjihgfedcbaZYXWVUTSRQPONMLKJIHGFEDCBA
Glassboro,
New JerseyMICHAEL S. SACCUCCI
27
Centennial Drive ExtensionRichfield,
Connecticut he use of focus groups in Princi-T
ples of Finance (Principles) began as part of a regional university’s effort to capture student feedback that was not provided by the Educational TestingService’s SIR
zyxwvutsrqponmlkjihgfedcbaZYXWVUTSRQPONMLKJIHGFEDCBA
I1 student evaluation form. Instructors conducted focusgroups to elicit student suggestions for improving the course. Students general- ly offered constructive suggestions that were incorporated into the course. Fur- thermore, students’ satisfaction with the course (as measured by their course evaluations) became more positive when the focus groups were used and changes implemented.
Intrigued by the changes in the level of students’ satisfaction with the course, faculty members decided to design a study to determine whether the changes in students’ perceptions resulted from the changes made to the course or from the involvement of students in the focus groups. That is, were the changes in the levels of student satisfaction a result of the Hawthorne Effect? In this article, we describe the study and the results.
Literature Review
Student evaluations are a standard procedure for measuring the effective- ness of the teaching and learning process. Indeed, they are often an important factor in tenure and promo-
ABSTRACT. In this study, the authors investigated the effect of stu- dent focus groups on student satisfac- tion with the Principles of Finance course at a regional university. The
authors used student course evalua-
tions from four day sections taught by the same instructor during 1 semester.
Two of the sections used focus groups,
and student-recommended changes were implemented in all four sections. Students enrolled in the two sections
that used focus groups indicated high-
er levels of satisfaction with the course compared with the students in the con-
trol sections. The authors discuss how
this result could be related to the Hawthorne Effect.
tion decisions at most universities. The importance of student input in the teach- ing and learning process has been wide- ly studied, although the use of student focus groups to gather that input is a rel- atively new occurrence. Paulsen and Feldman (1995) studied the use of infor- mative feedback in improving teaching and learning in a higher educational environment. Their model focused on the varieties of informative feedback that are facilitated by a supportive teaching culture and that influence instructional improvement. They argued that the presence of a supportive culture, which includes all students, clearly enhances the effectiveness of all strate- gies for improving learning. The authors reported that, in addition to teacher and
course evaluations, student interviews have also been used successfully by teachers as a tool for improving their classes. Student interviews include group discussions, small-group instruc- tional diagnosis, the class interview, and quality control circles (focus groups).
Kramer and Pier (1997) used focus- group research to study teaching effec- tiveness. They were particularly inter- ested in identifying characteristics of effective and ineffective teachers. Kramer and Pier asked focus groups, consisting of students currently enrolled in a basic communications course at a large midwestern university, to describe the behaviors of effective and ineffec- tive teaching through their answers to open-ended questions. The researchers found that focus groups were an effec- tive tool for gathering data from a target population. They found that ideas that otherwise would not have been consid- ered were generated through group interaction. Moreover, the small group size allowed for active participation of all members of the group.
Wilson (1997) explored the use of focus groups in the design of education- al research. Similarly, Pondsford and Masters (1998) provided a framework for conducting focus-group research in the context of studying higher education issues through the use of students as
subjects. These researchers found that
zyxwvutsrqponmlkjihgfedcbaZYXWVUTSRQPONMLKJIHGFEDCBA
July/August
zyxwvutsrqponmlkjihgfedcbaZYXWVUTSRQPONMLKJIHGFEDCBA
2002 329focus groups can be very useful in iden- tifying important issues from the per- spective of the subjects. The authors warned, however, that care must be taken in using this subjective, qualita- tive technique because of the interper- sonal challenges inherent in it.
Bangura (1 994) conducted a study of three in-class faculty evaluation survey instruments that were completed at three different institutions by a total of 468 university students. The survey instruments had varying numbers of fixed-choice and/or open-ended ques- tions and covered instructor perfor- mance, testing, and course objectives. The surveys revealed that faculty mem- bers were doing a good job, leaving unanswered the questions (a) Why were students dissatisfied with some of their professors? and (b) Why were students not reaching appropriate achievement levels? In that study, eight focus-group interviews involving 86 students were conducted. Bangura concluded that focus groups provide a means of obtain- ing substantive data that can improve teaching but that are not provided through the survey method.
Hamilton, Pritchard, Saccucci, and Welsh (2000) reported on the use of stu- dent focus groups for obtaining student feedback for improving the teaching and learning process in a Principles class. The faculty member incorporated the suggestions put forth by the students into the class the following semester. Routine student evaluations collected before and after the changes showed a significant increase in student satisfac- tion for all measures listed on the Edu- cational Testing Service (ETS) Student Instructional Report I1 (SIR 11).
The well known study that led to the discovery of the Hawthorne Effect was conducted at the Hawthorne Works plant of Western Electric in the 1920s and 1930s. In that study, designed to
determine the effect of lighting on work
zyxwvutsrqponmlkjihgfedcbaZYXWVUTSRQPONMLKJIHGFEDCBA
output, researchers measured the outputof a group of workers placed in a partic- ular room and then measured worker ouput again after turning up the room lights. Worker output increased. The researchers then turned the lights down, took a third output measurement, and found that it remained at the increased level. The researchers concluded that
greater output, as well as higher job sat- isfaction, could be achieved if manage- ment showed concern for workers and made them feel more cohesive (Hall,
1984).
According to Neimark (1988), some of the most effective methods for show- ing concern for workers and making them feel that they are part of a team include:
Open discussion between employ-
Information sharing with employ-
Showing trust in employees; and Helping employees cope with ees and management;
ees;
change.
zyxwvutsrqponmlkjihgfedcbaZYXWVUTSRQPONMLKJIHGFEDCBA
Method
Midway through the fall 1999 semester, a professor teaching four day sections of Principles at a regional uni- versity created focus groups among students enrolled in two of his four sec- tions. The professor’s primary goal in conducting these focus groups was to obtain additional suggestions for improving the class and thus, ultimate- ly, the teaching and learning process. The focus groups were designed to provide a safe setting where students could voice their opinions as well as make suggestions.
The professor began the focus group sessions with an explanation of their purpose-that is, they were to help him make improvements in his teaching style and in the class structure itself. The students were asked, “What can I do to improve this course?’ Some stu- dents quickly responded with such sug- gestions as “Make the exams easier” and “Don’t require so much work.” The dialogue became more useful almost immediately, however, and students were eager to express their feelings. Often they would argue among them- selves over a point. The student com- ments resulted in two specific sugges- tions that the professor was able to implement.
The first change related to use of finance review problems that the profes- sor had previously compiled and had been distributing to students in hard copy shortly before the final exam. It
should be noted that the professor used the same syllabus, which included the same text, similar semester tests, the same final exam, and the same peda- gogical procedures, for all four sections. The students suggested that he should:
1. Increase the number of problems; 2. Post the problems on his Web site; 3. Post problems early in the semes- ter so students could use them to review for all tests during the semester rather than waiting for him to distribute them shortly before the final exam.
The second change related to the solutions to the homework problems. The professor had been maintaining several copies of the solutions in the reserve reading room at the university library. The students suggested that, in addition to maintaining copies in the library, he should post the solutions on his Web site.
The professor worked rapidly to com- ply with these two student suggestions. Then he took time to explain in detail to the students who participated in the focus groups why he was unable to comply with other suggestions (such as changing the course from 1 to 2 semes- ters). Furthermore, he told the students that he felt that their opinions and ideas were very important, as demonstrated by the fact that he made the changes rapidly. In contrast, when discussing the changes with the two sections that did not participate in focus group sessions (the control sections), the professor merely announced the two changes with minimum explanation.
Within the 2-week period just preced- ing the final exams, another faculty member administered the Educational Testing Service’s SIR I1 student evalua- tion forms to all four of the first profes- sor’s classes. Student anonymity was assured. We used the SIR I1 in this study because it had been adopted previously by the College of Business as the mea- surement instrument for obtaining stu- dent evaluations and was being used currently in all business classes. Conse- quently, the students were familiar with the form and required minimal instruc- tion in its use.
In this study, we compared and ana- lyzed student evaluations from the fol-
lowing seven major sections on the SIR
zyxwvutsrqponmlkjihgfedcbaZYXWVUTSRQPONMLKJIHGFEDCBA
330 Journal of Education for Business
zyxwvutsrqponmlkjihgfedcbaZYXWVUTSRQPONMLKJIHGFEDCBA
I
TABLE 1. Student Evaluation Ratings for Seven Sections of the SIR II Form: Focus Group Versus Nonfocus Group
Averages
zyxwvutsrqponmlkjihgfedcbaZYXWVUTSRQPONMLKJIHGFEDCBA
Principles of Finance, Fall 1999
Focus group average Nonfocus group average Difference
Question
zyxwvutsrqponmlkjihgfedcbaZYXWVUTSRQPONMLKJIHGFEDCBA
Section A. Course Organization and Planning
1. Explanation of course requirements 4.37 3.84 0.53
2. Preparation for class 4.58 4.21 0.37
3. Command of the subject matter 4.75 4.23 0.52
4. Use of class time 4.36 4.02 0.34
5. Summarization of important points in class 4.02 3.57 0.45
Section total 4.42 3.97 0.44
Section B. Communication
6. Cleadunderstandable presentations 4.29 3.80 0.50
8. Use of examples to clarify material 4.39 3.77 0.62
9. Use of challanging questions/problems 4.25 3.84 0.4 1
10. Enthusiasm for course material 4.60 4.11 0.49
Section total 4.45 4.01 0.45
7. Command of spoken English 4.74 4.52 0.22
1 1.
zyxwvutsrqponmlkjihgfedcbaZYXWVUTSRQPONMLKJIHGFEDCBA
Helpfulness/responsiveness to students 12. Respect for students13. Concern for student progress 14. Availability of extra help
15. Willingness to listen to questions/opinions Section total
Section C. Faculty/Student Interaction
4.17 4.41 3.94 3.68 4.36 4.11
3.65 3.67 3.52 3.79 3.70 3.67
0.52 0.74 0.42 -0.12
0.66 0.44
Section D. Assignments, Exams, and Grading
16. Information provided about grading 17. Clarity of exam questions
18. Exams’ coverage of important course aspects 19. Instructor comments on assignmentdexams
2 1. Helpfulness of assignments in understanding material
4.23 3.58 3.83 3.85 3.94 3.87
Section total 3.88
20. Overall quality of textbook
4.09 3.30 3.73 3.42 3.54 3.69 3.63
0.15 0.29 0.10 0.42 0.40 0.18 0.26
Section R Course Outcomes
29. Increased learning in this course
30. Progress toward achieving course objectives 3 1. Increased interest in the subject
32. Helped me to think independently about subject 33. Involved me in what I was learning
Section total
3.24 3.06 3.25 3.29 3.30 3.23
3.18 3.08 2.91 2.89 2.79 2.97
0.06 -0.02 0.34 0.40 0.50 0.26
34. Study time and effort 35. Class preparation 36. Challanging course
Section total
Section G . Student Effort and Involvement
4.30 4.08
3.72 3.40
4.66 4.41
4.23 3.96
zyxwvutsrqponmlkjihgfedcbaZYXWVUTSRQPONMLKJIHGFEDCBA
-
0.22 0.32 0.25 0.26
-
Section
zyxwvutsrqponmlkjihgfedcbaZYXWVUTSRQPONMLKJIHGFEDCBA
I. Overall Evaluation40. Overall quality of instruction 3.90 3.47 0.43
I
July/August 2002 331
[image:4.612.56.565.66.723.2]11
zyxwvutsrqponmlkjihgfedcbaZYXWVUTSRQPONMLKJIHGFEDCBA
evaluation form: Course Organization and Planning; Communication; Facul-ty/Student Interaction; Assignments, Exams, and Grading; Course Outcomes; Student Effort and Involvement; and Overall Evaluation. Other sections of
the SIR
zyxwvutsrqponmlkjihgfedcbaZYXWVUTSRQPONMLKJIHGFEDCBA
11, such as Supplementary Instruction Methods, were not includedin the study because means were not reported for them.
We computed differences in the weighted average mean student evalua- tion ratings for each of the SIR I1 ques- tions as well as for the seven major SIR sections. The weighting was based on the number of students in the two sec- tions who participated in the focus groups (45) and the number of those in the control sections who did not partici-
pate (49). We performed a regression
zyxwvutsrqponmlkjihgfedcbaZYXWVUTSRQPONMLKJIHGFEDCBA
[image:5.612.44.388.170.716.2]I
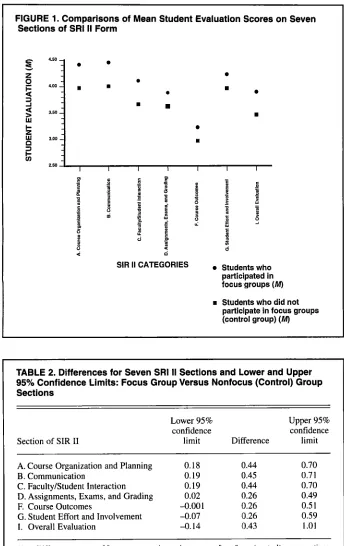
IFIGURE 1. Comparisons of Mean Student Evaluation Scores on Seven Sections of SRI II Form
4'50
1
3.60 -
m
zyxwvutsrqponmlkjihgfedcbaZYXWVUTSRQPONMLKJIHGFEDCBA
3.00 -
2.80
I I I I I I I
zyxwvutsrqponmlkjihgfedcbaZYXWVUTSRQPONMLKJIHGFEDCBA
u
zyxwvutsrqponmlkjihgfedcbaZYXWVUTSRQPONMLKJIHGFEDCBA
0SIR II CATEGORIES Students who
participated in
focus groups (M)
m Students who did not participate in focus groups (control group) ( M )
TABLE 2. Differences for Seven SRI II Sections and Lower and Upper 95% Confidence Limits: Focus Group Versus Nonfocus (Control) Group Sections
Section of SIR I1
Lower 95% Upper 95%
confidence confidence
limit Difference limit
A. Course Organization and Planning 0.18 0.44 0.70
B. Communication 0.19 0.45 0.7 1
C. FacultylStudent Interaction 0.19 0.44 0.70
D. Assignments, Exams, and Grading 0.02 0.26 0.49
F. Course Outcomes -0.001 0.26 0.5 1
G. Student Effort and Involvement -0.07 0.26 0.59
I. Overall Evaluation -0.14 0.43 1.01
Note. Difference = mean of focus group sections minus mean of nonfocus (control) group sections.
analysis to evaluate the significance of the differences in means between the two groups for each of the seven SIR I1
sections.
Results
In Table 1, we provide the weighted average student evaluation ratings for the seven sections of the SIR I1 admin-
istered at the end of the fall 1999 semes- ter. On 38 of the 40 questions asked on the instrument, we obtained higher eval- uation ratings from the students who participated in the focus groups (indi- cating greater satisfaction) than we did from students in the control group. We noted very large differences in the fol- lowing individual question responses:
Respect for students (+.74) Willingness to listen to ques-
Use of examples to clarify materi-
Explanation of course require-
Command of subject matter (+.52) Helpfulness/responsiveness to stu-
Cleadunderstandable presentations
Involved me in what I was learning
Overall evaluation (+.43)
In Figure 1, we provide a graph of the weighted average evaluation ratings for the two groups of students. In Table 2, we provide a summary of the differ- ences for each of the seven sections of the SIR I1 together with lower and upper 95% confidence limits.
Because the confidence limits for sections F, G , and I of the SIR I1 report
contained zero, there were no statistical- ly significant differences (at the 0.05 level) between levels of student satisfac- tion reported by the two groups, for these sections. We found significant dif- ferences, however, on all other items. tions/opinions (+.66)
als (+.62)
ments (+.53)
dents (+.52)
zyxwvutsrqponmlkjihgfedcbaZYXWVUTSRQPONMLKJIHGFEDCBA
(+SO)
( + S O )
Summary
Student course evaluations are very important to most faculty members because these evaluations are used in recontracting, tenure, and promotion decisions at many universities. In this
332
Journal of Education for Businessstudy, we found evidence of the pres- ence of the “Hawthorne Effect”; that is, students may have had a higher level of satisfaction in the course as a result of the focus groups, which provided:
Open discussion between the stu- dents and their instructor;
Information shared by the instructor; Trust regarding the importance of their opinions about the course;
The rapid implementation of sug- gested changes to the course.
These findings may be very useful for faculty members who are attempting to improve the level of student satisfaction
with their courses.
zyxwvutsrqponmlkjihgfedcbaZYXWVUTSRQPONMLKJIHGFEDCBA
REFERENCES
Bangura, A. (1994). The
zyxwvutsrqponmlkjihgfedcbaZYXWVUTSRQPONMLKJIHGFEDCBA
focus-group approach aszyxwvutsrqponmlkjihgfedcbaZYXWVUTSRQPONMLKJIHGFEDCBA
an alternative for collecting faculty evaluation data to improve reaching. Paper presented at the Center for Educational Development and Assessment Conference on Faculty Evaluation,
San
zyxwvutsrqponmlkjihgfedcbaZYXWVUTSRQPONMLKJIHGFEDCBA
Juan, Puerto Rico.Hall, C. (1984). Hawthorne effects-Still a potent supervisory tool. Supervision, 46(2). Retrieved March 12, 2002 from http://proquest.umi.com (UMI Publication No. 0025375 1)
Hamilton, D., Pritchard, R., Saccucci, M.,
zyxwvutsrqponmlkjihgfedcbaZYXWVUTSRQPONMLKJIHGFEDCBA
&Welsh, C. (2000). Using focus groups to improve the teachindlearning process in princi- ples of finance. The Journal of Accounting and Finance Research, 8(2), 33-43.
Kramer, M., & Pier, P. (1997). A holistic examina- tion of students’ perceptions of effective and ineffective communication by college teachers. Paper presented at the Annual Meeting of the National Communication Association, Chica-
go, IL, November 19-23. (ERIC Reproduction Service No. ED 416556)
Neimark, J. (1988). Shake it up! The Hawthorne Effect established the overwhelm. Success, 3.5(6). Retrieved March 12, 2002 from http://proquest.umi.com (UMI Publication No. 0041 1549).
Paulsen, M., & Feldman, K. (1995). Taking teach- ing seriously: Meeting the challenge of instruc- tional improvement (Association for the Study of Higher Education Report No. 2). Washing- ton, DC: George Washington University. Grad- uate School of Education and Human Develop- ment. (ERIC Document Reproduction Service No. ED 396616)
Pondsford, B., & Masters, L. (1998). How to use focus groups in higher education research. Col- lege and University, 73, 2-4.
Wilson, V. (1997). Focus groups: A useful qualita- tive method for educational research. British Educational Research Journal, 23(2). 9-24.
Advertise
in
zyxwvutsrqponmlkjihgfedcbaZYXWVUTSRQPONMLKJIHGFEDCBA
the
zyxwvutsrqponmlkjihgfedcbaZYXWVUTSRQPONMLKJIHGFEDCBA
Journal of
Education for Business
For more information please contact:
Alison Mayhew,
Advertising Director
Heldref Publications
13
19 Eighteenth St NW
Washington. DC 20036-1 802
Phone:
(202) 296-6267
ext.
247
Fax:
(202) 296-5149