by Luca Massaron
and John Paul Mueller
Python
for
Data Science
Media and software compilation copyright © 2015 by John Wiley & Sons, Inc. All rights reserved. Published simultaneously in Canada
No part of this publication may be reproduced, stored in a retrieval system or transmitted in any form or by any means, electronic, mechanical, photocopying, recording, scanning or otherwise, except as permit-ted under Sections 107 or 108 of the 1976 Unipermit-ted States Copyright Act, without the prior written permission of the Publisher. Requests to the Publisher for permission should be addressed to the Permissions Department, John Wiley & Sons, Inc., 111 River Street, Hoboken, NJ 07030, (201) 748‐6011, fax (201) 748‐6008, or online at http://www.wiley.com/go/permissions.
Trademarks: Wiley, For Dummies, the Dummies Man logo, Dummies.com, Making Everything Easier, and related trade dress are trademarks or registered trademarks of John Wiley & Sons, Inc. and may not be used without written permission. Python is a registered trademark of Python Software Foundation Corporation. All other trademarks are the property of their respective owners. John Wiley & Sons, Inc. is not associated with any product or vendor mentioned in this book.
LIMIT OF LIABILITY/DISCLAIMER OF WARRANTY: THE PUBLISHER AND THE AUTHOR MAKE NO REPRESENTATIONS OR WARRANTIES WITH RESPECT TO THE ACCURACY OR COMPLETENESS OF THE CONTENTS OF THIS WORK AND SPECIFICALLY DISCLAIM ALL WARRANTIES, INCLUDING WITHOUT LIMITATION WARRANTIES OF FITNESS FOR A PARTICULAR PURPOSE. NO WARRANTY MAY BE CREATED OR EXTENDED BY SALES OR PROMOTIONAL MATERIALS. THE ADVICE AND STRATEGIES CONTAINED HEREIN MAY NOT BE SUITABLE FOR EVERY SITUATION. THIS WORK IS SOLD WITH THE UNDERSTANDING THAT THE PUBLISHER IS NOT ENGAGED IN RENDERING LEGAL, ACCOUNTING, OR OTHER PROFESSIONAL SERVICES. IF PROFESSIONAL ASSISTANCE IS REQUIRED, THE SERVICES OF A COMPETENT PROFESSIONAL PERSON SHOULD BE SOUGHT. NEITHER THE PUBLISHER NOR THE AUTHOR SHALL BE LIABLE FOR DAMAGES ARISING HEREFROM. THE FACT THAT AN ORGANIZATION OR WEBSITE IS REFERRED TO IN THIS WORK AS A CITATION AND/OR A POTENTIAL SOURCE OF FURTHER INFORMATION DOES NOT MEAN THAT THE AUTHOR OR THE PUBLISHER ENDORSES THE INFORMATION THE ORGANIZATION OR WEBSITE MAY PROVIDE OR RECOMMENDATIONS IT MAY MAKE. FURTHER, READERS SHOULD BE AWARE THAT INTERNET WEBSITES LISTED IN THIS WORK MAY HAVE CHANGED OR DISAPPEARED BETWEEN WHEN THIS WORK WAS WRITTEN AND WHEN IT IS READ.
For general information on our other products and services, please contact our Customer Care Department within the U.S. at 877‐762‐2974, outside the U.S. at 317‐572‐3993, or fax 317‐572‐4002. For technical support, please visit www.wiley.com/techsupport.
Wiley publishes in a variety of print and electronic formats and by print‐on‐demand. Some material included with standard print versions of this book may not be included in e‐books or in print‐on‐demand. If this book refers to media such as a CD or DVD that is not included in the version you purchased, you may download this material at http://booksupport.wiley.com. For more information about Wiley prod-ucts, visit www.wiley.com.
Library of Congress Control Number: 2013956848 ISBN: 978‐1‐118‐84418‐2
ISBN 978-1-118-84398-7 (ebk); ISBN ePDF 978-1-118-84414-4 (ebk) Manufactured in the United States of America
10 9 8 7 6 5 4 3 2 1
Introduction ... 1
About This Book ... 1
Foolish Assumptions ... 2
Icons Used in This Book ... 3
Beyond the Book ... 4
Where to Go from Here ... 5
Part I: Getting Started with Python for Data Science ... 7
Chapter 1: Discovering the Match between
Data Science and Python . . . .9
Defining the Sexiest Job of the 21st Century ... 11
Considering the emergence of data science... 11
Outlining the core competencies of a data scientist ... 12
Linking data science and big data ... 13
Understanding the role of programming ... 13
Creating the Data Science Pipeline ... 14
Preparing the data ... 14
Performing exploratory data analysis ... 15
Learning from data ... 15
Visualizing ... 15
Obtaining insights and data products ... 15
Understanding Python’s Role in Data Science ... 16
Considering the shifting profile of data scientists ... 16
Working with a multipurpose, simple, and efficient language ... 17
Learning to Use Python Fast ... 18
Loading data ... 18
Training a model ... 18
Viewing a result ... 20
Chapter 2: Introducing Python’s Capabilities and Wonders . . . .21
Why Python? ... 22
Grasping Python’s core philosophy ... 23
Discovering present and future development goals ... 23
Working with Python ... 24
Getting a taste of the language ... 24
Understanding the need for indentation ... 25
Working at the command line or in the IDE ... 25
Performing Rapid Prototyping and Experimentation ... 29
Considering Speed of Execution ... 30
Visualizing Power ... 32
Using the Python Ecosystem for Data Science ... 33
Accessing scientific tools using SciPy ... 33
Performing fundamental scientific computing using NumPy ... 34
Performing data analysis using pandas ... 34
Implementing machine learning using Scikit‐learn ... 35
Plotting the data using matplotlib ... 35
Parsing HTML documents using Beautiful Soup ... 35
Chapter 3: Setting Up Python for Data Science . . . .37
Considering the Off‐the‐Shelf Cross‐Platform Scientific Distributions ... 38
Getting Continuum Analytics Anaconda ... 39
Getting Enthought Canopy Express... 40
Getting pythonxy ... 40
Getting WinPython ... 41
Installing Anaconda on Windows ... 41
Installing Anaconda on Linux ... 45
Installing Anaconda on Mac OS X ... 46
Downloading the Datasets and Example Code ... 47
Using IPython Notebook ... 47
Defining the code repository ... 48
Understanding the datasets used in this book ... 54
Chapter 4: Reviewing Basic Python . . . .57
Working with Numbers and Logic ... 59
Performing variable assignments ... 60
Doing arithmetic ... 61
Comparing data using Boolean expressions ... 62
Creating and Using Strings ... 65
Interacting with Dates ... 66
Creating and Using Functions ... 68
Creating reusable functions ... 68
Calling functions in a variety of ways ... 70
Using Conditional and Loop Statements ... 73
Making decisions using the if statement ... 73
Choosing between multiple options using nested decisions ... 74
Performing repetitive tasks using for ... 75
Using the while statement ... 76
Storing Data Using Sets, Lists, and Tuples ... 77
Performing operations on sets ... 77
Working with lists ... 78
Creating and using Tuples ... 80
Defining Useful Iterators ... 81
Indexing Data Using Dictionaries ... 82
Part II: Getting Your Hands Dirty with Data ... 83
Chapter 5: Working with Real Data . . . .85
Uploading, Streaming, and Sampling Data ... 86
Uploading small amounts of data into memory ... 87
Streaming large amounts of data into memory ... 88
Sampling data ... 89
Accessing Data in Structured Flat‐File Form ... 90
Reading from a text file ... 91
Reading CSV delimited format ... 92
Reading Excel and other Microsoft Office files ... 94
Sending Data in Unstructured File Form ... 95
Managing Data from Relational Databases ... 98
Interacting with Data from NoSQL Databases ... 100
Accessing Data from the Web ... 101
Chapter 6: Conditioning Your Data . . . .105
Juggling between NumPy and pandas ... 106
Knowing when to use NumPy ... 106
Knowing when to use pandas ... 106
Validating Your Data ... 107
Figuring out what’s in your data ... 108
Removing duplicates ... 109
Creating a data map and data plan ... 110
Manipulating Categorical Variables ... 112
Creating categorical variables... 113
Renaming levels ... 114
Combining levels ... 115
Dealing with Dates in Your Data ... 116
Formatting date and time values ... 117
Using the right time transformation ... 117
Dealing with Missing Data ... 118
Finding the missing data ... 119
Encoding missingness ... 119
Imputing missing data ... 120
Slicing and Dicing: Filtering and Selecting Data ... 122
Slicing rows ... 122
Slicing columns ... 123
Dicing ... 123
Concatenating and Transforming ... 124
Adding new cases and variables ... 125
Removing data ... 126
Sorting and shuffling ... 127
Aggregating Data at Any Level ... 128
Chapter 7: Shaping Data . . . .131
Working with HTML Pages ... 132
Parsing XML and HTML... 132
Using XPath for data extraction ... 133
Working with Raw Text ... 134
Dealing with Unicode... 134
Stemming and removing stop words ... 136
Introducing regular expressions ... 137
Using the Bag of Words Model and Beyond ... 140
Understanding the bag of words model ... 141
Working with n‐grams ... 142
Implementing TF‐IDF transformations ... 144
Working with Graph Data ... 145
Understanding the adjacency matrix ... 146
Using NetworkX basics... 146
Chapter 8: Putting What You Know in Action . . . .149
Contextualizing Problems and Data ... 150
Evaluating a data science problem ... 151
Researching solutions ... 151
Formulating a hypothesis ... 152
Preparing your data ... 153
Considering the Art of Feature Creation ... 153
Defining feature creation ... 153
Combining variables ... 154
Understanding binning and discretization ... 155
Using indicator variables ... 155
Transforming distributions ... 156
Performing Operations on Arrays ... 156
Using vectorization ... 157
Performing simple arithmetic on vectors and matrices ... 157
Performing matrix vector multiplication ... 158
Performing matrix multiplication ... 159
Part III: Visualizing the Invisible ... 161
Chapter 9: Getting a Crash Course in MatPlotLib . . . .163
Starting with a Graph ... 164
Defining the plot ... 164
Drawing multiple lines and plots ... 165
Saving your work ... 165
Setting the Axis, Ticks, Grids ... 166
Getting the axes ... 167
Formatting the axes ... 167
Adding grids ... 168
Defining the Line Appearance ... 169
Working with line styles ... 170
Using colors ... 170
Adding markers ... 172
Using Labels, Annotations, and Legends ... 173
Adding labels ... 174
Annotating the chart ... 174
Creating a legend ... 175
Chapter 10: Visualizing the Data . . . .179
Choosing the Right Graph ... 180
Showing parts of a whole with pie charts ... 180
Creating comparisons with bar charts ... 181
Showing distributions using histograms ... 183
Depicting groups using box plots ... 184
Seeing data patterns using scatterplots ... 185
Creating Advanced Scatterplots ... 187
Depicting groups ... 187
Showing correlations ... 188
Plotting Time Series ... 189
Representing time on axes ... 190
Plotting trends over time ... 191
Plotting Geographical Data ... 193
Visualizing Graphs ... 195
Developing undirected graphs ... 195
Developing directed graphs ... 197
Chapter 11: Understanding the Tools . . . .199
Using the IPython Console ... 200
Interacting with screen text... 200
Changing the window appearance... 202
Getting Python help ... 203
Getting IPython help ... 205
Using magic functions ... 205
Discovering objects ... 207
Using IPython Notebook ... 208
Working with styles ... 208
Restarting the kernel ... 210
Restoring a checkpoint ... 210
Performing Multimedia and Graphic Integration ... 212
Embedding plots and other images ... 212
Loading examples from online sites ... 212
Obtaining online graphics and multimedia ... 212
Part IV: Wrangling Data ... 215
Chapter 12: Stretching Python’s Capabilities . . . .217
Playing with Scikit‐learn ... 218
Understanding classes in Scikit‐learn ... 218
Defining applications for data science ... 219
Performing the Hashing Trick ... 222
Using hash functions ... 223
Demonstrating the hashing trick ... 223
Working with deterministic selection ... 225
Considering Timing and Performance ... 227
Benchmarking with timeit... 228
Working with the memory profiler ... 230
Running in Parallel ... 232
Performing multicore parallelism ... 232
Demonstrating multiprocessing... 233
Chapter 13: Exploring Data Analysis . . . .235
The EDA Approach ... 236
Defining Descriptive Statistics for Numeric Data ... 237
Measuring central tendency ... 238
Measuring variance and range ... 239
Working with percentiles ... 239
Defining measures of normality ... 240
Counting for Categorical Data ... 241
Understanding frequencies ... 242
Creating contingency tables ... 243
Creating Applied Visualization for EDA ... 243
Inspecting boxplots ... 244
Performing t‐tests after boxplots ... 245
Observing parallel coordinates ... 246
Graphing distributions ... 247
Plotting scatterplots ... 248
Understanding Correlation ... 250
Using covariance and correlation ... 250
Using nonparametric correlation ... 252
Considering chi‐square for tables ... 253
Modifying Data Distributions ... 253
Using the normal distribution ... 254
Creating a Z‐score standardization ... 254
Transforming other notable distributions... 254
Chapter 14: Reducing Dimensionality . . . .257
Understanding SVD ... 258
Looking for dimensionality reduction ... 259
Using SVD to measure the invisible ... 260
Performing Factor and Principal Component Analysis ... 261
Considering the psychometric model ... 262
Looking for hidden factors ... 262
Using components, not factors ... 263
Achieving dimensionality reduction ... 264
Understanding Some Applications ... 264
Recognizing faces with PCA... 265
Extracting Topics with NMF ... 267
Recommending movies ... 270
Chapter 15: Clustering . . . .273
Clustering with K‐means ... 275
Understanding centroid‐based algorithms ... 275
Creating an example with image data ... 277
Looking for optimal solutions ... 278
Clustering big data ... 281
Performing Hierarchical Clustering ... 282
Moving Beyond the Round-Shaped Clusters: DBScan ... 286
Chapter 16: Detecting Outliers in Data . . . .289
Considering Detection of Outliers ... 290
Finding more things that can go wrong ... 291
Understanding anomalies and novel data ... 292
Examining a Simple Univariate Method ... 292
Leveraging on the Gaussian distribution ... 294
Making assumptions and checking out ... 295
Developing a Multivariate Approach ... 296
Using principal component analysis ... 297
Using cluster analysis ... 298
Automating outliers detection with SVM ... 299
Part V: Learning from Data ... 301
Chapter 17: Exploring Four Simple and Effective Algorithms . . . .303
Guessing the Number: Linear Regression ... 304
Defining the family of linear models ... 304
Using more variables ... 305
Moving to Logistic Regression ... 307
Applying logistic regression ... 308
Considering when classes are more ... 309
Making Things as Simple as Naïve Bayes ... 310
Finding out that Naïve Bayes isn’t so naïve ... 312
Predicting text classifications ... 313
Learning Lazily with Nearest Neighbors ... 315
Predicting after observing neighbors... 316
Choosing your k parameter wisely ... 317
Chapter 18: Performing Cross‐Validation, Selection,
and Optimization . . . .319
Pondering the Problem of Fitting a Model ... 320
Understanding bias and variance ... 321
Defining a strategy for picking models ... 322
Dividing between training and test sets... 325
Cross‐Validating ... 328
Using cross‐validation on k folds ... 329
Sampling stratifications for complex data ... 329
Selecting Variables Like a Pro ... 331
Selecting by univariate measures ... 331
Using a greedy search ... 333
Pumping Up Your Hyperparameters ... 334
Implementing a grid search ... 335
Trying a randomized search... 339
Chapter 19: Increasing Complexity with Linear
and Nonlinear Tricks . . . .341
Using Nonlinear Transformations ... 341
Doing variable transformations ... 342
Creating interactions between variables ... 344
Regularizing Linear Models ... 348
Relying on Ridge regression (L2) ... 349
Using the Lasso (L1) ... 349
Leveraging regularization ... 350
Combining L1 & L2: Elasticnet ... 350
Fighting with Big Data Chunk by Chunk ... 351
Determining when there is too much data ... 351
Implementing Stochastic Gradient Descent ... 351
Understanding Support Vector Machines ... 354
Relying on a computational method ... 355
Fixing many new parameters ... 358
Classifying with SVC ... 360
Going nonlinear is easy ... 365
Performing regression with SVR ... 366
Chapter 20: Understanding the Power of the Many . . . .373
Starting with a Plain Decision Tree ... 374
Understanding a decision tree ... 374
Creating classification and regression trees ... 376
Making Machine Learning Accessible ... 379
Working with a Random Forest classifier ... 381
Working with a Random Forest regressor ... 382
Optimizing a Random Forest ... 383
Boosting Predictions ... 384
Knowing that many weak predictors win ... 384
Creating a gradient boosting classifier ... 385
Creating a gradient boosting regressor ... 386
Using GBM hyper‐parameters ... 387
Part VI: The Part of Tens ... 389
Chapter 21: Ten Essential Data Science
Resource Collections . . . .391
Gaining Insights with Data Science Weekly ... 392
Obtaining a Resource List at U Climb Higher ... 392
Getting a Good Start with KDnuggets ... 392
Accessing the Huge List of Resources on Data Science Central ... 393
Obtaining the Facts of Open Source Data Science from Masters ... 394
Locating Free Learning Resources with Quora ... 394
Receiving Help with Advanced Topics at Conductrics ... 394
Learning New Tricks from the Aspirational Data Scientist ... 395
Finding Data Intelligence and Analytics Resources at AnalyticBridge... 396
Zeroing In on Developer Resources with Jonathan Bower ... 396
Chapter 22: Ten Data Challenges You Should Take . . . .397
Meeting the Data Science London + Scikit‐learn Challenge ... 398
Predicting Survival on the Titanic ... 399
Finding a Kaggle Competition that Suits Your Needs ... 399
Honing Your Overfit Strategies ... 400
Trudging Through the MovieLens Dataset ... 401
Getting Rid of Spam Emails ... 401
Working with Handwritten Information ... 402
Working with Pictures ... 403
Analyzing Amazon.com Reviews ... 404
Interacting with a Huge Graph ... 405
Y
ou rely on data science absolutely every day to perform an amazing array of tasks or to obtain services from someone else. In fact, you’ve probably used data science in ways that you never expected. For example, when you used your favorite search engine this morning to look for some-thing, it made suggestions on alternative search terms. Those terms are supplied by data science. When you went to the doctor last week and discovered the lump you found wasn’t cancer, it’s likely the doctor made his prognosis with the help of data science. In fact, you might work with data science every day and not even know it. Python for Data Science For Dummies not only gets you started using data science to perform a wealth of practical tasks but also helps you realize just how many places data science is used. By knowing how to answer data science problems and where to employ data science, you gain a significant advantage over everyone else, increasing your chances at promotion or that new job you really want.About This Book
The main purpose of Python for Data Science For Dummies is to take the scare factor out of data science by showing you that data science is not only really interesting but also quite doable using Python. You might assume that you need to be a computer science genius to perform the complex tasks normally associated with data science, but that’s far from the truth. Python comes with a host of useful libraries that do all the heavy lifting for you in the back-ground. You don’t even realize how much is going on, and you don’t need to care. All you really need to know is that you want to perform specific tasks and that Python makes these tasks quite accessible.
Part of the emphasis of this book is on using the right tools. You start with Anaconda, a product that includes IPython and IPython Notebook — two tools that take the sting out of working with Python. You experiment with IPython in a fully interactive environment. The code you place in IPython Notebook is presentation quality, and you can mix a number of presentation elements right there in your document. It’s not really like using a develop-ment environdevelop-ment at all.
considerable time showing you just what is available and how you can use it to perform some really interesting calculations. Many people would like to know how to perform handwriting recognition — and if you’re one of them, you can use this book to get a leg up on the process.
Of course, you might still be worried about the whole programming environ-ment issue, and this book doesn’t leave you in the dark there, either. At the beginning, you find complete installation instructions for Anaconda and a quick primer (with references) to the basic Python programming you need to perform. The emphasis is on getting you up and running as quickly as possible, and to make examples straightforward and simple so that the code doesn’t become a stumbling block to learning.
To make absorbing the concepts even easier, this book uses the following conventions:
✓Text that you’re meant to type just as it appears in the book is in bold. The exception is when you’re working through a step list: Because each step is bold, the text to type is not bold.
✓When you see words in italics as part of a typing sequence, you need to replace that value with something that works for you. For example, if you see “Type Your Name and press Enter,” you need to replace Your Name with your actual name.
✓Web addresses and programming code appear in monofont. If you’re reading a digital version of this book on a device connected to the Internet, note that you can click the web address to visit that website, like this: http://www.dummies.com.
✓When you need to type command sequences, you see them separated by a special arrow, like this: File➪New File. In this case, you go to the File menu first and then select the New File entry on that menu. The result is that you see a new file created.
Foolish Assumptions
You might find it difficult to believe that we’ve assumed anything about you — after all, we haven’t even met you yet! Although most assumptions are indeed foolish, we made these assumptions to provide a starting point for the book.
information about Python concerning how it applies to data science, this book doesn’t discuss any platform‐specific issues. You really do need to know how to install applications, use applications, and generally work with your chosen platform before you begin working with this book.
This book isn’t a math primer. Yes, you see lots of examples of complex math, but the emphasis is on helping you use Python and data science to perform analysis tasks rather than learn math theory. Chapters 1 and 2 provide you with a better understanding of precisely what you need to know in order to use this book successfully.
This book also assumes that you can access items on the Internet. Sprinkled throughout are numerous references to online material that will enhance your learning experience. However, these added sources are useful only if you actually find and use them.
Icons Used in This Book
As you read this book, you see icons in the margins that indicate material of interest (or not, as the case may be).This section briefly describes each icon in this book.
Tips are nice because they help you save time or perform some task without a lot of extra work. The tips in this book are time‐saving techniques or pointers to resources that you should try in order to get the maximum benefit from Python or in performing data science–related tasks.
We don’t want to sound like angry parents or some kind of maniacs, but you should avoid doing anything that’s marked with a Warning icon. Otherwise, you might find that your application fails to work as expected, you get incor-rect answers from seemingly bulletproof equations, or (in the worst‐case scenario) you lose data.
Whenever you see this icon, think advanced tip or technique. You might find these tidbits of useful information just too boring for words, or they could contain the solution you need to get a program running. Skip these bits of information whenever you like.
Beyond the Book
This book isn’t the end of your Python or data science experience — it’s really just the beginning. We provide online content to make this book more flexible and better able to meet your needs. That way, as we receive email from you, we can address questions and tell you how updates to either Python or its associated add‐ons affect book content. In fact, you gain access to all these cool additions:
✓Cheat sheet: You remember using crib notes in school to make a better mark on a test, don’t you? You do? Well, a cheat sheet is sort of like that. It provides you with some special notes about tasks that you can do with Python, IPython, IPython Notebook, and data science that not every other person knows. You can find the cheat sheet for this book at
http://www.dummies.com/cheatsheet/pythonfordatascience. It contains really neat information such as the most common program-ming mistakes that cause people woe when using Python.
✓Dummies.com online articles: A lot of readers were skipping past the parts pages in For Dummies books, so the publisher decided to remedy that. You now have a really good reason to read the parts pages — online content. Every parts page has an article associated with it that provides additional interesting information that wouldn’t fit in the book. You can find the articles for this book at http://www.dummies.com/ extras/pythonfordatascience.
✓Updates: Sometimes changes happen. For example, we might not have seen an upcoming change when we looked into our crystal ball during the writing of this book. In the past, this possibility simply meant that the book became outdated and less useful, but you can now find updates to the book at http://www.dummies.com/extras/ pythonfordatascience.
In addition to these updates, check out the blog posts with answers to reader questions and demonstrations of useful book‐related techniques at http://blog.johnmuellerbooks.com/.
Where to Go from Here
It’s time to start your Python for data science adventure! If you’re completely new to Python and its use for data science tasks, you should start with Chapter 1 and progress through the book at a pace that allows you to absorb as much of the material as possible.
If you’re a novice who’s in an absolute rush to get going with Python for data science as quickly as possible, you can skip to Chapter 3 with the under-standing that you may find some topics a bit confusing later. Skipping to Chapter 4 is possible if you already have Anaconda (the programming prod-uct used in the book) installed, but be sure to at least skim Chapter 3 so that you know what assumptions we made when writing this book. Make sure to install Anaconda with Python version 2.7.9 installed to obtain the best results from the book’s source code.
Visit www.dummies.com for great For Dummies content online.
✓ Discovering why being a data scientist is so cool
✓ Defining how Python makes data science easier
✓ Specifying the process normally used for data science tasks
✓ Installing Python so that it works well for data science tasks
Discovering the Match between
Data Science and Python
In This Chapter
▶Discovering the wonders for data science
▶Exploring how data science works
▶Creating the connection between Python and data science
▶Getting started with Python
D
ata science may seem like one of those technologies that you’d never use, but you’d be wrong. Yes, data science involves the use of advanced math techniques, statistics, and big data. However, data science also involves helping you make smart decisions, creating suggestions for options based on previous choices, and making robots see objects. In fact, people use data science in so many different ways that you literally can’t look anywhere or do anything without feeling the effects of data science on your life. In short, data science is the person behind the partition in the experi-ence of the wonderment of technology. Without data sciexperi-ence, much of what you accept as typical and expected today wouldn’t even be possible. This is the reason that being a data scientist is the sexiest job of the twenty‐first century.This chapter gets you started with Python. Even though this book isn’t designed to provide you with a complete Python tutorial, exploring some basic Python issues will reduce the time needed for you to get up to speed. (If you do need a good starting tutorial, please get my Beginning Programming with Python For Dummies, published by John Wiley & Sons, Inc.) You’ll find that the book provides pointers to tutorials and other aids as needed to fill in any gaps that you may have in your Python education.
Choosing a data science language
There are many different programming languages in the world — and most were designed to perform tasks in a certain way or even make it easier for a particular profession’s work to be done with greater ease. Choosing the correct tool makes your life easier. It’s akin to using a hammer to drive a screw rather than a screwdriver. Yes, the hammer works, but the screwdriver is much easier to use and definitely does a better job. Data scientists usually use only a few languages because they make working with data easier. With this in mind, here are the four top languages for data science work in order of preference (used by 91 percent of the data scientists out there):
✓ Python (general purpose): Many data scientists prefer to use Python because it provides a wealth of libraries, such as NumPy, SciPy, MatPlotLib, pandas, and Scikit‐learn, to make data science tasks significantly easier. Python is also a pre-cise language that makes it easy to use multi‐processing on large datasets — reducing the time required to analyze them. The data science community has also stepped up with specialized IDEs, such as Anaconda, that implement the IPython Notebook concept, which makes work-ing with data science calculations sig-nificantly easier (Chapter 3 demonstrates how to use IPython, so don’t worry about
it in this chapter). Besides all of these things in Python’s favor, it’s also an excel-lent language for creating glue code with languages such as C/C++ and Fortran. The Python documentation actually shows how to create the required extensions. Most Python users rely on the language to see patterns, such as allowing a robot to see a group of pixels as an object. It also sees use for all sorts of scientific tasks.
✓ R (special purpose statistical): In many respects, Python and R share the same sorts of functionality but implement it in dif-ferent ways. Depending on which source you view, Python and R have about the same number of proponents, and some people use Python and R interchangeably (or sometimes in tandem). Unlike Python, R provides its own environment, so you don’t need a third‐party product such as Anaconda. However, R doesn’t appear to mix with other languages with the ease that Python provides.
Defining the Sexiest Job
of the 21st Century
At one point, the world viewed anyone working with statistics as a sort of accountant or perhaps a mad scientist. Many people consider statistics and analysis of data boring. However, data science is one of those occupations in which the more you learn, the more you want to learn. Answering one ques-tion often spawns more quesques-tions that are even more interesting than the one you just answered. However, the thing that makes data science so sexy is that you see it everywhere and used in an almost infinite number of ways. The following sections provide you with more details on why data science is such an amazing field of study.
Considering the emergence
of data science
Data science is a relatively new term. William S. Cleveland coined the term in 2001 as part of a paper entitled “Data Science: An Action Plan for Expanding the Technical Areas of the Field of Statistics.” It wasn’t until a year later that the International Council for Science actually recognized data science and created a committee for it. Columbia University got into the act in 2003 by beginning publication of the Journal of Data Science.
other words, this is a business‐specific language — one used to make decisions rather than to perform handwriting analysis or to detect specific natural patterns.
✓ SQL (database management): The most important thing to remember about Structured Query Language (SQL) is that it focuses on data rather than tasks. Businesses can’t operate without good data management — the data is the busi-ness. Large organizations use some sort of relational database, which is normally accessible with SQL, to store their data. Most Database Management System
However, the mathematical basis behind data science is centuries old because data science is essentially a method of viewing and analyzing stati stics and probability. The first essential use of statistics as a term comes in 1749, but statistics are certainly much older than that. People have used statis-tics to recognize patterns for thousands of years. For example, the historian Thucydides (in his History of the Peloponnesian War) describes how the Athenians calculated the height of the wall of Platea in fifth century BC by counting bricks in an unplastered section of the wall. Because the count needed to be accurate, the Athenians took the average of the count by several solders.
The process of quantifying and understanding statistics is relatively new, but the science itself is quite old. An early attempt to begin documenting the importance of statistics appears in the ninth century when Al‐Kindi wrote Manuscript on Deciphering Cryptographic Messages. In this paper, Al‐Kindi describes how to use a combination of statistics and frequency analysis to decipher encrypted messages. Even in the beginning, statistics saw use in practical application of science to tasks that seemed virtually impossible to complete. Data science continues this process, and to some people it might actually seem like magic.
Outlining the core competencies
of a data scientist
Like most complex trades today, the data scientist requires knowledge of a broad range of skills in order to perform the required tasks. In fact, so many different skills are required that data scientists often work in teams. Someone who is good at gathering data might team up with an analyst and someone gifted in presenting information. It would be hard to find a single person with all the required skills. With this in mind, the following list describes areas in which a data scientist could excel (with more compet-encies being better):
✓Analysis: After you have data to work with and understand the complexities of that data, you can begin to perform an analysis on it. You perform some analysis using basic statistical tool skills, much like those that just about everyone learns in college. However, the use of specialized math tricks and algorithms can make patterns in the data more obvious or help you draw conclusions that you can’t draw by reviewing the data alone.
✓Presentation: Most people don’t understand numbers well. They can’t see the patterns that the data scientist sees. It’s important to provide a graphical presentation of these patterns to help others visualize what the numbers mean and how to apply them in a meaningful way. More important, the presentation must tell a specific story so that the impact of the data isn’t lost.
Linking data science and big data
Interestingly enough, the act of moving data around so that someone can perform analysis on it is a specialty called Extract, Transformation, and Loading (ETL). The ETL specialist uses programming languages such as Python to extract the data from a number of sources. Corporations tend not to keep data in one easily accessed location, so finding the data required to perform analysis takes time. After the ETL specialist finds the data, a programming language or other tool transforms it into a common format for analysis purposes. The loading process takes many forms, but this book relies on Python to perform the task. In a large, real‐world operation, you might find yourself using tools such as Informatica, MS SSIS, or Teradata to perform the task.
Given the number of products that most data scientists use, it may not be possible to use just one programming language. Yes, Python can load data, transform it, analyze it, and even present it to the end user, but it works only when the language provides the required functionality. You may have to choose other languages to fill out your toolkit. The languages you choose depend on a number of criteria. Here are the things you should consider:
✓How you intend to use data science in your code (you have a number of tasks to consider, such as data analysis, classification, and
regression)
✓Your familiarity with the language
✓The need to interact with other languages
✓The availability of tools to enhance the development environment
✓The availability of APIs and libraries to make performing tasks easier
Creating the Data Science Pipeline
Data science is partly art and partly engineering. Recognizing patterns in data, considering what questions to ask, and determining which algorithms work best are all part of the art side of data science. However, to make the art part of data science realizable, the engineering part relies on a specific process to achieve specific goals. This process is the data science pipeline, which requires the data scientist to follow particular steps in the preparation, analysis, and presentation of the data. The following sections help you understand the data science pipeline better so that you can understand how the book employs it during the presen-tation of examples.
Preparing the data
Performing exploratory data analysis
The math behind data analysis relies on engineering principles in that the results are provable and consistent. However, data science provides access to a wealth of statistical methods and algorithms that help you discover patterns in the data. A single approach doesn’t ordinarily do the trick. You typically use an iterative process to rework the data from a number of perspectives. The use of trial and error is part of the data science art.Learning from data
As you iterate through various statistical analysis methods and apply algorithms to detect patterns, you begin learning from the data. The data might not tell the story that you originally thought it would, or it might have many stories to tell. Discovery is part of being a data scientist. In fact, it’s the fun part of data science because you can’t ever know in advance precisely what the data will reveal to you.
Of course, the imprecise nature of data and the finding of seemingly random patterns in it means keeping an open mind. If you have preconceived ideas of what the data contains, you won’t find the information it actually does con-tain. You miss the discovery phase of the process, which translates into lost opportunities for both you and the people who depend on you.
Visualizing
Visualization means seeing the patterns in the data and then being able to react to those patterns. It also means being able to see when data is not part of the pattern. Think of yourself as a data sculptor — removing the data that lies outside the patterns (the outliers) so that others can see the masterpiece of information beneath. Yes, you can see the masterpiece, but until others can see it, too, it remains in your vision alone.
In some cases, the result of an analysis creates an automated response. For example, when a robot views a series of pixels obtained from a camera, the pixels that form an object have special meaning and the robot’s programming may dictate some sort of interaction with that object. However, until the data scientist builds an application that can load, analyze, and visualize the pixels from the camera, the robot doesn’t see anything at all.
Understanding Python’s Role
in Data Science
Given the right data sources, analysis requirements, and presentation needs, you can use Python for every part of the data science pipeline. In fact, that’s precisely what you do in this book. Every example uses Python to help you understand another part of the data science equation. Of all the languages you could choose for performing data science tasks, Python is the most flex-ible and capable because it supports so many third‐party libraries devoted to the task. The following sections help you better understand why Python is such a good choice for many (if not most) data science needs.
Considering the shifting profile
of data scientists
Some people view the data scientist as an unapproachable nerd who performs miracles on data with math. The data scientist is the person behind the cur-tain in an Oz‐like experience. However, this perspective is changing. In many respects, the world now views the data scientist as either an adjunct to a developer or as a new type of developer. The ascendance of applications of all sorts that can learn is the essence of this change. For an application to learn, it has to be able to manipulate large databases and discover new patterns in them. In addition, the application must be able to create new data based on the old data — making an informed prediction of sorts. The new kinds of applications affect people in ways that would have seemed like science fiction just a few years ago. Of course, the most noticeable of these applications define the behaviors of robots that will interact far more closely with people tomorrow than they do today.
From a business perspective, the necessity of fusing data science and appli-cation development is obvious: Businesses must perform various sorts of analysis on the huge databases it has collected — to make sense of the information and use it to predict the future. In truth, however, the far greater impact of the melding of these two branches of science — data science and application development — will be felt in terms of creating altogether new
kinds of applications, some of which aren’t even possibly to imagine with clarity today. For example, new applications could help students learn with greater precision by analyzing their learning trends and creating new instruc-tional methods that work for that particular student. This combination of sciences might also solve a host of medical problems that seem impossible to solve today — not only in keeping disease at bay, but also by solving prob-lems, such as how to create truly usable prosthetic devices that look and act like the real thing.
Working with a multipurpose, simple,
and efficient language
Many different ways are available for accomplishing data science tasks. This book covers only one of the myriad methods at your disposal. However, Python represents one of the few single‐stop solutions that you can use to solve complex data science problems. Instead of having to use a number of tools to perform a task, you can simply use a single language, Python, to get the job done. The Python difference is the large number scientific and math libraries created for it by third parties. Plugging in these libraries greatly extends Python and allows it to easily perform tasks that other languages could perform, but with great difficulty.
Python’s libraries are its main selling point; however, Python offers more than reusable code. The most important thing to consider with Python is that it supports four different coding styles:
✓Functional: Treats every statement as a mathematical equation and avoids any form of state or mutable data. The main advantage of this approach is having no side effects to consider. In addition, this coding style lends itself better than the others to parallel processing because there is no state to consider. Many developers prefer this coding style for recursion and for lambda calculus.
✓Imperative: Performs computations as a direct change to program state. This style is especially useful when manipulating data structures and produces elegant, but simple, code.
✓Object‐oriented: Relies on data fields that are treated as objects and manipulated only through prescribed methods. Python doesn’t fully sup-port this coding form because it can’t implement features such as data hiding. However, this is a useful coding style for complex applications because it supports encapsulation and polymorphism. This coding style also favors code reuse.
Learning to Use Python Fast
It’s time to try using Python to see the data science pipeline in action. The following sections provide a brief overview of the process you explore in detail in the rest of the book. You won’t actually perform the tasks in the following sections. In fact, you don’t install Python until Chapter 3, so for now, just follow along in the text. Don’t worry about understanding every aspect of the process at this point. The purpose of these sections is to help you gain an understanding of the flow of using Python to perform data sci-ence tasks. Many of the details may seem difficult to understand at this point, but the rest of the book will help you understand them.
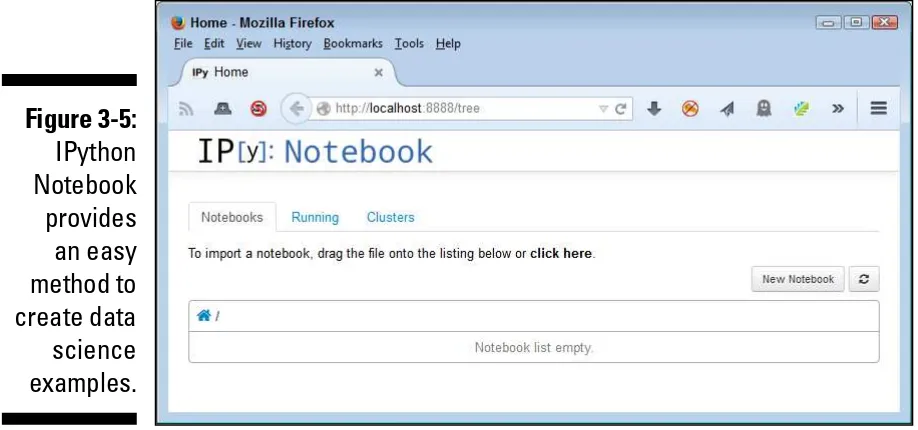
The examples in this book rely on a web‐based application named IPython Notebook. The screenshots you see in this and other chapters reflect how IPython Notebook looks in Firefox on a Windows 7 system. The view you see will contain the same data, but the actual interface may differ a little depend-ing on platform (such as usdepend-ing a notebook instead of a desktop system), oper-ating system, and browser. Don’t worry if you see some slight differences between your display and the screenshots in the book.
You don’t have to type the source code for this chapter in by hand. In fact, it’s a lot easier if you use the downloadable source (see the Introduction for details on downloading the source code). The source code for this chapter appears in the P4DS4D; 01; Quick Overview.ipynb source code file.
Loading data
Before you can do anything, you need to load some data. The book shows you all sorts of methods for performing this task. In this case, Figure 1-1 shows how to load a dataset called Boston that contains housing prices and other facts about houses in the Boston area. The code places the entire dataset in the boston variable and then places parts of that data in variables named X and y. Think of variables as you would storage boxes. The variables are important because they make it possible to work with the data.
Training a model
Figure 1-1: Loading data into variables so that you can manipulate it.
Figure 1-2: Using the variable content to train a linear
Viewing a result
Performing any sort of analysis doesn’t pay unless you obtain some benefit from it in the form of a result. This book shows all sorts of ways to view output, but Figure 1-3 starts with something simple. In this case, you see the coefficient output from the linear regression analysis.
One of the reasons that this book uses IPython Notebook is that the product helps you to create nicely formatted output as part of creating the applica-tion. Look again at Figure 1-3 and you see a report that you could simply print and offer to a colleague. The output isn’t suitable for many people, but those experienced with Python and data science will find it quite usable and informative.
Introducing Python’s Capabilities
and Wonders
In This Chapter
▶Delving into why Python came about
▶Getting a quick start with Python
▶Using Python for rapid prototyping and experimentation
▶Defining how Python provides speed of execution
▶Defining the power of Python for the data scientist
▶Exploring the Python and data science relationship
A
ll computers run on just one language — machine code. However, unless you want to learn how to talk like a computer in 0s and 1s, machine code isn’t particularly useful. You’d never want to try to define data science problems using machine code. It would take an entire lifetime (if not longer) just to define one problem. Higher‐level languages make it possible to write a lot of code that humans can understand quite quickly. The tools used with these languages make it possible to translate the human‐readable code into machine code that the machine understands. Therefore, the choice of languages depends on the human need, not the machine need. With this in mind, this chapter introduces you to the capabilities that Python provides that make it a practical choice for the data scientist. After all, you want to know why this book uses Python and not another language, such as Java or C++. These other languages are perfectly good choices for some tasks, but they’re not as suited to meet data science needs.of these libraries throughout the book as you work through the coding exam-ples. Knowing about these libraries in advance will help you understand the programming examples and why the book shows how to perform tasks in a certain way.
Even though this chapter does show examples of working with Python, you don’t really begin using Python in earnest until Chapter 4. This chapter pro-vides you with an overview so that you can better understand what Python can do. Chapter 3 shows how to install the particular version of Python used
for this book, and Chapter 4 gives you basic hands‐on exercises on how to work with Python. In short, if you don’t quite understand an example in this chapter, don’t worry: You get plenty of additional information in later chapters.
Why Python?
Python is the vision of a single person, Guido van Rossum. You might be sur-prised to learn that Python has been around a long time — Guido started the language in December 1989 as a replacement for the ABC language. Not much information is available as to the precise goals for Python, but it does retain ABC’s ability to create applications using less code. However, it far exceeds the ability of ABC to create applications of all types, and in contrast to ABC, boasts four programming styles. In short, Guido took ABC as a starting point, found it limited, and created a new language without those limitations. It’s an example of creating a new language that really is better than its predecessor.
Using the right language for the job
Computer languages provide a means for humans to write down instructions in a systematic and understandable way. Computers don’t actually understand computer languages — a computer relies on machine‐code for instructions. The reason languages are so important is that humans don’t characteristically understand machine language, so the conversion from something humans understand to something machines understand is essential. Python provides a
Python has gone through a number of iterations and currently has two development paths. The 2.x path is backward compatible with previous versions of Python, while the 3.x path isn’t. The compatibility issue is one that figures into how data science uses Python because at least some of the libraries won’t work with 3.x. In addition, some versions use different licens-ing because Guido was worklicens-ing at various companies durlicens-ing Python’s devel-opment. You can see a listing of the versions and their respective licenses at https://docs.python.org/3/license.html. The Python Software Foundation (PSF) owns all current versions of Python, so unless you use an older version, you really don’t need to worry about the licensing issue.
Grasping Python’s core philosophy
Guido actually started Python as a skunkworks project. The core concept was to create Python as quickly as possible, yet create a language that is flexible, runs on any platform, and provides significant potential for exten-sion. Python provides all these features and many more. Of course, there are always bumps in the road, such as figuring out just how much of the underlying system to expose. You can read more about the Python design philosophy at http://python‐history.blogspot.com/2009/01/ pythons‐design‐philosophy.html. The history of Python at http:// python‐history.blogspot.com/2009/01/introduction‐and‐ overview.html also provides some useful information.
Discovering present and future
development goals
The original development (or design) goals for Python don’t quite match what has happened to the language since that time. Guido originally intended Python as a second language for developers who needed to create one‐off code but who couldn’t quite achieve their goals using a scripting language. The original target audience for Python was the C developer. You can read about these original goals in the interview at http://www.artima.com/ intv/pyscale.html.
You can find a number of applications written in Python today, so the idea of using it solely for scripting didn’t come to fruition. In fact, you can find list-ings of Python applications at https://www.python.org/about/apps/
and https://www.python.org/about/success/.
(PEPs) at http://legacy.python.org/dev/peps/. These PEPs may or may not see the light of day, but they prove that Python is a living, growing language that will continue to provide features that developers truly need to create great applications of all types, not just those for data science.
Working with Python
This book doesn’t provide you with a full Python tutorial. (However, you can get a great start with my book, Beginning Programming with Python For Dummies, published by John Wiley & Sons, Inc.) You do get a quick review
of the language in Chapter 4. However, for now, it’s helpful to get a brief overview of what Python looks like and how you interact with it, as in the following sections.
Getting a taste of the language
Python is designed to provide clear language statements but to do so in an incredibly small space. A single line of Python code may perform tasks that another language usually takes several lines to perform. For example, if you want to display something on‐screen, you simply tell Python to print it, like this:
print "Hello There!"
This is an example of a 2.x print statement. The “Why Phython?” section of this chapter mentions that there are differences between the 2.x path and the 3.x path. If you use this line of code in 3.x, you get an error message:
File "<stdin>", line 1 print "Hello There!" ^ SyntaxError: invalid syntax
It turns out that the 3.x version of the same statement looks like this:
print("Hello There!")
Understanding the need for indentation
Python relies on indentation to create various language features, such as conditional statements. One of the most common errors that developers encounter is not providing the proper indentation for code. You see this prin-ciple in action later in the book, but for now, always be sure to pay attention to indentation as you work through the book examples. For example, here is an if statement (a conditional that says that if something meets the condi-tion, perform the code that follows) with proper indentation.if 1 < 2:
print("1 is less than 2")
The print statement must appear indented below the conditional statement. Otherwise, the condition won’t work as expected, and you might see an error message, too.
Working at the command line or in the IDE
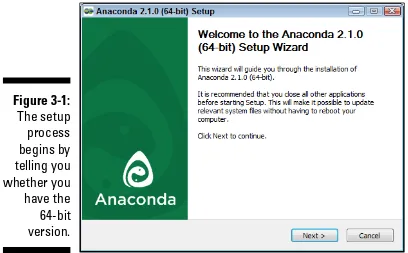
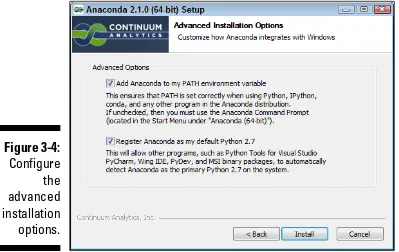
Anaconda is a product that makes using Python even easier. It comes with a number of utilities that help you work with Python in a variety of ways. The vast majority of this book relies on IPython Notebook, which is part of theAnaconda installation you create in Chapter 3. You saw this editor used in
Understanding the Anaconda package
The book approaches Anaconda as a product. In fact, you do install and interact with Anaconda as you would any other single product. However, Anaconda is actually a compilation of several open source applications. You can use these applications individually or in cooperation with each other to achieve specific coding goals. In most of the book, you use a single application, IPython Notebook, to accomplish tasks. However, you want to know about the other applications bundled in Anaconda to get the best use out of the product as a whole. A large number of data scientists rely on the Anaconda product bundling, which is why
Chapter 1 and you see it again later in the book. In fact, this book doesn’t use any of the other Anaconda utilities much at all. However, they do exist, and sometimes they’re helpful in playing with Python (as you do in Chapter 4). The following sections provide a brief overview of the other Anaconda utili-ties for creating Python code. You may want to experiment with them as you work through various coding techniques in the book.
Creating new sessions with Anaconda Command Prompt
Only one of the Anaconda utilities provides direct access to the command line, Anaconda Command Prompt. When you start this utility, you see a command prompt at which you can type commands. The main advantage of this utility is that you can start an Anaconda utility with any of the switches it provides to modify that utility’s standard environment. Of course, you start all the utilities using the Python interpreter that you access using the
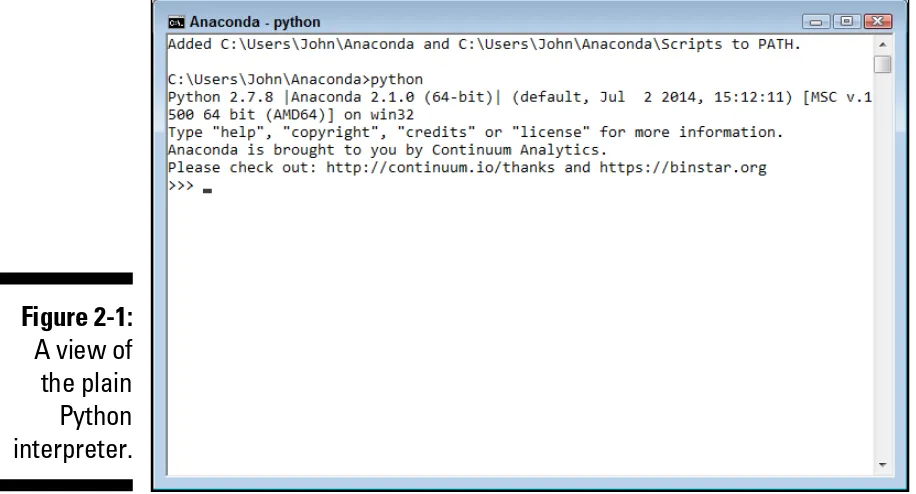
python.exe command. (If you have both Python 3.4 and Python 2.7 installed on your system and open a regular command prompt or terminal window, you may see the Python 3.4 version start instead of the Python 2.7 version, so it’s always best to open an Anaconda Command Prompt to ensure that you get the right version of Python.) So you could simply type python and press Enter to start a copy of the Python interpreter should you wish to do so. Figure 2-1 shows how the plain Python interpreter looks.
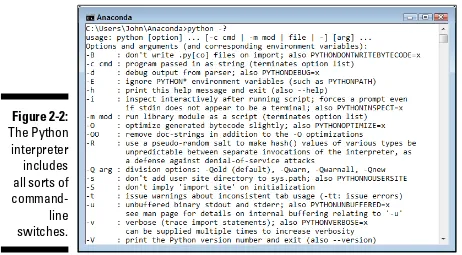
You quit the interpreter by typing quit() and pressing Enter. Once back at the command line, you can discover the list of python.exe command‐line switches by typing python ‐? and pressing Enter. Figure 2-2 shows just some of the ways in which you can change the Python interpreter environment.
If you want, you can create a modified form of any of the utilities provided by Anaconda by starting the interpreter with the correct script. The scripts appear in the Scripts subdirectory. For example, type python scripts/ ipython‐script.py and press Enter to start the IPython environment without using the graphical command for your platform.
Entering the IPython environment
The Interactive Python (IPython) environment provides enhancements to the standard Python interpreter. The main purpose of the environment shown in Figure 2-3 is to help you use Python with less work. To see these enhance-ments, type %quickref and press Enter.
One of the more interesting additions to IPython is a fully functional clear screen (cls) command. You can’t clear the screen easily when working in the Python interpreter, which means that things tend to get a bit messy after
Figure 2-2: The Python interpreter includes all sorts of command‐ line switches.
a while. It’s also possible to perform tasks such as searching for variables using wildcard matches. Later in the book, you see how to use the magic functions to perform tasks such as capturing the amount of time it takes to perform a task for the purpose of optimization.
Entering IPython QTConsole environment
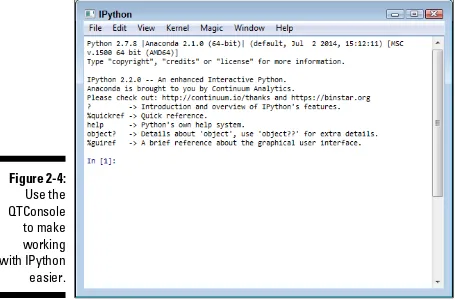
Trying to remember Python commands and functions is hard — and trying to remember the enhanced IPython additions is even harder. In fact, some people would say that the task is impossible (and perhaps they’re right). This is where the IPython QTConsole comes into play. It adds a GUI on top of IPython that makes using the enhancements that IPython provides a lot easier, as shown in Figure 2-4. Of course, you give up a little screen real estate to get this feature, and some hardcore programmers don’t like the idea of using a GUI, so you have to choose what sort of environment to work with when programming.
The enhanced commands appear in menus across the top of the window. All you need to do is choose the command you want to use. For example, to see the current application directory, choose Magic ➪ OS Magics ➪ %cd.
Editing scripts using Spyder
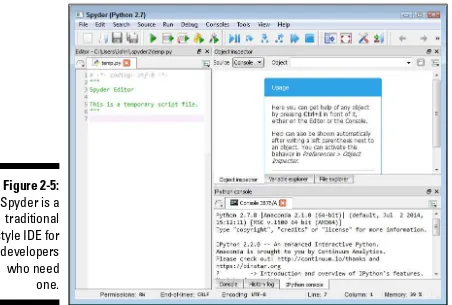
Spyder is a fully functional Integrated Development Environment (IDE). You use it to load scripts, edit them, run them, and perform debugging tasks. Figure 2-5 shows the default windowed environment.
The Spyder IDE is much like any other IDE that you might have used in the past. The left side contains an editor in which you type code. Any code you create is placed in a script file, and you must save the script before running it. The upper‐right window contains various tabs for inspecting objects, exploring variables, and interacting with files. The lower‐right window con-tains the Python console, a history log, and the IPython console. Across the top, you see menu options for performing all the tasks that you normally associate with working with an IDE.
Performing Rapid Prototyping
and Experimentation
Python is all about creating applications quickly and then experimenting with them to see how things work. The act of creating an application design in code without necessarily filling in all the details is prototyping. Python uses less code than other languages to perform tasks, so prototyping goes faster. The fact that many of the actions you need to perform are already defined as part of libraries that you load into memory makes things go faster still.
Data science doesn’t rely on static solutions. You may have to try multiple solutions to find the particular solution that works best. This is where experimentation comes into play. After you create a prototype, you use it
to experiment with various algorithms to determine which algorithm works best in a particular situation. The algorithm you use varies depending on the answers you see and the data you use, so there are too many variables to consider for any sort of canned solution.
The prototyping and experimentation process occurs in several phases. As you go through the book, you discover that these phases have distinct uses and appear in a particular order. The following list shows the phases in the order in which you normally perform them.
1. Building a data pipeline. To work with the data, you must create a pipe-line to it. It’s possible to load some data into memory. However, after the dataset gets to a certain size, you need to start working with it on disk or by using other means to interact with it. The technique you use for gaining access to the data is important because it impacts how fast you get a result.
2. Performing the required shaping. The shape of the data — the way in which it appears and its characteristics (such a data type), is important in performing analysis. To perform an apples‐to‐apples comparison, like data has to be shaped the same. However, just shaping the data the same isn’t enough. The shape has to be correct for the algorithms you
employ to analyze it. Later chapters (starting with Chapter 6) help you understand the need to shape data in various ways.
3. Analyzing the data. When analyzing data, you seldom employ a single algorithm and call it good enough. You can’t know which algorithm will produce the same results at the outset. To find the best result from your dataset, you experiment on it using several algorithms. This practice is emphasized in the later chapters of the book when you start performing serious data analysis.
4. Presenting a result. A picture is worth a thousand words, or so they say. However, you need the picture to say the correct words or your message gets lost. Using the MATLAB plotting functionality provided by the matplotlib library, you can create multiple presentations of the same data, each of which describes the data graphically in different ways. To ensure that your meaning really isn’t lost, you must experiment with various presentation methods and determine which one works best.
Considering Speed of Execution
✓Dataset size: Data science relies on huge datasets in many cases. Yes, you can make a robot see objects using a modest dataset size, but when it comes to making business decisions, larger is better in most situations. The application type determines the size of your dataset in part, but dataset size also relies on the size of the source data. Underestimating the effect of dataset size is deadly in data science applications, especially those that need to operate in real time (such as self‐driving cars).
✓Loading technique: The method you use to load data for analysis is critical, and you should always use the fastest means at your disposal, even if it means upgrading your hardware to do so. Working with data in memory is always faster than working with data stored on disk. Accessing local data is always faster than accessing it across a network. Performing data science tasks that rely on Internet access through web
services is probably the slowest method of all. Chapter 5 helps you understand loading techniques in more detail. You also see the effects of loading technique later in the book.
✓Coding style: Some people will likely try to tell you that Python’s pro-gramming paradigms make writing a slow application nearly impossible. They’re wrong. Anyone can create a slow application using any language by employing coding techniques that don’t make the best use of pro-gramming language functionality. To create fast data science applica-tions, you must use best‐of‐method coding techniques. The techniques demonstrated in this book are a great starting point.
✓Machine capability: Running data science applications on a memory‐ constrained system with a slower processor is impossible. The system you use needs to have the best hardware you can afford. Given that data science applications are both processor and disk bound, you can’t really cut corners in any area and expect great results.
✓Analysis algorithm: The algorithm you use determines the kind of result you obtain and controls execution speed. Many of the chapters in the latter parts of this book demonstrate multiple methods to achieve a goal using different algorithms. However, you must still experiment to find the best algorithm for your particular dataset.
Visualizing Power
Python makes it possible to explore the data science environment without resorting to using a debugger or debugging code, as would be needed in many other languages. The print statement (or function, depending on the version of Python you use) and dir() function let you examine any object interactively. In short, you can load something up and play with it for a while to see just how the developer put it together. Playing with the data, visualiz-ing what it means to you personally, can often help you gain new insights and create new ideas. Judging by many online conversations, playing with the data is the part of data science that its practitioners find the most fun.
You can play with data using any of the tools found in Anaconda, but one of the best tools for the job is IPython because you don’t really have to worry too much about the environment, and nothing you create is permanent. After all, you’re playing with the data. Therefore, you can load a dataset to see just what it has to offer, as shown in Figure 2-6. Don’t worry if this code looks foreign
and hard to understand right now. Chapter 4 provides an overview that helps explain it. Just follow along with the concept of playing with data for now.
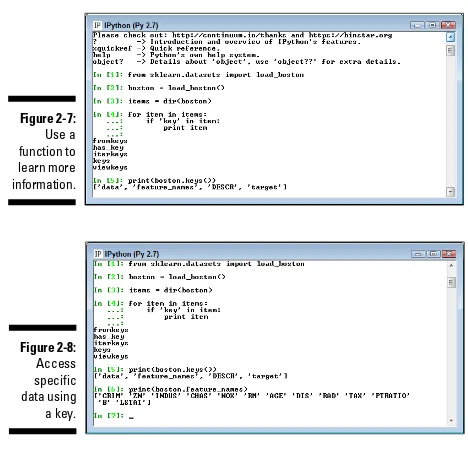
In this case, you use Python code to discover all the key‐related functions included with the dataset. You can use these functions to perform useful work with the dataset as part of building your application. For example, in Figure 2-7, you can see how the keys() function displays a list of keys you can use to access data.
When you have a list of keys you can use, you can access individual data items. For example, Figure 2-8 shows a list of all the feature names contained in the Boston dataset. Python really does make it possible to know quite a lot about a dataset before you have to work with it in depth.