www.elsevier.com / locate / livprodsci
Lifetime reproductive performance in female pigs having
distinct reasons for removal
*
Thomaz Lucia Jr. , Gary D. Dial, William E. Marsh
University of Minnesota, College of Veterinary Medicine, St. Paul, MN 55108, USA Received 15 June 1998; received in revised form 15 October 1998; accepted 7 September 1999
Abstract
This study describes the reasons for removal of female pigs distributed across parity categories, and evaluates how parameters of lifetime productivity differ for females having distinct removal reasons. The study analyzed lifetime records
from 7973 females. Those records were obtained from 28 herds from the PigCHAMP research database having high-quality data during a five-year period. Female life expectancy corresponded to 3.3 parities at removal or 1.6 years spent in the breeding herd. The most common removal reason was culling attributed to reproductive disorders (33.6%), followed by culling for sub-optimal litter performance (20.6%). Sows culled for old age (8.7% of the removals) spent proportionally fewer days in non-productive periods, and produced more weaned pigs annually and over a lifetime than females removed for other reasons (P,0.05). In contrast, females culled for reproductive failure accumulated the largest proportion of non-productive days (NPD) during the time spent in the breeding herd, and produced the fewest weaned pigs per lifetime and per year (P,0.05). These findings indicate that culling for reproductive reasons is more common among low-parity females, which suggests that minimisation of NPD at early reproductive cycles is crucial to optimise female lifetime reproductive efficiency. 2000 Elsevier Science B.V. All rights reserved.
Keywords: Removal reason; Lifetime reproductive efficiency; Female pigs
1. Introduction inventories usually have high proportions of
low-parity females. Thus, the majority of the female Removal rates in commercial pig herds are com- removals concentrate at low parities, being mostly monly between 40 and 55%, which usually relates to attributed to reproductive failure (D’Allaire et al., a mean parity between three and four at removal 1987; Dijkhuizen et al., 1989; Patterson et al., 1996). (Dagorn and Aumaitre, 1979; D’Allaire et al., 1987; It would be expected for such females to accumulate Lucia et al., 1999). As a consequence, breeding herd large amounts of non-productive days (NPD), which would relate to reproductive inefficiency due to the strong negative association between NPD accumula-*Corresponding author. Present address: Universidade Federal
tion and pigs weaned per female per year (PW/ F / Y) ´
de Pelotas, Faculdade de Veterinaria, Centro de Biotecnologia,
(Wilson et al., 1986; Polson et al., 1990). However, 96010-900, Pelotas, RS, Brazil. Tel. / fax:155-532-757-350.
E-mail address: [email protected] (T. Lucia Jr.) the relationship between NPD and reasons for female
removal has not been clearly characterised, since removal from the breeding herd; type of removal NPD are commonly estimated as a herd-level factor (cull or death); reason attributed for removal; and whereas female removal is defined as an individual parity number at removal. A total of 7973 female event. Furthermore, associations between female records were gathered for further analyses. The herd removal and herd reproductive efficiency are not that contributed the most records provided 12% of completely clarified. One reason for this would be the total analysed records, followed by three herds because herds producing more PW/ F / Y commonly that provided 7–8% each. On the other hand, three produce more litters per female annually, which smaller herds provided only about 1% of the ana-might result in higher culling rates due to a higher lysed records each. All herds were located in North probability of removal within farrowing-to-farrowing America, distributed across Canada and the mid-intervals (Stein et al., 1990). Another reason would west region of the United States. Analysis of
be because estimators of reproductive performance PigCHAMP reports during the five-year period of such as PW/ F / Y have limited accuracy beyond a interest indicated that the average annual culling rate one-year scope, which justifies why parity number at for the herds that qualified for the study during this removal is commonly used to approximate female period was 46.9%. However, since the study was life expectancy and lifetime productivity. conducted at the individual female level and consid-This study describes the distribution of removal ered only removed females, estimates of culling rates reasons for females having different parity number at were not calculated. Average lactation length for the removal, and investigates how estimates of lifetime qualifying herds during the period of interest was reproductive performance differ for females that equal to 23.9 days.
were removed from the breeding herd due to distinct The number of days spent in the herd (herd days)
reasons. was estimated by the difference between the date of
removal and the date of entry. The number of herd days per mated female was also estimated, after
2. Material and methods excluding the entry-to-first service interval from the
total herd days, to adjust for the inconsistent record-2.1. Data collection and processing ing of the entry event across herds (Polson et al., 1990; Marsh et al., 1992). For each female, the Twenty-eight herds with high quality data number of days spent in gestation and lactation throughout a five-year period (1986–90) were iden- during herd life was summed. As a NPD is any day
tified in the PigCHAMP database (PigCHAMP , spent by a female in the breeding herd in periods 1992). The criteria used to define data quality other than lactation or gestation (Wilson et al., 1986; required a maximum 10% fluctuation in breeding Polson et al., 1990), the proportion of lifetime NPD herd inventory. So, this study included only herds was calculated by the formula below, as described by within a typical production cycle, such as those that (Lucia et al., 1999):
were not under start-up, repopulation or expansion.
Lifetime NPD (%) Additionally, the qualified herds should have no
more than 5% of unrecorded events for mating, (Herd days2lactation days2gestation days) ]]]]]]]]]]]]] 5
farrowing or weaning during the period of interest. (herd days) These criteria have been used in previous studies
3100% using retrospective database information (Polson et
al., 1990; Marsh et al. 1992). The percent of lifetime NPD was also calculated on a Within each herd, qualifying females were admit- per mated female basis.
parities at the time of removal. Estimates of annual Females having culling attributed to ‘old age’ repre-productivity, such as the number of pigs weaned, the sented a single category. That definition can be very number of litters weaned and the number of NPD per variable across herds (D’Allaire et al., 1987), since year of herd life, were calculated, on both total and sows may be automatically culled after a certain per mated female basis, by combining cumulative number of parities or can be culled at early parities if counts with herd days. These annual estimates were they are considered too old for a specific parity calculated considering only females that spent at number. The category classified as ‘miscellaneous’ least one entire year in the breeding herd. For included unthrifty females, females removed for instance, the number of pigs weaned per female per marketing reasons or for behavioural problems, and year of herd life (PW/ F / YL) was calculated as those having culling reasons inconsistent with their
follows: biological data or unknown.
PW/ F / YL
2.3. Statistical analyses 5(Pigs weaned during herd life / herd days)
3365 days Frequency distributions and cross-tabulations were
used to describe the occurrence of removal reasons The criteria used for data collection, sampling and
and parity at removal. For those procedures, females calculations of estimates of lifetime productivity
having five or six parities at removal were grouped have been described elsewhere (Lucia et al., 1999).
together, as well as those having seven or eight parities at removal, and those removed at parity nine 2.2. Reasons for removal or higher (91). Descriptive statistics were generated
for estimators of lifetime productivity. Analysis of For each removal event (either cull or death), variance was used to evaluate how estimates of specific reasons for removal may or may not be lifetime productivity differed as a function of reason recorded at the farm level. Overall, 42 removal for removal, after adjustment for the effects of herd reasons were recorded for the qualifying females. and month of female admission in the breeding herd. Those removal reasons were grouped into seven The analysed estimates were: parity at removal, herd categories. ‘Death’ included all females that died or days, percent of lifetime NPD, total number of pigs were destroyed for humane reasons, whether or not a born during lifetime, number of pigs born alive specific reason for death was recorded. Culls attribu- during lifetime, number of pigs weaned during ted to metritis, prolapses, vulvar discharges, absces- lifetime, total number of pigs born per litter weaned, ses and disorders on multiple systems (cardiovascu- number of pigs born alive per litter weaned, number lar, central nervous, gastrointestinal, respiratory or of pigs weaned per litter weaned, and estimates of urogenital) were grouped into a category called annual productivity (number of NPD per year of herd ‘disease / peripartum problems’. Although such cul- life, litters weaned per year of herd life, and pigs ling reasons may not be necessarily related, they weaned per year of herd life). When dependent were grouped together because they represented a variables were available on either a total or per small proportion of the total. Culls attributed to mated female basis, the latter were analysed, to ‘locomotion’ disorders referred to reasons such as adjust for differences in recording of entry events injuries, lameness, unsoundness or downer across herds. The resulting model was as follows: syndrome. The ‘litter performance’ category
corres-ponded to culls for farrowing productivity (total or Yijkn5m 1Ri1Hj1Mk1eijkn, born alive litter size), lactation or weaning
per-formance, and farrowing difficulties. Culls for ‘re- where Yijkn is the individual performance for a given production’ were attributed to lack of observed female removed for the ith reason, in the jth herd, oestrus, conception failure and failure to farrow and that entered the herd in the kth month; m is the (which included definitions such as negative preg- overall mean; R is the effect of the ith removali
effect of the kth entry month; and eijknis the random Females classified in the ‘miscellaneous’ category error. Differences in lifetime productivity across corresponded to 13.3% of all removals, but 788 of categories of removal reasons were tested using the these females (74.2%) did not have a recorded Fisher’s protected least significant difference test. reason for culling. Among those females having Even though the effect of interaction between the known culling reasons, 132 were unthrifty, 56 had herd and removal reason was initially included in the behavioural problems, 44 were transferred out of the model, this effect was excluded from the final model herd due to market reasons, and 42 had removal due to lack of statistical significance. All analyses of reasons inconsistent with their biological data or that variance were conducted through the General Linear occurred in a proportion too small to be reported
Models procedure of SAS (1988). alone. Almost 9% of all females had no reason for culling other than old age (Table 1).
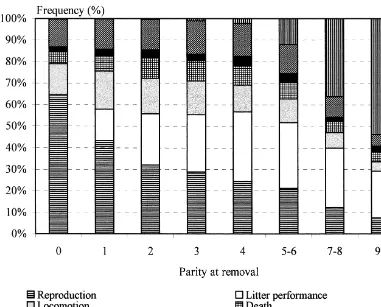
Nearly 19% of the removals occurred for
parity-3. Results zero females, while almost 15% occurred for females
removed at parity one (Table 1). Among the parity-Among all females having a recorded removal zero females, nearly 65% were culled for ‘reproduc-event, 92.6% were culled and 7.4% were removed tion’ and 14% were culled for ‘locomotion’ problems due to death (Table 1). Females having an unknown (Fig. 1). For females having one parity at removal, or unrecorded reason for removal corresponded to reproductive reasons and locomotion disorders ac-13.5% of the total, including 285 records in the counted for 43% and 18% of the removals, respec-‘death’ category, and 788 records for culled females tively. Litter performance was the most common classified in the ‘miscellaneous category’. Thus, only removal reason for females having four to six 51.8% of the females in the ‘death’ category had a parities, whereas old age was the most common recorded reason for death. reason for removal among females having more than
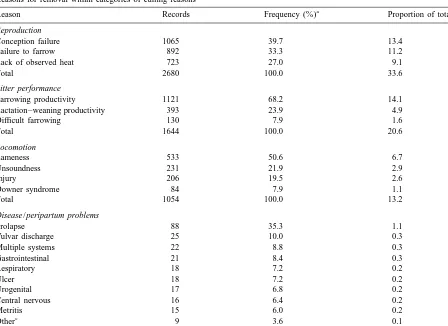
Culls attributed to ‘reproduction’ accounted for the seven parities.
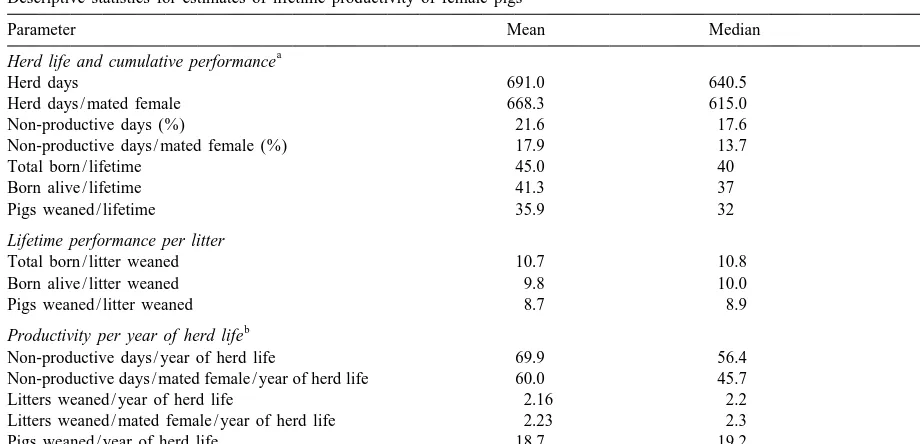
largest proportion of removals (33.6%) across Mean herd life for all females was 582.7 herd categories (Table 1). Nearly 36% of the reproduc- days. Females removed at parity zero spent, on tion-related culls occurred for parity-zero females. average, 119.9 days in the breeding herd. Mean herd Conception failure was the most common reason for life for females removed at parity one or higher was reproductive culling, followed by failure to farrow 668 days, and was 691 days when estimated on a per and lack of observed oestrus (Table 2). Culls for mated female basis (Table 3). Mean parity at remov-litter performance accounted for 20.6% of all remov- al for all females was 3.3. The proportion of lifetime als (Table 1). Locomotion problems represented 13% NPD for all females was 36.4%, and was 25% when of all removals (Table 1); nearly 55% of such culls estimated on a per mated female basis. Without were among females having 0–2 parities at removal. considering females removed at parity zero (having
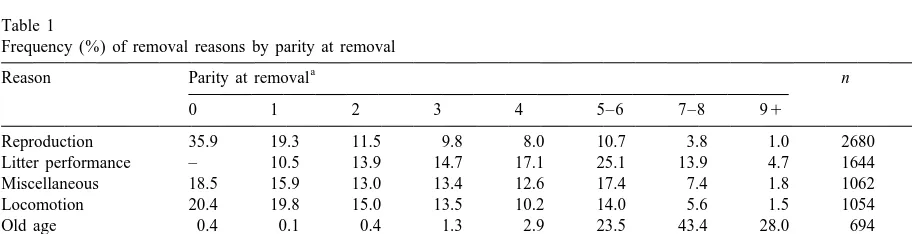
Table 1
Frequency (%) of removal reasons by parity at removal
a
Reason Parity at removal n (%)
0 1 2 3 4 5–6 7–8 91
Reproduction 35.9 19.3 11.5 9.8 8.0 10.7 3.8 1.0 2680 33.6
Litter performance – 10.5 13.9 14.7 17.1 25.1 13.9 4.7 1644 20.6
Miscellaneous 18.5 15.9 13.0 13.4 12.6 17.4 7.4 1.8 1062 13.3
Locomotion 20.4 19.8 15.0 13.5 10.2 14.0 5.6 1.5 1054 13.2
Old age 0.4 0.1 0.4 1.3 2.9 23.5 43.4 28.0 694 8.7
Death 14.2 14.1 16.1 14.4 13.6 17.5 7.5 2.7 590 7.4
Disease / peripartum 12.9 15.3 13.7 10.8 14.9 22.5 6.4 3.6 249 3.1
Total (%) 18.7 14.9 12.1 11.4 10.9 17.0 10.4 4.5 7973 100.0
a
Table 2
Reasons for removal within categories of culling reasons
a b
Reason Records Frequency (%) Proportion of total (%)
Reproduction
Conception failure 1065 39.7 13.4
Failure to farrow 892 33.3 11.2
Lack of observed heat 723 27.0 9.1
Total 2680 100.0 33.6
Includes abscess, cardiovascular conditions and skin-cutaneous conditions.
spent the entire herd life in non-productive ac- culled for reproduction accumulated the largest tivities), mean lifetime NPD was between 18 and proportion of lifetime NPD across categories (P,
21.6% (Table 3). 0.01).
Fig. 1. Reason-specific proportions of removal by parity at removal.
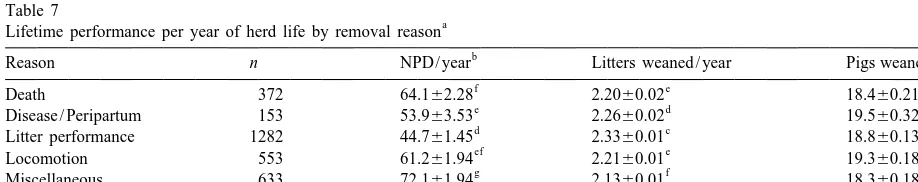
Females having herd life at least one year long removed for reproductive failure. NPD accumulation produced 2.16 to 2.23 litters and nearly 19 weaned is negatively associated with annual reproductive pigs, and wasted 60 to 70 NPD per each year spent efficiency measured by the number of pigs weaned in the breeding herd (Table 3). Annual productivity per female per year, as already characterised at the was highest for females culled for old age (Table 7) herd level (Wilson et al., 1986; Polson et al., 1990; and lowest for those culled for reproductive failure Dial et al., 1992). When measured over herd life, the
(P,0.05). negative association between NPD and female
re-productive efficiency is better characterised when NPD are expressed as proportions of herd life wasted
4. Discussion in non-productive activities rather than by
Table 3
Descriptive statistics for estimates of lifetime productivity of female pigs
Parameter Mean Median SD
a Herd life and cumulative performance
Herd days 691.0 640.5 357.3
Herd days / mated female 668.3 615.0 359.4
Non-productive days (%) 21.6 17.6 15.9
Non-productive days / mated female (%) 17.9 13.7 15.1
Total born / lifetime 45.0 40 29.7
Born alive / lifetime 41.3 37 27.1
Pigs weaned / lifetime 35.9 32 23.3
Lifetime performance per litter
Total born / litter weaned 10.7 10.8 2.2
Born alive / litter weaned 9.8 10.0 2.1
Pigs weaned / litter weaned 8.7 8.9 1.8
b Productivity per year of herd life
Non-productive days / year of herd life 69.9 56.4 52.0
Non-productive days / mated female / year of herd life 60.0 45.7 50.5
Litters weaned / year of herd life 2.16 2.2 0.4
Litters weaned / mated female / year of herd life 2.23 2.3 0.4
Pigs weaned / year of herd life 18.7 19.2 4.3
Pigs weaned / mated female / year of herd life 19.3 19.8 4.3
a
n56303 females having at least one parity at removal.
b
n54887 females that spent at least one year in the breeding herd.
Table 4
a
Parity at removal, herd life and lifetime non-productive days (NPD) by removal reason
b b
Reason n Parity at removal Herd days NPD (%)
ef e e
Death 580 3.260.09 533.8614.00 25.260.92
e e d
Disease / peripartum 241 3.360.14 544.6621.60 18.061.43
d d c
All estimates were calculated including parity-zero females.
b
Estimates calculated on a per mated female basis.
c,d,e,f,g,h
Least square means6standard errors in the same column having unequal superscripts differ across categories of removal reasons (P,0.01).
failure also produced fewer pigs weaned, both per pregnancy checking (Dial et al., 1992). The weanin-year of herd life and during total herd life, than g-to-first service interval of primiparous females females removed due to other reasons, it can be should also be minimised, which requires optimi-inferred that minimisation of removals for reproduc- sation of feed intake during lactation and adjustment tive failure is critical to optimise lifetime reproduc- for seasonal and environmental risk factors (Koketsu tive efficiency. Thus, reproductive management prac- et al., 1996).
Table 5
Cumulative lifetime pig output by removal reason
Reason n Total born / lifetime Born alive / lifetime Pigs weaned / lifetime
c c c
Death 496 40.361.16 36.961.06 30.760.91
c c c
Disease / peripartum 210 42.961.76 38.661.62 33.161.38
b b b
Least square means6standard errors in the same column having unequal superscripts differ across categories of removal reasons (P,0.05).
Table 6
Lifetime pig output per litter weaned (LW) by removal reason
Reason n Total born / LW Born alive / LW Pigs weaned / LW
b b c
Death 496 10.960.09 10.060.09 8.360.08
b b b
Disease / Peripartum 210 10.960.15 9.960.14 8.760.11
c c d
Least square means6standard errors in the same column having unequal superscript differ across categories of removal reasons (P,0.05).
Table 7
a
Lifetime performance per year of herd life by removal reason
b
Reason n NPD/ year Litters weaned / year Pigs weaned / year
f e ef
Death 372 64.162.28 2.2060.02 18.460.21
e d d
Disease / Peripartum 153 53.963.53 2.2660.02 19.560.32
d c de
Estimates calculated on a per mated female basis, including only sows that spend at least one year in the breeding herd.
b
NPD5Non-productive days.
c,d,e,f,g,h
Least square means6standard errors in the same column having unequal superscripts differ across categories of removal reasons (P,0.05).
current productivity of a given female and the Validation of removals for reproductive failure would potential performance of a replacement (Dijkhuizen probably reveal some inaccuracy in culling criteria, et al., 1986; Huirne et al., 1991). In the case of as reported by Einarsson et al. (1974) who found that reproductive failure, decision-makers may consider a substantial proportion of genital organs of gilts that, at a given point in time, it would be more culled for anoestrus actually showed evidence of profitable to replace rather than to retain any further active corpora lutea or pregnancy. True validation of a female that accumulated a large amount of NPD reasons for removals for death, disease and peripar-early in life and that may continue to be inefficient tum and locomotion problems could only be accom-subsequently. On the other hand, decision-makers plished by necropsy and clinical or laboratory may set a target for maximum life expectancy when evaluation. Validation of removals for litter perform-a lperform-arge pig output is perform-alreperform-ady guperform-arperform-anteed, perform-after which ance or old age through methods other than analysis culling would be a function of parity number. of retrospective records is likely unfeasible, since Among the females analysed in this study, those those culls are based on decisions that are man-culled for old age achieved the highest lifetime agement-dependent and potentially subjective. productivity, since they produced more pigs weaned Another potential limitation of this study is the fact per year spent in the herd and during herd life than that extrapolation of its results may be limited to those having other removal reasons. Nevertheless, herds having stable inventories and good quality data that high level of performance should not be over- during long time periods. However, this study ana-emphasised because females culled for old age are lysed estimates of reproductive performance esti-probably not representative of an average female, as mated longitudinally during the herd life of a large they corresponded to less than 9% of the total number of females followed over a long time period, removed females. In comparison with females culled which is an advantage that is probably not possible for litter performance, those culled for old age to achieve under experimental conditions.
produced three extra litters during a herd life longer by nearly 1.2 years, even though the percent of
lifetime NPD accumulated by females in those two 5. Conclusions
categories of removal reasons did not differ. Females
culled for litter performance produced on average 4.4 Breeding inventories are commonly made up of a litters during herd life, which is in agreement with large proportion of young females, which are more studies that reported that reduced litter size is not a prone to suffer from reproductive failure and to major risk factor for removal of low-parity females accumulate NPD at early reproductive cycles before (Clark and Leman, 1987; D’Allaire et al., 1987). farrowing for the first time or within the interval Culls for locomotion problems tended to be more between the first and the second parities. The majori-common for low-parity females, as reported else- ty of the females removed from the breeding herd are where (Sehested and Schjerve, 1996). However, culled for reproductive failure, thus having short locomotion disorders may be more prevalent than herd life and sub-optimal reproductive efficiency, removals due to locomotion problems, since females since their weaned pig output during herd life is having locomotion problems may have culling attrib- lower than that for females having other reasons for uted to other reasons as well. Females having removal. As the proportion of NPD during herd life locomotion problems may experience some inability was highest for females culled for reproductive to mate under natural conditions, which may in- failure, minimisation of NPD in low-parity females fluence both their subsequent fertility and litter size. can be considered critical to optimise lifetime prod-Those females may also reduce feed consumption uctivity, which can be achieved by applying good and produce less milk during lactation, which may management for oestrus detection and pregnancy lead to poor litter performance and increased piglet checking. However, without close attention to areas
mortality. such as nutrition and genetics, such practices may in
Koketsu, Y., Dial, G.D., Pettigrew, J.E., King, V.L., 1996. Feed identified more easily. On the other hand, if
manage-intake pattern during lactation and subsequent reproductive ment interventions planned to improve female life
performance of sows. J. Anim. Sci. 74, 2875–2884. expectancy are based solely on setting more flexible Lucia, T., Dial, G.D., Marsh, W.E., 1999. Estimation of lifetime targets for culling rates, the most likely consequence productivity of female swine. J. Am. Vet. Med. Assoc. 214, would be a higher retention of inefficient females, 1056–1059.
Marsh, W.E., Van Lier, P., Dial, G.D., 1992. A profile of swine
which could reduce overall herd productivity.
production in North America: I. PigCHAMP breeding herd data analysis for 1990. In: Proceedings of the 12th International Pig Veterinary Society Congress, Hague, Holland, p. 584.
References Patterson, R.A., Cargill, C.F., Poiton, A.M., 1996. Investigating
sow deaths and excessive culling in Australian pig herds. In: Proceedings of the 14th International Pig Veterinary Society Clark, L.K., Leman, A.D., 1987. Factors influencing litter size in
Congress, Bologna, Italy, p. 493. swine: Parity 3 through 7 females. J. Am. Vet. Med. Assoc. 1,
49–58. PigCHAMP , 1992. PigCHAMP Reports Manual, Version 3.0,
Dagorn, J., Aumaitre, A., 1979. Sow culling: reasons for and University of Minnesota, St. Paul, MN, USA.
effect on productivity. Liv. Prod. Sci. 6, 167–177. Polson, D.D., Dial, G.D., Marsh, W.E., 1990. A biological and D’Allaire, S., Stein, T.E., Leman, A.D., 1987. Culling patterns in financial characterization of non-productive days. In: Proceed-selected Minnesota swine breeding herds. Can. J. Vet. Res. 51, ings of the 11th International Congress Pig Veterinary Society,
506–512. Lausanne, Switzerland, p. 372.
Dial, G.D., Marsh, W.E., Polson, D.D., Vaillancourt, J.-P., 1992. SAS, 1988. SAS / Stat User’s Guide (release 6.03), SAS Institute Reproductive failure: differential diagnosis. In: Leman, A.D., Inc, Cary, NC.
Straw, B.E., Mengeling, W.L., D’Allaire, S., Taylor, D.J. Schukken, Y.H., Buurman, J., Huirne R, B.M., Willemse, A.H., (Eds.), Diseases of Swine, 7th ed, Iowa State University Press, Vernooy, J.C.M., van den Broek, J. et al., 1994. Evaluation of Ames, pp. 88–137. optimal age at first conception in gilts from data collected in Dijkhuizen, A.A., Morris, R.S., Morrow, M., 1986. Economic commercial swine herds. J. Anim. Sci. 72, 1387–1392.
optimization of culling strategies in swine breeding herds using Sehested, E., Schjerve, A., 1996. Aspects of sow longevity based the ‘PorkCHOP computer program’. Prev. Vet. Med. 4, 341– on analyses of Norwegian sow recording data. In: Proceedings
353. Nordiska Jordbruksforskares Forening, Seminar no. 265, Re-¨
Dijkhuizen, A.A., Krabbenborg, R.M.M., Huirne, R.B.M., 1989. search Centre Foulum, Denmark, pp. 9–16.
Sow replacement: a comparison of farmers’ actual decisions Stein, T.E., Dijkhuizen, A.A., D’Allaire, S., Morris, R.S., 1990. and model recommendations. Liv. Prod. Sci. 23, 207–218. Sow culling and mortality in commercial swine breeding herds. Einarsson, S., Linde, C., Setergreen, I., 1974. Studies of the Prev. Vet. Med. 9, 85–94.
genital organs of gilts culled for anoestrus. Theriogenology 2, Wilson, M.R., Friendship, R.M., McMillan, I., Hacker, R.R., 109–113. Pieper, R., Swaminathan, S., 1986. A survey of productivity Huirne, R.B.M., Dijkhuizen, A.A., Pijpers, A., Verheijden, J.H.M., and its component interrelationship in Canadian swine herds. J.
van Gulick, P., 1991. An economic expert system on the Anim. Sci. 62, 576–582. personal computer to support sow replacement decisions. Prev.