ERROR SOURCES IN PROCCESSING LIDAR BASED BRIDGE INSPECTION
H. Biana, *, S. E. Chen b, W. Liu ca Department of Automation, Jiangsu University of Science and Technonogy, No. 2 Mengxi Road, Zhenjiang, China -
b Department of Civil and Environmental Engineering, UNC Charlotte, 9201 University City Blvd, Charlotte, USA -
c College of Transportation, Dalian University of Technology, No.2 Linggong Road, Dalian, China- [email protected]
Commission VI, WG IV/3
KEY WORDS: Bridge Inspection, LiDAR Application, Data Quality Management, Remote Sensing
ABSTRACT:
Bridge inspection is a critical task in infrastructure management and is facing unprecedented challenges after a series of bridge failures. The prevailing visual inspection was insufficient in providing reliable and quantitative bridge information although a systematic quality management framework was built to ensure visual bridge inspection data quality to minimize errors during the inspection process. The LiDAR based remote sensing is recommended as an effective tool in overcoming some of the disadvantages of visual inspection. In order to evaluate the potential of applying this technology in bridge inspection, some of the error sources in LiDAR based bridge inspection are analysed. The scanning angle variance in field data collection and the different algorithm design in scanning data processing are the found factors that will introduce errors into inspection results. Besides studying the errors sources, advanced considerations should be placed on improving the inspection data quality, and statistical analysis might be employed to evaluate inspection operation process that contains a series of uncertain factors in the future. Overall, the development of a reliable bridge inspection system requires not only the improvement of data processing algorithms, but also systematic considerations to mitigate possible errors in the entire inspection workflow. If LiDAR or some other technology can be accepted as a supplement for visual inspection, the current quality management framework will be modified or redesigned, and this would be as urgent as the refine of inspection techniques.
1. INTRODUCTION 1.1 Background
Visual inspection is currently the prevailing method performed for highway bridge inspection even since a series of bridge failures which challenged the current bridge safety monitoring program (Brinckerhoff, 1993 and Subramanian, 2008). During visual inspection, the inspection team needs to walk to the site and observe the bridge conditions and find out bridge defects following the federal or state bridge inspection procedures, and input the inspection data into the bridge management software (BMS). Obviously, human errors are the dominant factor that contributes to the uncertainties of the inspection result because of the nature of this method.
Improving bridge inspection data quality is important, because it is the foundation of all effective bridge management operations (Dietrich et al., 2005 and Moore, et al., 2001). Bridge inspection data is essential in determining how to perform bridge maintenance, repairs, rehabilitations and replacement of a bridge. In fact, effective bridge management necessarily means optimal allocation of limited infrastructure maintenance resources.
FHWA has adopted systematic quality management framework to ensure visual bridge inspection data quality though minimizing errors during data generation (FHWA, 2005). The framework recommends documenting the entire quality control (QC) and quality assurance (QA) program, and then developing the recommended bridge inspection manual accordingly. The specific directions for QC/QA operations of bridge inspection are designed to guarantee data quality within the framework. Figure
* Corresponding author.
1 shows the recommendation for data quality management within the FHWA framework.
Figure 1. Data quality management in bridge inspection (Dietrich et al., 2005)
1.2 The New Stage of Bridge Inspection
The lack of cost-effective and qualitative inspection technologies for highway bridges has also become an apparent limiting factor for achieving a highly effective nationwide bridge management system (Orcesi & Frangopol, 2010). An effective bridge management system requires precise and accurate bridge condition data and can be used to minimize unnecessary expenditures, result in cost saving to the DOTs. Therefore, research that result in quality bridge data can enhance bridge management.
2. LIDAR BRIDGE INSPECTION PROCESS 2.1 Brief of LiDAR Based Bridge Inspection
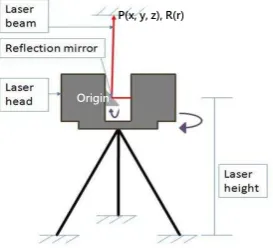
Terrestrial LiDAR scanning data point contains fundamental information about the scanned target including: row and column number, position data, Cartesian coordinates, and reflectance value. Assuming a scanned data set has n points, the set can be described as: measures the relative position of the scanned points to the scanner. R is the reflectivity value where ‘darker’ scan points are usually associated with lower reflectance values, while ‘brighter’ scan points are associated with higher values. The integration of all these scan points generates the 3D image of the recorded bridge structure as shown in Figure 2. The evaluation of these fundamental data forms the basis for bridge inspection technique using LiDAR technology (Liu, 2010).
Origin
P(x, y, z), R(r)
Figure 2. The LiDAR scanning and data point representation
Visual inspection and LiDAR bridge inspection both fall into the
‘field bridge inspection’ and the ‘data processing’ processes as
defined in the DOT’s bridge inspection workflow. Visual
inspection emphasis on field survey and measurements (aided by mainstream Non-destructive testing techniques) with most data processing performed on site. Likewise, LiDAR based inspection performs onsite data recording, while its data processing primarily incurs in the lab. Therefore, if data quality control framework is planned in the future, it should consider both the field and off site operation procedures.
2.2 Bridge Field Data Collection using LiDAR
The bridge inspection team will travel to the site with the laser scanner, and follow the recommended visual inspection procedures to evaluate the bridge conditions. After inspecting the bridge visually, the team will determine the necessary parts and determine the appropriate positions to perform the scan.
Figure 3. 3D reconstruction of LiDAR scanning data of a highway bridge
The benefit of using a laser scan is documentation of the damage, which can be quantified using the laser data. Figure 3 is the screenshot of 3D reconstruction of a highway bridge in Iowa. For clearance measurement, it is suggested to place the LiDAR scanner between the bridge deck and road surface as showed in this figure. However, for damage detection, it is better to place the LiDAR scanner in front to the damage spot to mitigate the impact by the above listed error sources.
2.3 Post Scan Data Analysis (Damage Detection)
In post scan data analysis, the bridge condition evaluation team will use computer programs to detect and quantify defective parts, measure bridge clearance and structure deformation, which is completed through determining the changes on the 3D point cloud data of the bridge.
The most idea method to perform change detection from LiDAR bridge scanning data (point cloud data) is to compare it to a existing reference, which could either be an original achieved scanning data collected when the bridge was newly built, or a virtual 3D spatial data stored in the architecture design firm or the government agency. Then the point cloud data of defective bridge parts can be compared to the reference data. However, most of bridges don’t have the scanned or design data, the reconstruction of virtual 3D bridge model is the only way to perform change detection in this study.
3. ERROR SOURCES 3.1 Errors in Field Data Collection
The scanning angular, range, edge effects, and surface reflectivity issues are all factors that could affect the scanning data quality. In most of the site deployment, laser scanner may encounter limited access points, thus these factors should be considered when performing the scan. Scanning angle variance can significantly influence the outcomes of defect quantification among all of them.
surface types (have different reflectance rates of laser light). The flat panel has been scanned at five different positions using LiDAR scanner, and the experiment setup is shown in Figure 4, where the centre of the panel board is regarded as the origin of the space, and the unit used is meter.
(-0.662, 0.581, 0.610)
Figure 4. Experiment setup of the scanning angle effect study
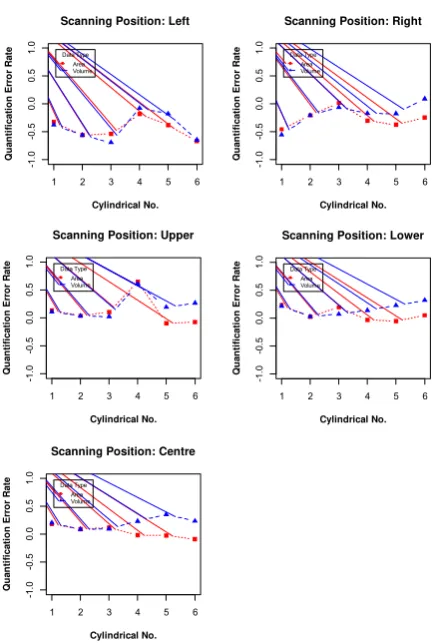
In this experiment, the LiDAR data is analysed using Liu’s (2010) quantification algorithm. Figure 5 is the quantification result of the area and volume cylindrical samples scanned from the 5
Figure 5. Comparisons of defect quantification error rate due to scanning angle variance
Liu (2010) has made a brief analysis of the reason of scanning angle influence. The primary factor is the scans cannot be
conducted exactly facing the ‘damage’, as a result, it is difficult
to get a clear edge recording, for most laser lights touch the damage edge from that direction is scattering rather than returning back to the scanner. Therefore, the scanning data
cannot get sufficient scan points to reconstruct the edge correctly. The secondary factor is the laser light from side scans could be blocked by the damage edge surface and cannot reach the inner surface of the defect, thus the oblique scan is not able to capture the entire features of the damage.
Figure 6 demonstrate the 3D reconstruction of the quantification
results for position 5 (the ‘lower’ scan). From the experiment, we
can see that the scanning angle effect could bring a considerable error to the quantification results.
C1 C2 C3
C4 C5 C6
Figure 6. 3D reconstruction of analysis result for the lower center scanning
3.2 Errors in Post Scan Data Analysis
The quantification algorithms can also lead to errors in the inspection process. In the post scan data analysis, the bridge condition evaluation team will use computer programs to detect and quantity defective areas, measure bridge clearance and structure deformation, which is completed through determining the changes on the 3D point cloud data of the bridge.
As discussed section 2.3, the reconstruction of the surface shape for the defective parts of a bridge is a challenging problem for the lack of documented or design data. The most feasible method in the reconstruction is to define a reference plane as the original undamaged surface for the selected point cloud, which is used to determine whether there are defective areas in the point cloud. It is worthwhile to note that this method is under the premise of prejudgement of the defect parts conditions by the inspectors.
Liu (2010) introduced a way to reconstruct the shape of the defective parts by generating a flat plane according to the boundary information of selected study point cloud data, which is an estimation of the original bridge shape. Three points from the surface of the undamaged areas are selected to determine this reference plane for later defect quantification. In order to avoid introducing noise data the noise point when selecting those determinate points, it is necessary to compare the coordinate values with the neighbouring points.
Liu’s algorithm is simple and effective, especially when the
defective bridge component was laying on a flat surface. But
when the damage is located on a curved surface, Liu’s method is
unable to reshape the point cloud data and make it close to the original condition. This algorithm is also semi-automatic and requires human interactions to select the study areas.
for a given point cloud data. This algorithm requires the selection of as much undamaged area as possible to make the reference plane more close to the original surface. Moreover, the two algorithms also have different ways in determining the area and volume.
Bridge **0147 has been selected to evaluate the effectiveness of this inspection technology. The substructure of the bridge is showing distress in the pile caps in three areas under bridge girder. The LiDAR scan was conducted underneath the bridge, the investigated to test the revised quantification algorithm. The damage detection and quantification algorithms can outline the defective points in the spatial domain. The defective areas are
Figure 8. 3D reconstruction of damage detection result in bridge **0147
Figure 9 shows the result of the damage quantification using both
Liu’s and secondary algorithms. The case study indicated that the
two algorithms are very close in the quantitative results for area in bridge surface damage detection, which are highly relying on the selection of reference plane as well as the damage criteria. The obvious variances of the results in volume quantification are believed to come from the difference of reference plane generation and the change of volume quantification algorithm using Delaunay’s Triangulation (Shewchuk, 1999).
0
Figure 9. Comparison of two different data processing algorithms
3.3 Errors from the Environment
The most common external errors sources when processing LiDAR scan in bridge inspection are introduced from the environment. For instance, the change of temperature, the dust in the atmosphere, and the lighting conditions could result in errors into the scanning data.
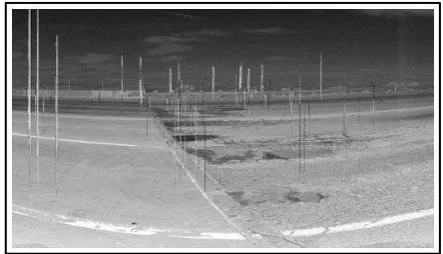
Passing traffic effect is one of the issues when scanning a bridge under heavy traffic, and the vehicles allow scatters of lines in the scan, which creates trouble in the data analysis by distorting the scanned image or generate noise points in the scanning data, and this issue could lead to unacceptable errors in both damage detection and clearance measurement. Figure 10 shows vertical lines within as scan resulted from heavy traffic crossings.
Figure 10. Passing traffic leaves noise in the LiDAR scan
4. SUMMARY
In this study, the terrestrial LiDAR based bridge inspection has been studied. The primary error sources are assessed through designed experiments, and the purpose of the analysis is to understand the issues that affect bridge inspection data quality in both field bridge inspection and computer assisted data processing (automation) for LiDAR bridge inspection. With the case study presented, LiDAR technology is validated as a potential solution for bridge inspection, and the scanning angle variance and damage evaluation algorithms are found to be the primary error sources. Methods or even systematic quality control framework will be addressed and suggestions to mitigate the errors in further study.
ACKNOWLEDGEMENTS
Research and Innovative Technology Administration (RITA). The views, opinions, findings and conclusions reflected in this publication are the responsibility of the authors only and do not represent the official policy or position of the USDOT, RITA, or any State or other entity.
REFERENCES
Brinckerhoff, P., 1993. Bridge inspection and rehabilitation: a practical guide. Wiley(Chapter 1), pp. 1-11.
Dietrich, J. I., Inkala, M. A., & Männistö, V. J., 2005. Bridge inspection and evaluation: bridge inspection quality management. Transportation Research Record: Journal of the Transportation Research Board, 1933,pp. 1-8.
FHWA, 2005. National Bridge Inspection Standards. Federal Register, 69(239).
Liu, W., 2010. Terrestrial LiDAR-Based Bridge Evaluation. PhD Dissertation. UNC Charlotte.
Moore, M., Phares, B., Graybeal, B., Rolander, D., & Washer, G., 2001. Reliability of visual inspection for highway bridges, Volume 1: Final Report. Federal Highway Administration, FHWA-RD-01-020, 516.
Orcesi, A. D., & Frangopol, D. M., 2010. Optimization of bridge management under budget constraints. Transportation Research Record, 2202(2010), pp. 148-158.