AUTOMATIC EXTRACTION OF BUILDING ROOF PLANES FROM AIRBORNE
LIDAR DATA APPLYING AN EXTENDED 3D RANDOMIZED HOUGH TRANSFORM
Evangelos Maltezos*, Charalabos Ioannidis
Laboratory of Photogrammetry, School of Rural and Surveying Engineering, National Technical University of Athens, Greece, Ε-mail: [email protected]; [email protected]
Commission III, WG III/2
KEY WORDS: LIDAR, Point cloud, Scan line, Filtering, Building, Hough transform, Plane detection
ABSTRACT:
This study aims to extract automatically building roof planes from airborne LIDAR data applying an extended 3D Randomized Hough Transform (RHT). The proposed methodology consists of three main steps, namely detection of building points, plane detection and refinement. For the detection of the building points, the vegetative areas are first segmented from the scene content and the bare earth is extracted afterwards. The automatic plane detection of each building is performed applying extensions of the RHT associated with additional constraint criteria during the random selection of the 3 points aiming at the optimum adaptation to the building rooftops as well as using a simple design of the accumulator that efficiently detects the prominent planes. The refinement of the plane detection is conducted based on the relationship between neighbouring planes, the locality of the point and the use of additional information. An indicative experimental comparison to verify the advantages of the extended RHT compared to the 3D Standard Hough Transform (SHT) is implemented as well as the sensitivity of the proposed extensions and accumulator design is examined in the view of quality and computational time compared to the default RHT. Further, a comparison between the extended RHT and the RANSAC is carried out. The plane detection results illustrate the potential of the proposed extended RHT in terms of robustness and efficiency for several applications.
* Corresponding author
1. INTRODUCTION
The automatic plane detection from a 3D point cloud is a research topic of high interest as it is very useful for applications such as 3D modelling, cadastre, etc. The quality of the plane detection results using LIDAR point clouds is significantly depended by noise, position accuracy, local under-sampling, very large amount of data (having impact on the computational time), low point density, etc. These point cloud characteristics in combination with the challenge of the automatic tuning of the parameters of each algorithm to be used as well as with the automatic selection of the primitive type, the size of the smallest foreseeable plane surface and the fitting tolerance create the need for the development of automatic, efficient and rapid algorithms. In the literature, two types of approaches called bottom-up data driven (also known as generic of polyhedral) and top-down model driven (also known as parametric) are proposed for the building roof reconstruction. However, a combined approach called structural or hybrid that exhibits model and data driven characteristics is applied (Satari et al., 2012; Awrangjeb and Fraser, 2013). The model driven approaches (Oude Elberink and Vosselman, 2009), search the most appropriate model among primitive building models using a predefined catalogue of roof forms. In the context of data driven approaches, a common assumption is that the building roof is a polyhedron that is reconstructed from planar patches derived from plane detection techniques. The mostly used plane detection techniques from 3D point clouds are region growing, RANSAC and Hough methods. Vosselman et al. (2004) and Sun and Salvaggio (2013) proposed region growing for the segmentation of LIDAR point clouds. Furthermore, interesting
and efficient studies have been implemented that segment building roofs (Lafarge et al., 2010; Sampath and Shan, 2010; Kada and Wichmann, 2012; Awrangjeb and Fraser, 2013; Verdie et al., 2015) and man-made scenes (Lafarge and Alliez, 2013; Monszpart et al., 2015). Also, sophisticated techniques have been applied that accurately assign every LIDAR point to its best plane in one global optimization eliminating simultaneously the use of many thresholds (Wang et al., 2012; Lin et al., 2013; Pham et al., 2014; Yan et al., 2014; Golbert et al., 2014). The main advantage of the aforementioned techniques is that they can effectively be applied at city blocks or varying areas unlike to the Hough and RANSAC methods. On the other hand, RANSAC has been effectively applied for the automatic plane detection from a 3D point cloud, especially its efficient variations (Schnabel et al., 2007; Tarsha-Kurdi et al., 2008). A detailed review of the 3D Hough methods applied in a terrestrial interior environment can be found in Borrmann et al. (2011). In the context of the accuracy vs. computational time tradeoff, Randomized Hough Transform (RHT) seems to achieve outstanding performances compared with the other 3D Hough methods, like the mostly applied Standard Hough Transform (SHT). Although SHT has been effectively applied (Huang and Sester, 2011), it suffers from its large computational time (Tarsha-Kurdi et al., 2007). Further evidence that RHT yields notably satisfactory results for terrestrial implementations can be found in Kotthäuser and Mertsching (2012) and Dumitru et al., (2013). Also, interesting studies have been implemented using a combination of the aforementioned plane detection techniques (Oehler et al., 2011; Vosselman, 2013).
In this paper, an extended RHT is applied for the automatic extraction of building roof planes from airborne LIDAR data. Since aerial cases contain often buildings with complex architectural complexity, techniques that aim to the optimum adaptation of the building roofs as well as to the accurate, reliable and rapid detection of the prominent planes are required. In this context, additional constraint criteria during the random selection of the 3 points associated with the angle between the normal vectors and the height difference as well as a simple design of the accumulator that eliminates noisy planes are proposed. To overcome the over-segmentation problem and to eliminate spurious planes, a refinement process is proposed based on the relationship between neighbouring planes, the locality of the point and the use of additional information such as intensity.
As test site an urban area named Kalochori in northern Greece, close to the city of Thessaloniki, is used. The application area has a complex building structure with sloping roofs, chimneys, small extensions of larger buildings, solar water heaters, solar energy panels, etc (Figure 2 bottom left). The type of the vegetation is characterized as moderate. However, long arrays or groups of dense trees between the buildings, high vegetation beside the boundary of buildings as well as buildings surrounded or occluded by high trees exist. A LIDAR point cloud covering the area with a density of 9 pts/m2 is used.
2. METHODOLOGY
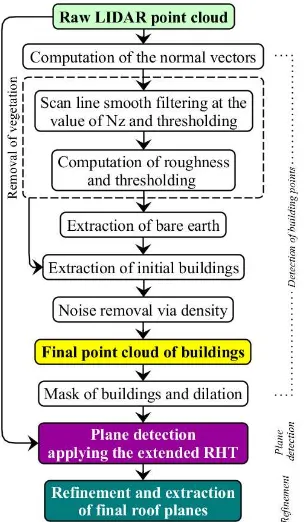
Figure 1 illustrates the flow chart of the proposed methodology based on three main steps.
Figure 1. Workflow of the proposed methodology.
Firstly, the detection of the building points from the LIDAR point cloud is carried out (Maltezos and Ioannidis, 2015). Then, the plane detection on each building is individually performed applying the extended RHT. A refinement process is conducted to optimize the extracted building roof planes. The results, either of the building detection or of the plane detection, are
qualitatively and quantitatively evaluated using an existing orthoimage as reference applying the method of Rutzinger et al. (2009). The implementation of the proposed methodology is made using the MATLAB computing environment. A desktop computer (CPU with 2.27 GHz and 4G Memory) is used to process the test data set.
2.1 Detection of building points
A scan line smooth filtering technique at the values of the z-coordinate of the normal vector (Nz) is used to segment vegetative areas from the scene content. Surfaces that are perpendicular to the vertical direction present normal value of Nz equal (or very close) to the value 1 (e.g., building rooftops). On the contrary, vegetation presents in majority disorderly dispersion of the value Nz presenting significantly different value from the value 1. However, incorrect entries may be observed at complex sloping roofs, chimneys, solar water heaters, etc, as well as in vegetation of level canopies; for example, dense arrays of trees or foliages. Hence, a filtering technique is quite capable to enhance the correct entries and to absorb simultaneously the incorrect entries. Figure 2 top right and top left show the effect of the scan line smooth filtering of the Nz values compared to the initial Nz values respectively visualized at the open-source software CloudCompare (http://www.danielgm.net/cc/).
Figure 2. The LIDAR point cloud coloured by the initial Nz values (top left); the filtered Nz values by the scan line smooth filtering technique (top right); the orthoimage of the area of interest (bottom left) and the evaluation of the building detection results (bottom right).
In this study, a small neighbourhood (3 points) during the scan line smooth filtering was selected to avoid an excessive filtering which may cause deformations to the boundaries of the buildings. Then, a thresholding process is carried out removing the points that represent the vegetation whose Nz values were lower than 0.85. The threshold value 0.85 corresponds to the maximum allowable value of a roof slope according to the Greek Urban Planning authority for typical cases of buildings. In a second phase, the roughness is calculated on the thresholded point cloud in order to eliminate cases of possible remaining vegetation. Since this study aims to detect even small extensions (of up to 5 m2) on large buildings, strict criteria such as the use of a search area with a radius of 1 m for the calculation of roughness as well as the removal of points whose roughness values are higher than 0.10 m are used. Since the urban scenes rarely present intense topographic ground surface, a morphological operator is suitable for the extraction of the bare earth of the cleared from vegetation point cloud. Hence, the deepest point inside a window of a certain size which is moved along the scan line is selected to obtain a sparse point
cloud of the bare earth. Τhe size of the window was selected equal to 40 m associated with the size of the maximum building. Next, a densification process via meshing and resampling (with the same point density of the raw LIDAR point cloud) at the sparse point cloud is carried out to obtain an integrated and comprehensive point cloud of the bare earth. Then, the point cloud of the initial buildings using a closest point technique with a distance threshold of 1.5 m is extracted. Finally, possible remaining isolated points or tiny blobs of points with small number of neighbours (less than 20) are removed using a search area with a radius of 2 m.
Figure 2 (bottom right) shows the evaluation of the building detection results.The achieved success rates of completeness, correctness and quality were 93%, 91% and 85% respectively. The omission error mostly comes from the powerful filtering of the scan line smooth filtering technique. Thus, although the vegetation was almost completely removed, local complex cases of small extensions or small additions of major buildings were incorrectly, also, removed increasing the false-negatives (FN). The false-positives (FP) that were observed are associated with remaining cases of dense and high trees as well as with cars and fences. To absorb possible distortions of the boundaries of the extracted point cloud of buildings or point gaps due to the thresholding process, the mask of the final point cloud of the buildings is dilated and is used to clip the raw LIDAR point cloud. The dilation threshold was selected as 2.5 m empirically. Then, each building is manually isolated and cleaned from vegetation that possibly exists beside the boundary of buildings as well as from bare earth surface.
2.2 Plane detection using the Randomized Hough Transform
The principle of the SHT is the representation of a 3D point set at the parametric Hough space (O’θφρ). In this case, one point can be presented as a point in the parametric Hough space. The intersection of 3 sinusoidal surfaces in the parametric Hough concentration regions of points in the parametric Hough space. These prominent planes are associated with the common plane that the corresponding points of the 3D point set in the (O x y z) space belong to. Theoretically, coplanar points in the (O x y z) space should share one point in the parametric Hough space. However, in practice, this is not valid ideally due to the vertical positional error of the LIDAR data. For this reason, the common plane has to be searched at the regions with the highest degree of concentration of points as the more points (intersections of the sinusoidal surfaces) in the parametric Hough space, the more points of the 3D point set in the
(O x y z) space lie on this detected plane. A discretized data structure called accumulator is needed to store all the points that occur in the parametric Hough space. The cells that include more points over a predefined threshold represent the most prominent planes that cover the majority of the points of the 3D point set in the (O x y z) space.
RHT is one of the most effective Hough methods for detecting planes, however, differs significantly from STH, while both transform the 3D point set in the (O x y z) space into the parametric Hough space and detect planes by counting the number of points that lie on one plane represented as one cell in the accumulator. In the beginning, the default RHT, randomly picks 3 points, p1, p2 and p3, from the 3D point set that fulfill a 3D Euclidean distance constraint criterion (D_cns) between them. The parameters θ, φ and ρ of the plane that the 3 points define are calculated and they stored at the accumulator increasing the corresponding cell. If the number of points in a cell at the accumulator is greater than a predefined threshold, a prominent plane is detected. Then, the points of the 3D point set that are close to the detected plane are removed using a predefined tolerance threshold (S_thr). Thereafter, the accumulator is reset. The above procedure continues for a predefined number of iterations (M_iter) until no points (or few points using a predefined stopping rule (Stop_rule)) at the 3D point set will remain. SHT uses a pure mathematical principle in order to detect the most prominent planes from the 3D point set without taking account their signification in the building point cloud or using the least square theory (Tarsha-Kurdi et al. 2007). Borrmann et al. (2011) highlighted the advantages of the RHT in comparison with SHT. Using RHT not only there is no need to process the total number of the points of the 3D point set but also for those points it is not necessary the calculation of the complete Hough transform. Thus, the prominent plane is reliably searched in the accumulator which consists of few points. Also, once the prominent plane detected, all points of the 3D point set lying on that plane are removed. These principles have a dual effect as the algorithm is speeded up (decreasing the number of points whenever a prominent plane is detected) and also the accuracy as well as the reliability for the next prominent plane are increased.
In this study, two additional constraint criteria as well as an efficient and simple design of the accumulator are proposed and described at the following sections. The predefined tolerance S_thr was selected as 40 cm or 2*sigma, where sigma is the vertical positional error of the LIDAR data, which is equal to 20 cm in this data set. The number of iterations and the stopping rule were selected as M_iter = 1,000,000 and Stop_rule = 10 respectively.
2.2.1 Constraint criteria: Although the randomize selection of the 3 points using only the D_cns is suitable for terrestrial applications, it seems that in aerial cases containing complex building structures is inadequate. Additional critical constraint criteria during the random selection of the 3 points in each iteration are required for the optimum adaptation to the building roofs and therefore for the accurate, reliable and rapid detection of the prominent planes.
In this study, two additional constraint criteria associated with the angle γ between the normal vectors (Angle_cns) and with the height difference (HD_cns) are proposed. The Angle_cns ensures the selection of 3 points that they share the same orientation of normal vectors while the HD_cns is particular useful and effective at cases of horizontal multiple planes with
small height differences. Since the computation of the normal vectors becomes unstable when a small neighborhood is defined or noise points exist, the value of the Angle_cns should be such that to absorb the selection of noisy normal vectors. The use of Angle_cns and HD_cns enables the selection of a relatively large value of the D_cns. This means that the search of the prominent plane is facilitated giving priority to the points of larger surfaces decreasing the computational time. Hence, the combination of the three constraint criteria relieves greatly the accumulator from unnecessary planes associated with the selection of the 3 points in cases of: (a) horizontal planes with small height differences, (b) structures (e.g., chimneys, solar water heaters, etc) and the major plane that are lying on it and (c) near the building ridge. In this study, the first two constraint criteria selected as D_cns = 7 m and Angle_cns = 15o. For the
2.2.2 Accumulator: A detailed description and analysis of various designs of the accumulator is described by Borrmann et al. (2011). In our study, a simple design of the accumulator that efficiently detects the prominent plane is proposed. The accumulator is essentially a table of values that consists of three columns θ, φ and ρ containing the candidate prominent planes. Each plane occupies a row at the accumulator with its polar coordinates θ, φ and ρ. In each iteration three main steps are applied:
1) The density of each point at the accumulator is examined using a spherical neighborhood with a predefined radius (r_sphere). If a group of points larger or equal to a predefined threshold (Np_density), presents larger or equal value to a predefined threshold of density (Density_thr) the permission to access to the accumulator is given by the algorithm for the search of the prominent plane. Points that fulfill the Density_thr proceed to the next step.
2) A statistical analysis is performed to discard the remaining noisy planes considering the assumption that the values of each column of θ, φ and ρ follow the normal (Gaussian) distribution. For each column of θ, φ and ρ the residuals (U) and the standard deviation (σ) are calculated. The selected values that proceed to the next step are the values that fulfill the condition U < |σ·zp|, where zp is the corresponding parameter of the defined confidence interval.
3) The prominent plane is detected selecting the median of each column of θ, φ and ρ in order to absorb possibly remaining values with partial local dispersion.
The gradually filtering of the noisy planes using the density, the statistical analysis and the median value (instead of using the mean value) enables the reliable and rapid detection of the prominent plane. The parameters of the accumulator associated with the best results were selected as r_sphere = 2, Np_density = 3, Density_thr = 4 and zp = 1, which corresponds to a strict confidence interval of 68.27%. For cases of buildings that consist of purely by horizontal planes, a less strict tuning with Np_density = 1 and Density_thr = 2 was implemented in order to decrease the computational time while preserving accuracy. As previously proposed, the automatic tuning of the Np_density
and Density_thr may be performed considering the normal variation on the Gaussian sphere.
2.2.3 Experimental comparison between the extended RHT and SHT: A selected building roof plane of the LIDAR point cloud that consists of 336 points (red polygon in Figure 3a) is used to confirm and highlight the comparative advantage of the proposed extended RHT to the SHT concerning the computational time for the detection of the prominent plane.
Figure 3. Experimental comparison between the extended RHT and SHT
Figure 3b depicts the sinusoidal surface of 1 point from the selected building roof plane using the Equation (1) with angle step of θ_step = 1o and φ_step = 1o for the case of the SHT, where θϵ [0o, 180o] and φϵ [0o, 180o]. The cyan circle in Figure 3c depicts the intersection of 3 sinusoidal surfaces using θ_step = 1o and φ_step = 1o for the case of the SHT. The dashed ellipse in magenta in Figure 3d shows the region with the highest degree of concentration of points for the case of the SHT associated with the prominent plane of the intersection of 336 sinusoidal surfaces coloured by the density in grayscale. 3f depicts the candidate planes of the RHT superimposed at the intersection of the 336 sinusoidal surfaces of the SHT. The computational time for the detection of the prominent plane of the 336 sinusoidal surfaces of the SHT was 91.2 sec (i.e. 150.1 sec overall) while the overall computational time of the RHT ISPRS Annals of the Photogrammetry, Remote Sensing and Spatial Information Sciences, Volume III-3, 2016
was 0.52 sec. It is obvious that the computational complexity of the SHT which in general is Ο(|P| · Nθ· Nφ), where Nθ is the number of cells in direction of θ and Nφ in direction of φ, may has significant impact at the computational time. The operations for the 336 points from the selected building roof plane were decreasing the processing time and the needed memory but this would had impact at the quality of the detected prominent plane.
2.3 Refinement of the plane detection
A refinement process is conducted to improve the quality of the planes of each building extracted by RHT based on the relationship between of the neighbor planes and the locality of the point as well as using additional information such as intensity. The refinement process consists of four steps which were applied in the following order:
1) Removal of LIDAR points associated with solar energy panels whose intensity value is lower than 35.
2) Elimination of spatially separated points. To achieve this, the density of each point of each detected plane is examined using a search area with a radius of 1 m. The density threshold was selected equal to 5 neighbours. In this context, spurious planes caused by remaining points may be removed.
3) Assignment of the points to a better plane in order to overcome the over-segmentation problem. Initially, the optimization of each detected plane by RHT is performed by fitting a new plane to the corresponding points. Then, similar to Demir and Baltsavias (2012), the 3D Euclidean distance between each point and to all optimized planes is calculated. The absolute difference between DA and DB is surface was set equal to 4 points.
3. QUALITY ASSESSMENT AND RESULTS
For comparison reasons, the RANSAC method (Schnabel et al., 2007) was applied in order to extract the building roof planes of the same data set considering the same assumptions, such as the max deviation of the angle γ, tolerance, etc. In order to assess the performance of each method, the inaccurate planes are classified similar to Yan et al. (2012) into the categories of non-segmented, under-non-segmented, over-segmented and spurious.
The non-segmented and under-segmented planes are assigned as FN entries associated mainly with planes which never Typical cases of non-segmented planes are these of small planar surfaces which are partly described due to the available density of the LIDAR point cloud (and so the random selection process of the 3 points fails) and cases of remaining corrupted planar surfaces (due to incorrect detection of neighbor planes) whose detection is difficult because of its deformed morphology. The under-segmented planes may occur either between neighbor planar surfaces (due to the use of an excessive tolerance) or between spatially isolated planar surfaces (cases of buildings with complex structure including multiple coplanar surfaces). The over-segmented planes are mainly caused by unstable detected planes as well as by using unsuitable (either larger or smaller than the appropriate value) tolerance. The spurious planes are false planar surfaces caused by remaining points of planar surfaces. Since algorithms such as RHT, RANSAC, etc, tend to detect first larger planar surfaces, few remaining points possibly as noise are segmented into spurious planes.
The sensitivity of the use of the constraint criteria as well as the elements (statistical analysis and use of the median value) of the proposed accumulator concerning the accuracy and the computational time is examined. Two representative kinds of buildings are used; one with several horizontal planes that have small height difference between each other consists of 1,735 points (named Building 1) and one with multiple sloped surfaces consists of 1,351 points (named Building 2). Variations of the RHT using different combination of parameters as well as RANSAC were applied at Buildings 1 and 2.
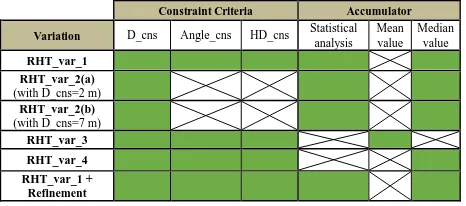
The selected parameters (using the selected values that were discussed at the sections 2.2.1 and 2.2.2) of each variation of the RHT are depicted to the Table 1 coloured in green. RHT_var_1 is the proposed extended RHT and the RHT_var_1+Refinement is its refined version. RHT_var_2(a) and RHT_var_2(b) represent the default RHT that uses only the D_cns. RHT_var_3 and RHT_var_4 represent variations of the RHT_var_1.
Constraint Criteria Accumulator
Variation D_cns Angle_cns HD_cns Statistical
analysis
Table 1. The applied variations of the RHT.
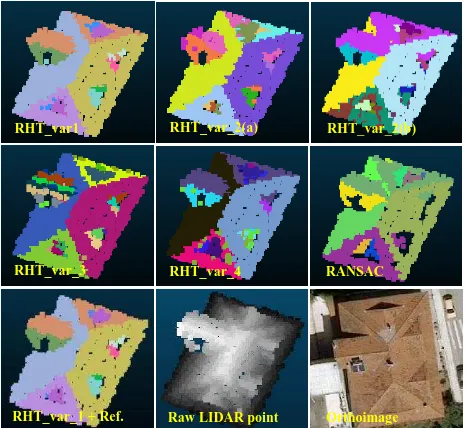
Figures 4 and 5 depict the plane detection results of each variation of the RHT and RANSAC as well as the corresponding raw point cloud (coloured by the point height in grayscale) for Buildings 1 and 2 respectively. The corresponding computational time is illustrated in Figure 6.
Concerning Building 1, relative small differences between the computational time of the variations of the RHT were observed, except the RHT_var_2(b) due to the selected D_cns. However, the performance of each variation differs significantly. Many over-segment and spurious planes were observed using the RHT_var_2(a) and RHT_var_2(b) due to the lack of the additional constraint criteria.
Figure 4. Plane detection of Building 1 using the variations of the RHT and RANSAC.
Figure 5. Plane detection of Building 2 using the variations of the RHT and RANSAC.
Figure 6. The computational time of each variation of the RHT and RANSAC applied at Buildings 1 and 2.
The absence of the statistical analysis as well as the use of the mean value at the RHT_var_3 caused a relative instability to the accumulator allowing noisy planes to vote for the detection of
the prominent plane. Under-segment planes using the RHT_var_4 were observed due to the absence of the statistical analysis; however, the RHT_var_4 yielded clearly better results compared to the RHT_var_2(a) and RHT_var_2(b). The substantial contribution of the additional criteria as well as of the statistical analysis and the use of the median value is demonstrated comparing the RHT_var_1 with the RHT_var_2(a) and RHT_var_2(b). Also, the results were improved using the refinement process at the RHT_var_1 (without burdening particularly the computational time) absorbing detected over-segmented and spurious planes. Finally, although the computational time of RANSAC is very short, considerable distortions at the boundaries of each plane as well as over-segmented and spurious planes were observed.
Concerning Building 2, the computational time between the variations of the RHT vary significantly highlighting more than in the case of Building 1 the utility of the proposed interventions at the RHT. Although Building 2 consists of fewer points than Building 1, the computational time was longer due to the complex building structure. The implementation of the RHT_var_2(a) and RHT_var_2(b) not only increases processing time but also the results are not satisfactory. Concerning the implementation of the RHT_var_3 and RHT_var_4, the use of the mean value and the absence of the statistical analysis had significant effect to the results as over-segmented and spurious planes were observed. Similarly with the case of Building 1, although the processing time of RANSAC is very short, non-segmented and spurious planes were observed. The use of the additional constraint criteria of the RHT_var_1 does not diminish but rather improves the quality of the results and decreases the computational time, approaching to the corresponding computational time of the simplest case of Building 1 (either using the RHT or the refined RHT). However, under-segmented planes and local distortions at the boundaries of small planes occurred, which is challenge for further improvement of the refinement process.
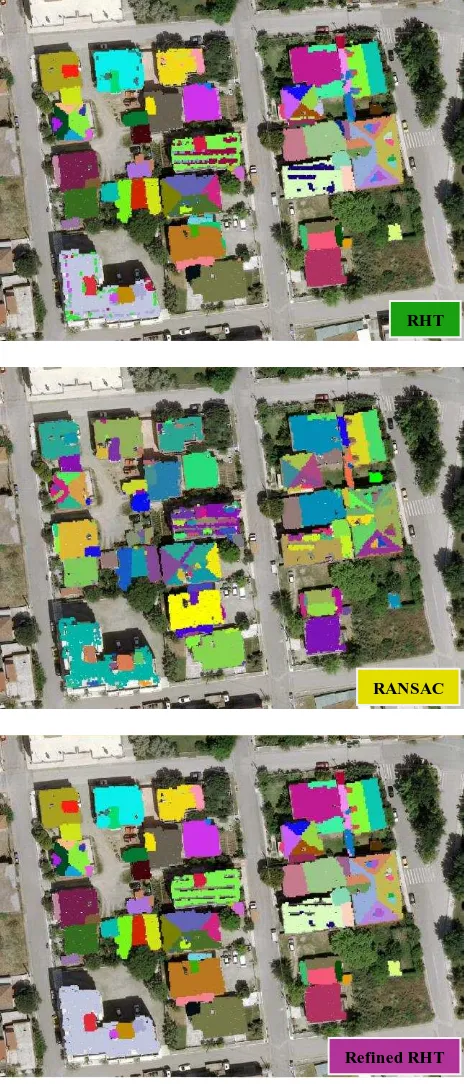
Figure 7 depicts the plane detection results of the overall buildings superimposed on the orthoimage of the area of interest applying the RHT, RANSAC and refined RHT. The quality assessment results as well as the corresponding success rates of completeness, correctness and quality are depicted in Figure 8 and Table 2 respectively. Although RANSAC detected slightly more correct planes compared to RHT, many over-segmented and spurious planes were detected decreasing significant its rate of correctness (lower than 40%). The unstable detection of the prominent planes may increases the over-segmented planes but also may increases the spurious planes as remaining points of the planar surfaces may occur. However, slightly less FN entries compared to RHT were observed and so a rate of completeness equal to 76% was achieved. RHT exhibited more balanced results compared to RANSAC achieving rates of completeness and correctness equal to 70% and 60% respectively.
The proposed additional constraint criteria as well as the filtering of the noisy planes at the accumulator via the statistical analysis and the use of the median value contributed to the adaptation on each building rooftop and therefore to the efficient detection of the prominent planes. However, RANSAC detected less under-segmented planes as embodies a connected component labeling process segmenting properly cases of coplanar surfaces, etc. The observed non-segmented planes were associated mainly with small planar surfaces, which are
RHT_var_1 RHT_var_2(a) RHT_var_2(b)
RHT_var_4 RANSAC
RHT_var_1 + Ref. Raw LIDAR point cloud
RHT_var_3
Orthoimage
RHT_var1 RHT_var_2(a) RHT_var_2(b)
RHT_var_4 RANSAC
RHT_var_1 + Ref. Raw LIDAR point cloud
RHT_var_3
Orthoimage
insufficiently described due to the available density of the LIDAR point cloud.
Figure 7. Plane detection results.
Method Completeness Correctness Quality
RHT 70% 60% 48%
RANSAC 76% 38% 34%
Refined RHT 81% 84% 70%
Table 2. Evaluation of the automatic extraction of the building roof planes.
Figure 8. Quality assessment results.
The refinement process improved greatly the rates of completeness and correctness of the RHT with values equal to 81% and 84% respectively. This means that the assignment of the points to a better plane was successfully executed as well as the spurious planes were absorbed. The under-segmented planes slightly improved. A region growing technique and a connectivity criterion may overcome the under-segmentation problem, improving the corresponding success rates. The implementation of the refinement process at the RANSAC plane detection results could also improve the corresponding success rates.
4. CONCLUSIONS
This study aims to extract automatically building roof planes from airborne LIDAR data applying an extended RHT. The proposed additional constraint criteria during the random selection of the 3 points as well as the gradually filtering of the noisy planes from the accumulator contribute not only to the optimum adaptation to the building rooftops but also to the reliable and rapid detection of the prominent planes. The comparison to SHT, default RHT and RANSAC shows that the extended RHT satisfies greatly the accuracy vs. computational time tradeoff. The refinement process improved significantly the rates of completeness and correctness (larger than 80%) showing promising results which can be used for several applications, such as 3D city modelling in terms of Level of Detail 1 (LoD 1) and 2 (LoD 2).
ACKNOWLEDGEMENTS
The authors would like to thank the Geosystems Hellas S.A. for its sponsorship of this work providing the orthoimage and the LIDAR data.
REFERENCES
Awrangjeb, M., Fraser, C.S., 2013. Rule-based segmentation of LIDAR point cloud for automatic extraction of building roof planes. In: City Models, Roads and Traffic, pp. 1-6.
Borrmann, D., Elseberg, J., Lingemann, K., Nüchter, A., 2011. The 3D Hough Transform for plane detection in point clouds: A review and a new accumulator design. 3D Research, Vol. 2(2), pp. 1-13.
Demir, N., Baltsavias, E., 2012. Automated modeling of 3d building roofs using image and Lidar data. In: ISPRS Annals of the Photogrammetry, Remote Sensing and Spatial Information Sciences, Melbourne, Australia, Vol. I-4, pp. 35-40.
RHT
RANSAC
Refined RHT
Dumitru, R., C., Borrmann, D., Nüchter, A., 2013. Interior Reconstruction using the 3D Hough Transform. In:
International Archives of the Photogrammetry, Remote Sensing
and Spatial Information Sciences (IAPRSSIS), Trento, Italy,
Vol. XL-5/W1, pp. 65-72.
Golbert, A., Arnon, D., Sever, A., 2014. Piecewise Planar and Non-Planar Segmentation of Large Complex 3D Urban Models.
In: International Conference on 3D Vision, Tokyo, Japan, Vol.
1, pp. 99-106.
Huang, H., Sester, M., 2011. A hybrid approach to extraction and refinement of building footprints from airborne data. In: IAPRSSIS, Guilin, China, Vol. XXXVIII-4/W25, pp. 153-158.
Kada, M., Wichmann, A., 2012. Sub-surface growing and boundary generalization for 3D building reconstruction. In: ISPRS Annals of the Photogrammetry, Remote Sensing and Spatial Information Sciences, Melbourne, Australia, Vol. I-3, pp. 233-238.
Kotthäuser, T., Mertsching, B., 2012. Triangulation-Based Plane Extraction for 3D Point Clouds. In: International Conference on Intelligent Robotics and Applications (ICIRA, 2012), Montreal, Canada, pp. 217-228.
Lafarge, F., Alliez, P., 2013. Surface reconstruction through point set structuring. In: Eurographics 2013, Vol. 32(2), pp. 225-234.
Lafarge, F., Descombes, X., Zerubia, J., Pierrot-Deseilligny, M., 2010. Structural approach for building reconstruction from a single DSM. In: IEEE Transactions on Pattern Analysis and Machine Intelligence, 32 (1), pp.135-147.
Lin, H., Gao, J., Zhou, Y., Lu, G., Ye, M., Zhang, C., Liu, L., Yang, R., 2013. Semantic decomposition and reconstruction of residential scenes from LiDAR data. In: ACM Transactions on Graphics, 32 (4), pp. 66:1-66:10.
Maltezos, E., Ioannidis, C., 2015. Automatic detection of building points from LIDAR and dense image matching point clouds. In: ISPRS Annals of the Photogrammetry, Remote Sensing and Spatial Information Sciences, La Grande Motte, France, Vol. II-3/W5, pp. 33-40.
Monszpart, A., Mellado, N., Brostow, G., J., Mitra, N., J., 2015.
RAPter: Rebuilding Man-made Scenes with Regular
Arrangements of Planes. In: ACM SIGGRAPH 2015.
Oehler, B., Stueckler, J., Welle, J., Schulz, D., Behnke, S., 2011. Efficient multi-resolution plane segmentation of 3D point clouds. In: International Conference on Intelligent Robotics and Applications (ICIRA, 2011), Aachen, Germany, pp. 145-156.
Oude Elberink, S., Vosselman, G., 2009. Building reconstruction by target based graph matching on incomplete laser data: Analysis and limitations. Sensors 9 (8), 6101-6118.
Pham, T., T., Chin,T., J., Yu, J., Suter, D., 2014. The Random Cluster Model for Robust Geometric Fitting. In: IEEE Transactions on Pattern Analysis and Machine Intelligence, 36 (8), pp.1658-1671.
Rutzinger, M., Rottensteiner, F., Pfeifer, N., 2009. A comparison of evaluation techniques for building extraction
from airborne laser scanning. IEEE Journal of Selected Topics
in Applied Earth Observations and Remote Sensing, 2(1), pp.
11-20.
Sampath, A., Shan, J., 2010. Segmentation and reconstruction of polyhedral building roofs from aerial LIDAR point clouds.
IEEE Transactions on Geoscience and Remote Sensing, 48(3),
pp. 1554-1567.
Satari, M., Samadzadegan, F., Azizi, A., Maas, H. G., 2012. A
multi-resolution hybrid approach for building model
reconstructionfrom LIDAR data. The Photogrammetric Record,
27(139), pp. 330-359.
Schnabel, R., Wahl, R., Klein, R., 2007. Efficient RANSAC for
Point-Cloud Shape Detection. Computer Graphics Forum,
26(2), pp. 214-226.
Sun, S., Salvaggio, C., 2013. Aerial 3D building detection and modeling from airborne LiDAR point clouds. IEEE Journal of Selected Topics in Applied Earth Observations and Remote Sensing, 6(3), pp. 1440-1449.
Tarsha-Kurdi, F., Landes, T., Grussenmeyer, P., 2007. Hough-transform and extended RANSAC algorithms for automatic detection of 3d building roof planes from Lidar data. In:
IAPRSSIS, Vol. XXXVI-3/W52, pp. 407-412.
Tarsha-Kurdi, F., Landes, T., Grussenmeyer, P., 2008. Extended RANSAC algorithm for automatic detection of building roof planes from LIDAR data. Photogrammetric Journal of Finland, 21(1), pp. 97-109.
Verdie, Y., Lafarge, F., Alliez, P., 2015. LOD Generation for Urban Scenes. In: ACM Transactions on Graphics, 34 (3), pp. 30:1-30:14.
Vosselman G., 2013. Point cloud segmentation for urban scene classification. In: IAPRSSIS, Antalya, Turkey, Vol. XL-7/W2, pp. 257-262.
Vosselman G., Gorte B., Sithole G., Rabbani T., 2004. Recognizing structure in laser scanner point clouds. In: IAPRSSIS, Vol. XXXXVI-8/W2, pp. 33-38.
Wang, H., Chin, T., J., Suter, D., 2012. Simultaneously Fitting and Segmenting Multiple-Structure Data with Outliers. In: IEEE Transactions on Pattern Analysis and Machine Intelligence, 34 (6), pp.1177-1192.
Yan, J., Jiang, W., Shan, J., 2012. Quality analysis on RANSAC-based roof facets extraction from airborne LIDAR data. In: IAPRSSIS, Melbourne, Australia, Vol. XXXIX-B3, pp. 367-372.
Yan, J., Shan, J., Jiang, W., 2014. A global optimization approach to roof segmentation from airborne lidar point clouds. ISPRS Journal of Photogrammetry and Remote Sensing, 94, 183-193.