Economics Letters 68 (2000) 109–112
www.elsevier.com / locate / econbase
Economic growth and geographic proximity
*
C.L.F. Attfield, Edmund S. Cannon, D. Demery, Nigel W. Duck
Department of Economics, University of Bristol, Alfred Marshall Building, 8 Woodland Road, Bristol, BS8 1TN, UK
Received 25 May 1999; accepted 16 December 1999
Abstract
Using data on 92 countries, 90 European regions, and 48 US states we present results suggesting that physical distance between economies has little role to play in explaining the spatial correlation of growth rates. 2000 Elsevier Science S.A. All rights reserved.
Keywords: Growth
JEL classification: O40; R11; F43
1. Introduction
One of the stylised facts of economic growth is that faster growing economies tend to be geographically clustered, e.g. in Europe or S.E. Asia. This might be because geographic proximity per se (i.e. the physical distance between economies) influences the extent to which economies’ growth rates are correlated. This would arise if, for example, transport costs are, or have been important, since such costs clearly depend upon distance. However, clustering of growth rates would also arise if factors which might affect growth, e.g. climate, political and legal traditions, and religious beliefs, were themselves spatially correlated.
In this paper we test whether it is geographic proximity per se which matters. We consider three data sets. First we use regional data from eight European countries from 1950 to 1990. Since regions from the same country tend to be relatively close together, we can test the proximity hypothesis by comparing the importance of distance versus the importance of national zero / one dummy variables, where the latter have a clear socio-economic interpretation. The other two data sets are observations
*Corresponding author. Tel.: 144-117-928-8406; fax: 144-117-928-8577. E-mail address: [email protected] (N.W. Duck)
110 C.L.F. Attfield et al. / Economics Letters 68 (2000) 109 –112 1
on (a) 92 countries from 1960 to 1990, and (b) 48 US states from 1900 to 1990. In these two cases it is less easy than for the European data to characterise an alternative hypothesis to geographical proximity. For (a) we use continent zero / one dummy variables, and for (b) we use zero / one dummy variables based on a conventional regional grouping of those states. Although these dummies are, to some extent, arbitrary, they do have the effect of grouping data points known to have some similarities. Furthermore, if the proximity hypothesis is correct it should be robust to alternative specifications, however arbitrary.
From all three data sets the same conclusion emerges: in the absence of wider-area dummies physical distance does help to explain the pattern of economic growth but it has almost no explanatory power when those dummies are included. We conclude that distance per se is not important. The paper is in one main section where we explain our methodology, which is based on Moreno and Trehan (1997) and Anselin (1988), and present our results.
2. Methodology and results
We derive our results through estimation of the following relationship:
[I2rW ]G5Xb1´ (1)
where G represents an n31 vector of the per worker or per capita growth rates of n economies over the data period; W represents an n3n matrix of distance weights where each weight is greater the
closer the particular economies are to each other; X is an n3k matrix of other possible influences on
growth rates; b is a k31 vector of coefficients; ´ is an n31 vector of error terms assumed to be
2
distributed N(0, s ). The parameter r is of especial interest: the hypothesis we are investigating is that it is significantly positive even when the wider-area dummy variables are included in the X matrix.
For each of the data sets the distance weights are based on the great circle distances between each country, region or state. The definition of a representative element of W, w , is:ij
1 /dij
]]]
wij5 n (2)
O
1 /dijj51
where d is the great circle distance between economies i and j. This definition of the weights, whichij
1
C.L.F. Attfield et al. / Economics Letters 68 (2000) 109 –112 111
forces the weights to sum to one, amounts to assuming that it is relative rather than absolute distance
2
which matters.
Because the growth rate of each economic unit can be affected by the growth rate of the others, the likelihood function for the relationship in Eq. (1) contains a Jacobian term, giving a likelihood of the form:
2 2
L5 2(n / 2)lnp2(n / 2)lns 1lnuI2rWu2´9´/ 2s . (3)
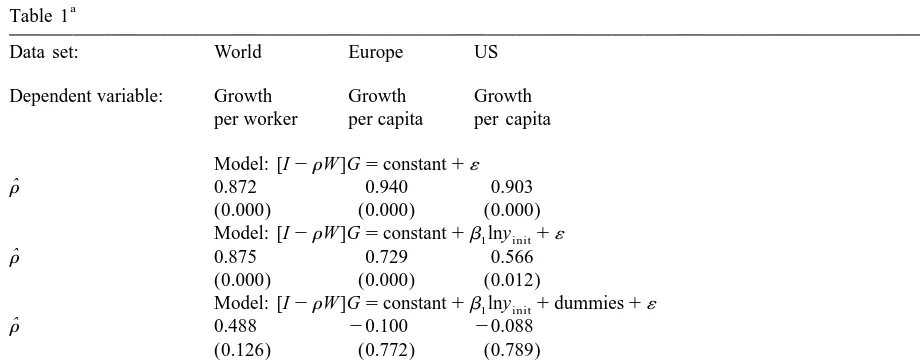
We obtained maximum likelihood estimates using the OPTMUM routine in GAUSS (1994). In Table 1 we present, for each data set, the estimated value ofr and its associated P-value when the X matrix contains (i) only a constant; (ii) a constant and the initial level of income (to capture so-called
3
convergence); and (iii) a constant, the initial level of income and the appropriate set of wider-area dummies.
The first striking feature of Table 1 is thatr appears to be highly significant when no other variable
4
is included in the model and to be very similar in all three data sets. The estimates suggest that a one
a
Table 1
Data set: World Europe US
Dependent variable: Growth Growth Growth per worker per capita per capita Model: [I2rW ]G5constant1´
In brackets are the P-values of the null hypothesis that the coefficient directly above is zero. Ln yinit is the log of the economic unit’s level of income at the start of the period. There are five continent dummies included in the results for countries; seven country dummies for the European regions; and three regional dummies for the US states. The dummies P-value is in each case the probability of finding the computed likelihood ratio test statistic of the null hypothesis that the wider-area dummies are jointly insignificant if that null were true.
2
Experiments with different weighting procedures, e.g. using the inverse of the distance raised to a power or dropping the assumption of the weights summing to one, made little substantial difference to our results.
3
The coefficient on the initial level of income variable is often used to estimate the speed of convergence (see Barro and Sala-i-Martin (1995, p. 387)). However, as Friedman (1992) emphasises, this interpretation may be invalid: measurement error in output might by itself account for the negative relationship between the log of initial output and the difference between the log of end and log of initial output.
4
112 C.L.F. Attfield et al. / Economics Letters 68 (2000) 109 –112
percentage point increase in the distance-weighted growth rate in the rest of the world (or of Europe or of the US) is associated with almost a one percentage point increase in the growth rate of the country (or European region or US state). A second feature is that the estimated value of r remains highly significant when the initial level of income is included in the X matrix. However, when the wider-area dummies are included this significance disappears in all three cases. Furthermore, a likelihood ratio test of the null hypothesis that the wider-area dummies are jointly insignificant produced the P-values shown in the last row of the table and suggest a strong rejection of the null.
3. Conclusions
Our conclusion can be simply stated. The results from three different data sets suggest that geographic proximity per se does not have a key role to play in explaining the tendency of economic growth rates to cluster.
References
Anselin, L., 1988. Spatial Econometrics: Methodology and Models, Kluwer Academic, The Netherlands. Barro, R.J., Sala-i-Martin, X., 1995. Economic Growth, McGraw-Hill, New York.
Friedman, M., 1992. Do old fallacies ever die? Journal of Economic Literature 30, 2129–2132. GAUSS, Aptech Systems Inc, Maple Valley, WA.