DESERT ECOSYSTEMS: MAPPING, MONITORING & ASSESSMENT USING SATELLITE
REMOTE SENSING
A.S Arya*, Ajai*, P.S. Dhinwa *, V.S Arya# & R.S Hooda# *Space Applications Centre, Ahmedabad, India # HaryanaRemote Sensing Applications Centre, Hisar, India
(*[email protected]) KEY WORDS : Desertification, ecosystem, UNCCD, frost-heaving, cold desert
ABSTRACT :
Desert ecosystems are unique but fragile ecosystems , mostly vulnerable to a variety of degradational processes like water erosion, ve-getal degradation, salinity, wind erosion , water logging etc. Some researchers consider desertification to be a process of change, while others view it as the end result of a process of change. There is an urgent need to arrest the process of desertification and combat land de-gradation. Under the auspices of the United Nations Convention to Combat Desertification (UNCCD), Space Applications Centre, Ah-medabad has undertaken the task of mapping, monitoring and assessment of desertification carrying out pilot project in hot and cold desert regions in drylands on 1:50,000 scale followed by systematic Desertification Status Mappaing (DSM) of India on 1:500,000 scale. 105.48 mha area is under land degradation / desertification in India. A few studies have been carried out for monitoring the multi-temporal changes in the desertification status of some selected areas.
1. INTRODUCTION
Deserts mostly constitute the hyper-arid and arid areas, the later being part of the ‘drylands’, which encompass an estimated 61.47 million km2 area of the earth. Hyper-arid areas (P/PET <0.05) cover 9.78 million km2, arid (P/PET 0.05 - <0.20) 15.69 million km2, semi-arid (P/PET 0.20 - 0.50) 23.05 million km2, and dry sub-humid (P/PET 0.50 - <0.65) 12.95 million km2 . In Asia, out of the 19.49 million km2 area under drylands, an estimated 10.75 million km2 (excluding the hyper-arid areas) is susceptible to de-sertification (UNEP, 1977). In India alone, about 3.2 million hec-tare land constituting 12 percent of the geographical area is af-fected by this process. (UNEP, 1977). The geo-hydro-thermo folio of India makes large parts of the country vulnerable to dif-ferent forms of degradation, and is further accentuated by high biotic pressure - human and livestock population – resulting in unsustainable land use. A large part of our country’s land is un-dergoing the process of degradation or desertification.
A. Aubreville (1949), a French scientist, popularized the term de-sertification in his report as long back as 1949 and others (e.g. Le Houerou, 1962) have discussed the phenomenon since the late 1950s. Aubreville, viewed desertification primarily as a process but also referred to it as an event (the end state of a process of de-gradation). Ever since, the description and definition of the word desertification has been evolving with ever increasing research and understanding of the phenomena worldwide. The various processes of desertification include vegetal degradation, water erosion, wind erosion, water logging, salinity etc. in hot dryland areas, while the processes active in the cold desert include frost-shattering, frost-heaving in peri-glacial areas and mass-wasting along the slopes. There are various facets of studying desertifica-tion viz. mapping, monitoring, assessment. and mitigadesertifica-tion.
2. CAUSES OF DESERTIFICATION
Desertification, as previously defined, can only occur on land prone to degradation processes. The vulnerability to desertifica-tion of land is determined by current climate, relief, the state of the soil and natural vegetation and the socio economic conditions prevailing in the area. Climate has a major influence through three factors rainfall, solar radiation and wind which all affect physical and mechanical erosion phenomena and chemical and biological degradation. Relief acts mainly to exacerbate water erosion and also help the process of mass movement. The state of the soil, in terms of its texture, structure and chemical and biological status, is a predominant factor in dry subhumid zones, where climate has less impact; it plays a crucial role in vulnerability to desertifica-tion through human activities. The same applies to the state of the natural vegetation: the result of past and recent influences; of cli-matic, pedological and often, human factors. Because of their longevity and powerful root systems, trees are a primary source of protection from soil degradation and their absence, too often caused by human action, is a serious handicap.
Human activities are the main factors triggering and or accelerating the desertification processes on vulnerable land. The impact of human society does not depend solely on its density. Some of the human activities that can cause desertification are:
• Cultivation of soils that are fragile, or exposed to erosion by wind or water;
• Reduction in the fallow period of soils, and lack of organic or mineral fertilizers;
• Overexploitation of woody resources, in particular for fuel wood;
• Uncontrolled use of fire for regenerating pasture, for hunt-ing, for agricultural clearhunt-ing, or for setting certain social con-flicts;
• Agricultural practices that destroy the soil structure, espe-cially the use of unsuitable agricultural machinery;
• Agricultural practices that result in the net export of soil nu-trients, leading to loss of the soil fertility, such as cash-cropping;
• Diversion of rivers to create irrigation schemes; or
• Irrigation of soils prone to salinization, Alkalinization or even waterlogging.
All these activities derive from two root causes. The first five are typical of poverty and underdevelopment, while the rest result from “modern” development that disregards the impact of the technologies used on land sustainability.
Climatic conditions like frequent droughts, natural denudational processes like erosion/ geological hazards and human interference are the major contributors to the process of desertification. However, the detailed contributors are as follows:
• Drop in frequency and amount of rainfall (Drought) • Dwindling vegetal cover
• Dwindling groundwater table
• Salinity increase due to excess irrigation.
• Water logging especially along canals and high yield wells in undrained areas
• Shifting sand sheets/ dunes
• Increase in the temperature extremities • Improper agricultural management practices • Climatic change
• Overgrazing • Over cultivation
• Very high variation in temperatures
3. CONSEQUENCES OF DESERTIFICATION
The consequences of desertification – the phenomenon of land degradation – depend on four factors that vary by region, country and year:
The severity and extent of land degradation;
The severity of climatic conditions (especially annual rainfall); The number and diversity of affected populations; and The level of development of the country involved.
Desertification should be viewed as a breakdown of the fragile balance that allowed plant, human and animal life to develop in arid, semi-arid and dry sub humid zones. This breakdown of the equilibrium and of the physical chemical and biological processes that sustain it represents the start of a process of self-destruction for all elements of the life system. Thus soil vulnerability to wind and water erosion, the lowering of the water table, the impairment of the natural regeneration of vegetation, the chemical degeneration of soils – themselves all immediate results of desertification – worsen the situation. Desertification feeds on itself.
By limiting natural potential desertification reduces production and makes it increasingly precarious. Forced to attend to the most urgent things first, populations resort to survival strategies that unfortunately make desertification worse and prevent any development.
The most immediate and generally widespread of these survival strategies is to intensify overexploitation of the most readily available natural resources, but at the cost of enormous effort. The second strategy is to sell off everything owned, including agricultural equipment to cope with the monetary needs of development (e.g. schooling, social services, contributions to pump maintenance), or food crises (buying food). The third strategy is increasing rural migration: this may simply involve men and young people leaving for a seasonal or longer-term job in other areas of the country, particularly the towns, or going to other countries; or the migration may take on the proportions of a population exodus in search of better living conditions.
These survival strategies are often accompanied by breakdowns in the integrity of communities and sometimes of families. When survival is difficult, people become withdrawn and sometimes strongly individualistic, which leads to ethnic, family or individual conflict.
4 STATUS OF DESERTIFICATION
4.1 Global
As on today, world desert area is about 5 million sq. km. and an additional 40 million sq km is arid or semi arid. About 33 percent area of earth’s surface exhibits desert like conditions to some de-gree or other. Additional desert like conditions are added at the rate of 60,000 sq km per year. (WED 1998). The areas peripheral to the present desert are directly under the threat of desertifica-tion.
In Asia, about 35 per cent of the productive land seriously faces desertification hazards. As per the “Assessment of Human In-duced Soil Degradation (GLASOD)”, Asia has worst loss of productivity due to desertification in the world. Some 18 devel-oped countries suffer from desertification. Africa has, by far, the greatest amount of hyper arid land, mainly the Sahara Desert, fol-lowed by Asia, Australia and New Zealand, together, are 83 per-cent dryland, virtually all of it in Australia. Australia has the greatest amount of drylands, but none of it is hyper arid. Approx-imately 3 percent of the world's drylands are irrigated, 9 percent are rainfed cropland, and 88 percent are rangelands. The domin-ance of rangelands, with their high percentage of degraded land, is why the global desertification level is a high 70 percent.
4.2 India
In India alone, arid zone covers about 3,20,000 sq. km. (12 per cent of the geographical area). Besides, there’s an additional 70,300 sq. km. area of cold desert. Rajasthan occupies the greater part of the Indian arid landscape and about 60% area of the state, lying west of the Aravallis followed by Gujarat (19 %), Punjab & Haryana (9 %) and Karnataka & Andhra Pradesh (10 %). About 50.8 mha (15.8%) of the country’s geographical area is ar-id. About 123.4 mha (37.6%) of the country’s geographical area consists of the semi-arid region. About 54.1 mha (16.5%) of the country’s geographical area falls within the dry sub-humid region (NBSSLUP, 2001).
5. UNCCD/TPN-1 PROGRAMME
Under the auspices of United Nations Convention to Combat De-sertification (UNCCD), Regional Action Programme (RAP) to combat desertification have been formulated and accordingly RAP for Asian region has been initiated as a collective effort by the member countries. The aim of RAP is to strengthen the exist-ing capacities of the member countries of the Asian Region to take suitable measures for combating desertification. Under Re-gional Action Programme, six thematic programme areas were identified. The first one, Thematic Programme Network (TPN-1) is on Desertification Monitoring and Assessment. The overall ob-jective of TPN-1 is to enhance the desertification monitoring and assessment capacities in the region through the establishment of a network and the harmonization of approaches for its conduct in the region. China has been identified as the host country to coor-dinate TPN-1 activities among the member countries in establish-ing the Asian Regional Desertification Monitorestablish-ing and Assess-ment Network (TPN-1). In India, Space Applications Centre (ISRO), Ahmedabad has been identified as the national focal in-stitution to coordinate TPN-1 activities within the country and es-tablish the national network for desertification monitoring and as-sessment. In continuation towards realizing the goals of TPN-1 within India, a pilot project has been taken up to standardize and evolve a comprehensive national classification system and me-thodology for Desertification Status Mapping under various dry-land conditions in both Hot and Cold regions in India. A national network on desertification monitoring and assessment (DMA) has been established in the country. Some organizations, such as SAC/ISRO, AISLUS, NBSSLUP, CAZRI, NATMO, IMD, MOEF, Univ. of Rajasthan, JNU, Jammu University, IRS Anna University, NRSA, MPRSAC Bhopal, CRIDA (ICAR), HARSAC Hissar, DES Srinagar, and RRSSC Jodhpur etc. responsible for desertification combating / monitoring in the country have been included as the nodes of national network
6. INDICATORS OF DESERTIFICATION
One of the important elements of desertification monitoring and assessment is to identify / define the indicators and the frequency interval at which these need to be recorded / monitored. Some-times the choice of indicators is limited by the constraints in terms of the available technology and infrastructure for collec-tion/measurement and processing of the data needed to generate a particular indicator. Many of the indicators are amenable to re-mote sensing and thus are depicted on the satellite imageries.
The task of defining and finalizing the indicators for desertifica-tion monitoring and assessment (DMA) to be used in the country, was taken up by the TPN-1 national working group. The indicator systems were finalized by the working group on the basis of the literature survey, the benchmarks and indicators already in use at international level as well as deliberations by the working group in 2001. The finalized indicators were discussed and fine tuned in the brain storming session held on 29th Jan 2003 at Space Appli-cations Centre, Ahmedabad. The indicator system finalized for use in TPN-1 execution in the country are given below. These in-dicator systems are in harmony with the inin-dicators system adopted for the Asian region under TPN-1.
The indicator system for desertification monitoring and assessment are classified into four categories viz.
1. Pressure Indicators: Climatic indicators and socio-economic. 2. State Indicators: Hydrological, Physical, Biological etc. 3. Impact Indicators: Socio-economic, migration,
unemploy-ment etc.
4. Implementation Indicators: The changes in the land cover conditions owing to mitigation measures aimed at combat-ing desertification.
7. PILOT PROJECT
Under the auspices of the United Nations Convention to Combat Desertification (UNCCD), Space Applications Centre, Ahmeda-bad had undertaken the task of mapping, monitoring and assess-ment of desertification. It was the first ever attempt in the country to systematically study the problem of desertification in Arid, Semi-Arid and Dry Sub-humid areas, in both hot and cold desert regions of India. It is also for the first time a comprehensive clas-sification system, legend and exhaustive list of indicators, has been evolved for both hot and cold regions of the country by evolving and standardizing the methodology, classification sys-tem and indicators of the desertification, for both, cold and hot deserts of the country. This required to prepare an institutional structure in India and harmonizing the approach including data-base with the regional node of the UNCCD, which was done suc-cessfully through various brain storming sessions and subsequent-ly by carrying out pilot project, in collaboration with 16 different organizations/ academic institutions, for 8 districts (hot desert) and 8 watersheds (cold deserts) in drylands on 1:50,000 scale. Some examples like Dausa district, Rajasthan in hot desert and Chamba watershed, HP in cold desert areas are illustrated in fig. 1 and fig. 2, respectively.
Fig. 1: DSM of Dausa district , Rajasthan
Fig. 2: DSM of Chamba watershed, HP.
8 NATIONAL DESERTIFICATION MAPPING:
The herculean task of Desertification Status Mappaing (DSM) of India on 1:500,000 scale was finally accomplished involving 17 different organizations, academic/ scientific institutions etc. from across the country. The first ever Desertification / Land Degrada-tion Status Map of India was generated on 1:500,000 scale using AWiFS data (Fig.3 )
Fig. 3: Desertification / Land Degradation Status Map of India
The results show that the total geographical area undergoing the process of desertification and land degradation in India is about 105.48 million hectares (mha), which constitutes 32.07 % of the total geographical area (TGA). Among the states, highest percent of desertification / degradation is observed in the Gujarat state(68.43%) followed by Rajasthan (67%) and J&K (60.73%).
Among the NE states that fall outside the dryland boundary, the maximum land degradation is seen in Mizoram (78 %) (Ajai et. al. 2009).
9. DESERTIFICATION MONITORING
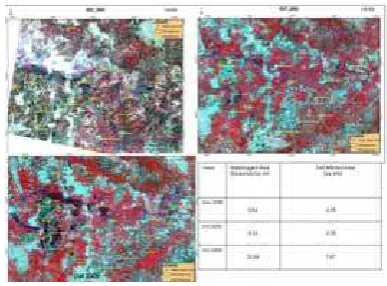
Some studies have been carried out for monitoring the multi-temporal changes in the desertification status of some selected areas, over the period of past few years. One such area in Nathu-sari block of Sirsa district in Haryana shows increament of salini-ty and water-logging from 1992-2009 (fig 4 ).
Fig. 4: Desertification Change detection (Nathusari Block, Ha-ryana).
It suggests the dynamic nature of land degradation and thus the need for cyclic assessment of desertification in a regular period of time interval.
10. MITIGATION OF DESERTIFICATION
Mitigation of desertification is an essential element of desertifica-tion studies i.e. to arrest the process of desertificadesertifica-tion and this has been attempted for a watershed in Ladakh district using remote sensing and other ancillary data. A combating plan has been gen-erated for mitigation of desertification in this part of cold desert area suggesting actions to be taken in various parts of the wa-tershed (fig. 5)
11. FUTURE PLAN
The desertification studies have been demonstrated end-to-end i.e. mapping, monitoring and mitigation, by the combined effort of SAC, Ahmedabad and several national participating agencies. It has been suggested by experts to repeat the feat of DSM by using latest satellite data and compare it with the results of the DSM prepared using 2003-2004 data. This would help in monitoring and assessment of the status, trend and rate of desertification change in the country. A draft proposal for the 2nd cycle of na-tion wide DSM has been prepared for submission to the Ministry of Environment & Forest (MoEF)
REFERENCES
Ajai, Arya A.S., Dhinwa, P.S., Pathan S.K and Ganesh Raj, K. (2009), Desertification / Land Degradation Status Mapping of India, Current Science Vol. 97, No. 10, 25 November 2009.
Aubreville, A., (1949), Climats, forests et desertification de l’ Afrique tropicale, Societe de Editions Geographiques, Maritimes at Coloniales, Paris
Le Houerou, H.N. (1962). Les pâturages naturels de la Tunisie aride et désertique. Paris, Inst. Sces. Econ. Appl. Tunis
NBSS&LUP (2001), Agro - ecological subregions of India for planning and development, NBSS&LUP Publication (2001), ICAR, Nagpur, Maharashtra.
The world Envt. Directory 1998
UNEP, 1977. UNEP and fight against desertification, Nairobi, Kenya
ACKNOWLEDGEMENT: