• Tidak ada hasil yang ditemukan

isprsarchives XXXVIII 4 W19 27 2011

N/A
N/A
Protected

Academic year: 2017

Membagikan "isprsarchives XXXVIII 4 W19 27 2011"

Copied!
6
0
0

Teks penuh

(1)

SYNERGISTIC USE OF OPTICAL AND RADAR DATA FOR RAPID MAPPING OF

FOREST FIRES IN THE EUROPEAN MEDITERRANEAN

E. Bernhard a, *, E. Stein a, A. Twele a, M. Gähler a

a

German Aerospace Center (DLR), 82234 Oberpfaffenhofen, Germany - (Eva-Maria.Bernhard, Enrico.Stein,

André.Twele, Monika.Gaehler)@dlr.de

KEY WORDS: Forest fire, SPOT 5, TerraSAR-X, burned area mapping, semi-automatic algorithm, European Mediterranean

ABSTRACT:

In a classical approach, optical data are being used for forest fire detection in a rush mode. Difficulties arise due to persistent cloud coverage, haze layers and smoke plumes. In contrast, radar measurements offer high acquisition rates because of their ability to penetrate clouds and their independence of sun illumination. However, a visual interpretation of radar data is generally less intuitive than optical imagery for an untrained image analyst. Thus the main focus of our work was to combine the advantages of both data types and to develop a robust and fast but at the same time precise and transferable algorithm for burned area detection in the European Mediterranean region. Object-based change detection approaches and a synergistic use of optical and radar data can improve detection capabilities. The optical part of the algorithm covers very high resolution satellite images (like SPOT 5) including index calculation such as MSAVI, BAI and NDSWIR in single-temporal approaches and their temporal differences in multi-temporal approaches. Within the scope of both methodologies the burned area can be detected with an accuracy higher than 90%. In line with other authors (Libonati et al., 2011; Pereira et al., 1999) our work confirms the middle infrared band as crucial for burned area detection. The radar algorithm was based on TerraSAR-X StripMap data acquired before and after the forest fires. Different polarisations (VV and HH) have been used to improve the forest fire mapping capability. In addition, a comparison of burned and unburned areas was performed using different backscatter coefficients. These change detection techniques were based on image differences, image ratios and index calculation. The image segmentation was performed by using the new calculated layers. The burned area was then classified via a threshold given by the pre- and post- disaster differences. The classification result achieved an accuracy of 78%. This result shows the limitations of burned area mapping with microwaves. Therefore a combination of the optical and the radar technique, which takes advantage of both the optical accuracy and the ability of microwaves to penetrate clouds, led to the design and implementation of a single- and multi-temporal, object-based and semi-operational tool for burned area mapping.

* Corresponding author

1. INTRODUCTION

Forest fires do not only pose an urgent threat to land and life but also contribute to erosion and land degradation. Furthermore, fires affect global warming due to CO2-emissions (Chuvieco, 2009). Since the 1970s the number of forest fires doubled in the Mediterranean region (Justice & Koronzti, 2001). In 2009, fires destroyed more than 323.000 hectare of land (JRC, 2009). The increasing amount of fires reflects socioeconomic changes in traditional living conditions and use of land. The abandonment of large areas of farmland leads to the recovery of natural vegetation and an increasing pressure from tourism additionally amplifies the risk of fires (Leone et al., 2009). The increasing number of forest fires also reflects regional changes such as a reduced availability of moisture and higher temperatures as a result of climate change. Due to an ongoing global warming, the number of forest fires will most likely continue to rise in future. For this reason, a comprehensive monitoring and mapping of burned areas is mandatory. A fast and accurate detection of these areas is indispensable both for on-site help and for an assessment of the aftermath. Forest fires often affect large areas, where accessibility is frequently limited. In this context, remote sensing can play a leading role to detect forest fires in a fast, cost-effective and objective manner (Pereira et al., 1999). In the course of devastating forest fires in Greece and Spain in July/August 2009, the International Charter Space and Major

Disasters was triggered. The forest fires destroyed more than

6.500 hectare comprised of farmland and forests and numerous residents had to be evacuated. The Center for Satellite Based

Crisis Information (ZKI) of the German Aerospace Center

(DLR) was assigned to detect the burned areas in a rapid mapping context based on the following data sets: SPOT 5, IKONOS, ALOS AVNIR-2 and TerraSAR-X. In some scenes, cloud cover precluded the detection of fires, and spectrally similar regions (cloud shadows, coastal areas and open space) led furthermore to misclassifications within the optical satellite images. Thus, the goal of our work was the critical assessment of these shortcomings and the design and implementation of a robust and fast but at the same time precise and transferable, semi-operational algorithm for burned area detection in a rapid mapping environment. Within this context, different approaches and a combination of optical and radar data have been investigated.

Optical remote sensing is a well known tool for monitoring forest fires (Bastarrika et al., 2011; Chuvieco et al.; 2008, Alonso-Benito et al., 2008; Roy et al., 2005; Stroppiana et al., 2002). Fires destroy most of the vegetation, reduce the moisture in plants and soil, expose the soil, modify nutrients in plants and soil, and increase temperature (Arino et al., 2001; Gitas et al., 2009; Pereira et al., 1999). This results in a lower reflectivity in the near infrared bands (NIR) and mostly higher reflectivity in the middle infrared (MIR) and thermal bands of the electromagnetic spectra (Hlavka et al., 1996; Koutsias & Karteris, 1996; Pereira et al., 1999). Since the reflectance difference in the NIR is highest in comparison between pre- and

(2)

post-disaster acquisitions, and the MIR region is virtually unaffected by the presence of aerosols associated to biomass burning, this spectral range is crucial for burned area detection (Koutsias & Karteris, 1996; Libonati et al., 2011; Pereira et al., 1999). Satellites with low spatial resolutions, but high repetition rates and large swath widths (such as MODIS, KMSP-OSL, AVHRR, ATSR) are often used for hot spot detection (Arino & Rosaz, 1999; Justice et al., 2002; Stolle et al., 2004), whereas satellites with a high spatial resolution but lower temporal resolution are used for detailed burned area mapping (Gitas et al., 2004). In case of rapid burned area mapping for on-site help, satellites with high or very high spatial resolution are mandatory.

Spaceborne Synthetic Aperture Radar (SAR) data have often been used to map land cover changes which occur in bad weather conditions due to its ability to penetrate cloud and haze layers (Attema et al., 1998). In addition they are independent of sun illumination and thus offer a high repeat frequency in data acquisitions which could support fire dispersion mapping. Previous work confirmed the utility of SAR data for the detection of burned areas in different parts of the world, whereas most studies were carried out in the boreal forest (Bourgeau-Chavez et al., 1995; French et al., 1999; Ranson et al., 2001). Some exceptions such as Gimeno et al. 2004, Menges et al. 2004, Siegert & Rücker 2000 and Tanase et al. 2010 (a) focused on forest fires in the Mediterranean region, in the tropical rain forest and Australia. Most researchers prefered P-, L- and C-band data for burned area mapping (Gimeno et al., 2004; Menges et al., 2004; Ranson et al., 2001), except Tanase, whose studies showed promising results in using X-band data for fire severity assessment in Mediterranean environments. The radar backscatter coefficient is influenced by viewing geometry, soil and vegetation type, moisture, as well as orientation, surface roughness and topography. The removal of leaves and branches due to fire directly affect the backscattering behaviour of the radar signal. However, dependent on the study area, a backscatter increase over burned areas as well as a decrease could be detected (Nakayama & Siegert, 2001; Tanase et al., 2010 (a)). Since X-band SAR data cannot penetrate as deeply into the vegetation as L- or P-band wavelengths, the radar signal of vegetated areas is mainly influenced by canopy surface scattering (Tanase et al., 2010 (b)).For this reason, the suitability of X-band SAR data for burned area detection in combination with the optical burned area mapping needs to be investigated.

2. STUDY SITES

The study sites were located in the south of the Canary Island La Palma and in Grammatico, 30 kilometers northeast of Athens, Greece. Both study areas are located in the European Mediterranean region where the climate is marked by wet and mild winters and dry and hot summers. These conditions make the Mediterranean prone to forest fires, primarily in the late summer months, when the vegetation suffers from water stress. Both study areas are characterised by a high difference in altitude which ranges from sea level up to 500 meters (Greece) and 1900 meters (La Palma). The forest fire in Grammatico was located near the Gulf of Petalion in the east and the Gulf of Notois Evoikos in the north. Figure 1 shows the two study sites, in which the burned area can clearly be distinguished (brown) from the remaining parts of the image. The dominant land cover before the fire was sclerophyllous vegetation, pastures and transitional woodland-shrub vegetation (CORINE land cover classification 2000). Several forest fires, fanned by strong winds, destroyed approximately 3.100 hectare of land. The fires in La Palma were located in the south of the island and affected an area covered by coniferous forest, pastures, sclerophyllous vegetation, sparsely vegetated areas and agricultural areas which consisted of fruit trees and berry plantations (CORINE land cover classification 2010). The total burned area in La Palma comprises approximately 2.800 hectare.

3. SATELLITE DATA AND PRE-PROCESSING

The optical data set consists of numerous satellite images such as SPOT 5, IKONOS and ALOS AVNIR-2. The SPOT 5 images have been acquired under the best weather conditions with the fewest clouds in comparison to other satellite images. They are available as a satellite data pair before and after the fires in La Palma and are thus used for the analysis. The applied pre-processing includes orthorectification using a digital elevation model (DEM) with 30 meters pixel spacing, topographic normalisation, co-registration to the other satellite data and atmospheric correction.

The SAR data set consists of three pairs of TerraSAR-X StripMap data, always acquired before and after the forest fires. Corresponding data pairs have been acquired with the same orbit parameters and scene extent. The data takes were ordered in single-look slant-range complex (SSC) format. All scenes were multi-looked to a resolution of 3x3 meters per pixel and the Gamma-DE-MAP speckle filter was applied. Subsequently, the images were radiometrically calibrated, geocoded and Figure 1. Study sites in Greece and La Palma, shown by SPOT 5 images acquired after the forest fires (band

combination MIR, NIR and green)

(3)

orthorectified. In order to avoid radiometric distortions due to topography, a topographic normalisation has been applied. All resulting images were converted to the radar backscatter coefficient sigma nought, which is expressed in dB units. Due to the lack of ground truth data, the SPOT 5 images of Greece and La Palma were used for the validation of both the optical and the radar detected burned area. The affected area used for validation was derived through a visual classification based on different band combinations and indices such as e.g. MSAVI, NDSWIR and BAI.

4. ALGORITHM DEVELOPMENT

All pre-processed satellite images were further analysed in the eCognition Developer software. The algorithm has been developed in cognition network language (CNL). Figure 2 shows the methodological sequence of the crucial steps for burned area detection considering optical and radar data. The object-based segmentation and classification was separately applied to both data types. Since a pair of SPOT 5 images was available for the forest fires in La Palma, change detection approaches were applied to these images, whereas in Greece, a single-temporal technique was used. In case of the radar algorithm, change detection approaches were applied to all scenes. Finally, a combination of both algorithms was used to improve classification results. In order to simplify and accelerate image classification, a user interface was generated. In the following, the three different algorithms are explained in more detail. multiresolution and spectral difference segmentation)

2. classification

single-temporal multi-temporal -MSAVI - dMSAVI - NDSWIR - dNDSWIR - BAI - dBAI

algorithm development

1. pixel-based change detection

(differencing, rationing and index calculation)

2. segmentation

(two-level approach containing multiresolution segmentation)

3. classification

(multi-temporal based on image differencing)

The first processing step applied to all SPOT 5 images was an image segmentation. In order to receive a useful segmentation, it needs to be considered that burned areas do not show any uniform texture or shape characteristics. This challenge was solved by means of a two-dimensional segmentation approach. Therefore a multiresolution segmentation was used for the generation of small and large scaled objects, and a spectral difference segmentation was used for the generation of spectrally similar and more homogenous objects by their layer mean intensities. The colour information of the near and middle infrared bands was of the highest interest. The parameters used can be modified interactively by the user interface.

The second step applied was the classification of the burned area, based on the following spectral indices:

(1)

(2)

(3)

Where: red, near and middle

infrared band

To avoid misclassifications, the first step of the classification was the exclusion of most unburned parts of the image. The unaffected areas were classified during a fuzzy classification using the indices MSAVI and NDSWIR. Subsequently, cloud shadows were extracted with the help of the normalised middle infrared. Finally, the burned area was classified by means of a fuzzy classification approach containing the MSAVI, BAI and NDSWIR. All applied classification steps were threshold based. The different threshold values were determined by a literature review and visually by an iterative approach, whereas the user interface simplified the adjustment to different investigation areas.

In order to take multi-temporal data sets into account, a change detection algorithm was developed. For this purpose, the temporal difference of the previously listed spectral indices was used, namely:

(post fire NDSWIR pre fire NDSWIR

(post fire MSAVI pre fire MSAVI

(post fire BAI pre fire

BAI

Figure 2. Workflow for optical and radar burned area detection

(4)

The extraction of unburned objects follows through the previously mentioned steps. For the detection of burned areas, a fuzzy approach based on the reflectance differences between pre- and post- disaster objects was used.

The applied methods were transferred to other study sites in Sardinia and Greece, where devastating fires occurred in 2009, respectively 2007.

4.2 Radar algorithm

Different pixel based change detection techniques were applied to all TerraSAR-X images. The difference, the ratio and the normalised change index (NCI) were calculated as follows:

(7)

Subsequently, an image segmentation based on these three change detection layers was performed. A two-dimensional segmentation approach based on multiresolution segmentation was used.

Within the classification procedure, the first step was to extract areas covered by water in order to avoid misclassifications due to high difference values of the sea surface. This step was performed on the post-disaster satellite image. Water usually acts like a specular reflector and could thus be discriminated due to low backscatter values. The image information given by the calculated difference, ratio and normalised change index layer was more or less equivalent. Thus, considering the rapid mapping workflow, the difference layer was used for burned area mapping. The affected area was detected via a threshold based on a difference value. Small, misleadingly detected unburned areas were eliminated by defining a minimum mapping unit.

The applied method was developed in Greece and transferred to the forest fire 2009 in La Palma.

4.3 Synergistical use of optical and radar data

The goal of the work was to exploit the advantages of both optical and radar data. Therefore, the previously listed algorithms were integrated into one final rule-set. First, the optical and the radar data were separated into two different maps. Subsequently, the segmentation and classification steps were applied equivalent to the previous listed algorithm for optical and radar data (4.1 and 4.2). In order to be able to mask clouds and cloud shadows, further classification steps were integrated. Min/Max filtering as implemented in the eCognition Developer software was applied to highlight the contrast between bright clouds and its darker surroundings. The resulting layer was included as an additional object feature and used for the detection of clouds. To avoid misclassifications and improve classification results, additional classification steps

such as e.g. region growing, merge region, or enclosed by class were applied. The cloud shadows were classified by the normalised middle infrared and through its spatial neighbourhood to clouds.

Finally, within the optical map, the burned areas, clouds and cloud shadows as well as all unburned objects were classified. Within the radar image the burned area, the water bodies and all unburned objects were classified. For a combined use of both classification layers, the classification results were simplified to the classes burned, unburned and potentially burned (clouds and cloud shadows). The last step in this synergistic approach was the synchronisation of the two separated maps into one final map. The new map contains two levels, one for the optical classification result and one for the radar classification result. If an object is classified as potentially burned in the optical level, but as burned using radar data, it is finally added to the burned area. The two different classification results were combined into one final thematic layer. Thus, the whole burned area, also containing regions covered by clouds and cloud shadows, could be detected.

5. RESULTS, CONCLUSION AND FURTHER WORK

5.1 Results

A backscatter and reflectance analysis of burned and unburned objects was applied to the SPOT 5 and TerraSAR-X scenes. The single- as well as the multi-temporal analysis of the SPOT 5 data showed highly different values over burned areas compared to the unburned areas. In Greece as well as in La Palma, the class separability between affected and unaffected areas was highest in the NIR and MIR infrared bands. Therefore, indices using these two bands (MSAVI, BAI and NDSWIR) were applied to avoid misclassifications between burned areas, cloud shadows, coastal areas and open space. Most of the objects which are spectrally similar to burned areas were accurately classified as unburned. Nevertheless, some problems arised during the classification of cloud shadows close to the burned areas and for very small objects near the coast and in urban regions. Within the multi-temporal algorithm, these weaknesses were not as distinct as in the single-temporal approach. To avoid misclassifications between harvested and burned areas, the dBAI brought best results. The single-temporal approach resulted in an overall accuracy of 91 % whereas using the multi-temporal approach an overall accuracy of 95 % was achieved.

The single-temporal analysis of the TerraSAR-X data showed only slightly higher backscatter values over burned areas compared to the unburned areas, which turned out as insufficient for burned area detection. However, the multi-temporal backscatter analysis showed a clear increase over the burned areas compared to the pre- disaster image. The difference values for VV-polarisation were higher (3,4 dB) compared to HH difference values (1,6 dB). The higher backscatter difference can be explained by the fact that vertical polarisation is more sensitive to vertically oriented objects than horizontal polarisation. In case the vegetation, primarily stems, is not completely destroyed through fire, the backscatter of vertical polarised waves interacts stronger with the remaining objects, strengthened through the double bounce effect arising between stems and the ground. This leads us to the assumption that burned area mapping might profit from the use VV polarised data instead of HH polarised data.

fire

(5)

Another interesting aspect concerning the SAR-based burned area detection came up when further investigating the La Palma fire. The fire affected areas are marked by a high difference in pre-disaster vegetation cover, with primarily coniferous forests in the upper parts of the burned area and sclerophyllous vegetation in the lower parts (CORINE land cover classification 2000). An intersection with the TerraSAR-X and SPOT 5 derived burned area showed that TerraSAR-X could mainly detect coniferous forests, whereas burned sclerophyllous vegetation could only be detected using SPOT 5 data. This leads to the assumption that the pre-disaster vegetation density could act as limitating factor in forest fire mapping with X-band SAR data.

The technique developed for burned area mapping with radar data showed promising results. The classification result achieved an overall accuracy of 78 %. This result is clearly limited in comparison to the accuracy reached by the optical algorithm. Thus, a satisfying result could just be reached in a combination of both techniques. Figure 3 highlights this biggest advantage of the synergistic approach. It shows the burned area of Greece in a SPOT 5 image. The crucial region covered by clouds and cloud shadows is enhanced in the zoom-box. The burned area detected by the optical sensor is highlighted in purple. The burned area was clearly detected, with just some minor omission and commission errors. By the help of SAR data, a decision of clouds and its shadows in affected or unaffected objects is possible. The majority of the objects in the south of the zoom-box were classified as burned, whereas clouds and its shadows in the west and east remained classified as such. Thus, the synergistic use of optical and radar data can improve the classification result.

The analysis of forest fires in Sardinia 2009 and Greece 2007 (optical algorithm) and La Palma 2009 (radar algorithm) brought good results and confirmed the transferability of the investigated algorithm for other study sites in the European Mediterranean region.

5.2 Conclusion and further work

Within this work, a SPOT 5 and TerraSAR-X image processing methodology was developed to investigate the usefulness of a

synergistic use of both data types for burned area mapping in the European Mediterranean. Within the optical burned area analysis, the reflectance values of burned areas changed significantly in the comparison to unburned regions. The highest values in maximal reflection and class separability were observed in the NIR and MIR, while the MIR was crucial to avoid misclassifications with spectrally similar regions in the visible and NIR range. The classification result concerning indices derived from these bands was highly accurate. Problems arised in the misclassification of cloud shadows close to the burned area, and clouds and cloud shadows which precluded the detection of the fires.

In the domain of SAR burned area mapping, the temporal variation of dual-polarised (HH and VV) backscatter coefficients was assessed. The backscatter level increased significantly, whereas using VV polarisation, the backscatter amplitude between pre- and post-disaster images was higher than the HH polarised backscatter. Burned area detection with X-band SAR data achieved remarkable results in a multi-temporal change detection approach. Further, we found that sparse and lower growing pre-fire vegetation could probably limit the burned area mapping with X-band SAR.

Remote sensing data used to detect forest fires must be both temporally close in acquisition and rich in details. These two conditions can be satisfied if optical and radar data are used simultaneously. This work developed an algorithm for a synergistic use of both sensor types, allowing an all weather forest fire mapping in a rush mode. Thus, the synergistic use of optical and radar data can improve the classification result and foster the on-site help. The object-based, semi-automatic, robust, fast but at the same time accurate algorithm is a useful tool for the detection of forest fires in the European Mediterranean region.

Further research should focus on an enhanced data fusion and should include combined data from multiple satellites in order to improve the timeliness and accuracy of burned area mapping. The information derived from different microwave bands (C-, L-, or P- bands) needs to be investigated since it could lead to a more detailed understanding of forest fires and to a further improvement of mapping accuracies.

Since forest fires cause similar effects to vegetation like loss of crown foliage and branches, our work showed the transferability of the developed algorithm to other Mediterranean environments. However, different trends may be observed in other environments such as boreal or tropical forests, or savanna vegetation which might be challenging for the developed algorithm. Thus, an enhancement of the method developed and its transferability to other study sites in different parts of the world and under varying weather conditions is expected in the future.

6. REFERENCES

References from Journals:

Alonso-Benito, A., Hernandez-Leal, P., Gonzalez-Calvo, A., Arbelo, M., Barreto, A., 2008. Analysis of different methods for burnt area estimation using remote sensing and ground truth data. IEEE Geoscience and remote sensing symposium,

IGARSS, pp. 828-831.

Attema, E., Duchossois, G., Kohlhammer, G., 1998. ERS-1/2 SAR land applications: Overview and main results. IEEE –

geoscience and remote sensing symposium, IGARRS, pp.

1796-1798. Figure 3. Optical and radar classification of the burned

areas in Greece

(6)

Bastarrika, A., Chuvieco, E., Martín, P., 2011. Mapping burned areas from Landsat TM/ETM+ data with a two-phase algorithm: Balancing omission and commission errors. Remote

Sensing of Environment, 115, pp. 1003-1012.

Bourgeau-Chavez, L., Kasischke, E., French, N., 1995. the detection and interpretation of Alaskan fire-disturbed boreal forest ecosystems using ERS-1 SAR imagery. IEEE –

geoscience and remote sensing symposium, IGARRS, pp.

1246-1248.

Chuvieco, E., Englfield, P., Trischenko, A., Luo, Y., 2008. Generation of long time series of burn area maps of the boreal forest from NOAA-AVHRR composite data. Remote Sensing of

Environment, 112, pp. 2381-2396.

French, N., Bourgeau-Chavez, L., Wang, Y., Kasischke, E., 1999. Initial observations of Radarsat imagery at fire-disturbed sites in interior Alaska. Remote Sensing of Environment, 68, pp. 89-94.

Gimeno, M., San-Miguel-Ayanz, J., Schmuck, G. 2004. Identification of burnt areas in Mediterranean forest environments from ERS-2 SAR time series. International

Journal of Remote Sensing, 25(22), pp. 4873-4888.

Justice, C., Giglio, L., Koronzti, S., Owens, J., Alleaume, S., Morisette, J., Roy, D., Petitecolin, F., Descloitres, J., Kaufman, Y., 2002. Global fire products from MODIS. Remote Sensing of

Environment, 83, pp. 245-263.

Libonati, R., DaCamara, C., Pereira, J., Peres, L., 2011. On a new coordinate system for improved discrimination of vegetation and burned areas using MIR/NIR information.

Remote Sensing of Environment, article in press.

Lu, D., Mausel, P., Brondizio, E., Moran, E., 2004. change detection techniques. International Journal of Remote Sensing, 25(12), pp. 2365-2407.

Menges, C., Bartolo, R., Bell, D., Hill, G., 2004. The effect of savanna fires on SAR backscatter in northern Australia.

International Journal of Remote Sensing, 25(22), pp.

4857-4871.

Roy, D., Jin, Y., Lewis, P., Justice, C., 2005. Prototyping a global algorithm for systematic fire-affected area mapping using MODIS time series data. Remote Sensing of

Environment, 97, pp. 137-162.

Siegert, F., & Rücker, G., 2000. Use of multitemporal ERS-2 SAR images for identification of burned scars in south-east Asian tropical rainforest, International Journal of Remote

Sensing, 21(4), pp. 831-837.

Stolle, F., Dennis, R., Kurniwan, E., Lambin, E., 2004. Evaluation of remote sensing-based active fire datasets in Indonesia. International Journal of Remote Sensing, 25(2), pp. 471-479.

Tanase, M., Pérez-Cabello, F., Riva, J., Santoro, M., 2010 (a). TerraSAR-X data for burn severity evaluation in Mediterranean forests on sloped terrain. IEEE transactions on geoscience and

remote sensing, 48 (2), pp. 917-929.

Tanase, M., Santoro, J., Riva, J., Pérez-Cabello, F., Toan, T., 2010 (b). Sensitivity of X-, C-, and L-Band SAR Backscatter to

Burn Severity in Mediterranean Pine Forests. IEEE transactions

on geoscience and remote sensing, 48 (10), pp. 3663-3675.

References from Books:

Arino, O., Piccolini, I., Kasischke, E., Siegert, F., Chuvieco, E., Martín, P., Li, Z., Fraser, R., Eva, H., Stroppiana, D., Pereira, J., Silva, J., Roy, D., Barbosa, P.,.2001. Methods of mapping

surfaces burned in vegetation fires. In: Ahern, F. (Ed.): Global

and regional vegetation fire monitoring from space: planning a coordinated international effort, SPB Academic Publishing bv, pp. 227-257.

Chuvieco, E., 2009. Global impacts of fire. In: Chuvieco, E. (Ed.): Earth observation of wildland fires in Mediterranean ecosystems, Springer, pp. 1-11.

Gitas, I., De Santis, A., Mitri, G., 2009. Remote sensing of burn

severity. In: Chuvieco, E. (Ed.): Earth observation of wildland

fires in mediterranean ecosystems, Springer, pp. 129-149.

Hlavka, C., Ambrosia, V., Brass, J., Rezendez, A., Guild, L., 1996. Mapping fire scars in the Brazilian cerrado using

AVHRR imagry. In: Levine, J., (Ed.): Biomass burning and

global change, Cambridge, pp. 555-560.

Justice, C., O., & Koronzti, S., 2001. A review of the status of

satellite fire monitoring and the requirements for global environmental change research. In: Ahern, F. (Ed.): Global and

regional vegetation fire monitoring from space: planning a coordinated international effort, SPB Academic Publishing bv, pp. 1-19.

Leone, V., Lovreglio, R., Martín, M., Martínez, J., Vilar, L., 2009. Human factors of fire occurrence in the Mediterranean. In: Chuvieco, E. (Ed.): Earth observation of wildland fires in Mediterranean ecosystems, Springer, pp. 149-179.

Pereira, J., Sá A., Sousa, A., Silva, J., Santos, T., Carreiras, J., 1999. Spectral characterisation and discrimination of burnt

areas. In: Chuvieco, E. (Ed.): Remote Sensing of large

wildfires in the European Mediterranean basin, pp. 123-138.

References from Other Literature:

Arino, O., & Rosaz, J., 1999. 1997 and 1998 world ATSR Fire atlas using ERS-2 ATSR-2 data. Proceedings of the joint fire science conference, Boise, University Idaho, USA, Volume 1, pp. 177-182.

JRC (Joint Research Centre), 2010. Forest fires in Europe 2009, report number 10, JRC scientific and technical reports, Italy.

Koutsias, N. & Karteris, M., 1996. Logistic regression modelling of thematic mapper data for burnt area mapping. Aristotelian university of Thessaloniki, Dept. of forestry and natural environment, lab. Of forest management and remote sensing.

Nakayama, M., & Siegert, F., 2001. Comparative study on C and L band SAR for fire scar monitoring, 22ND Asian conference on remote sensing, Singapore.

Ranson, K., Kovacs, K, Sun, G., Kharuk, V., 2001. Fire scar detection using JERS, ERS and Radarsat data in the Bogucany area, Eastern Siberia, CEOS-SAR01-073.

Gambar

Figure 2.  Workflow for optical and radar burned area detection
Figure 3.  Optical and radar classification of the burned areas in Greece

Referensi

Dokumen terkait

International Archives of the Photogrammetry, Remote Sensing and Spatial Information Sciences, Volume XXXVIII-4/W19, 2011 ISPRS Hannover 2011 Workshop, 14-17 June 2011,

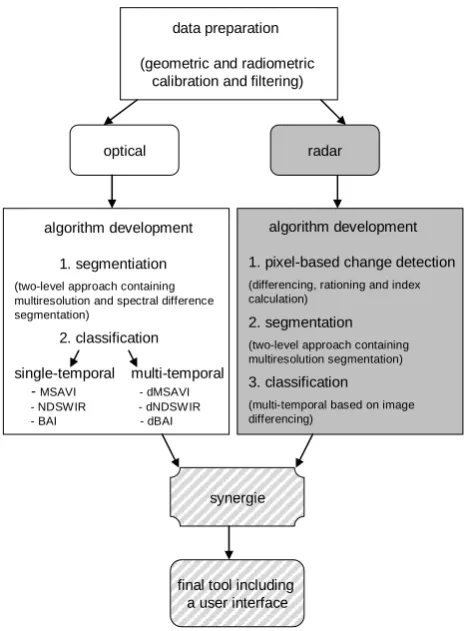
In the third step the predicted models from the Coarse Classification including the ratings and the new found edges from Image Based Verification are used together to do a

International Archives of the Photogrammetry, Remote Sensing and Spatial Information Sciences, Volume XXXVIII-4/W19, 2011 ISPRS Hannover 2011 Workshop, 14-17 June 2011,

International Archives of the Photogrammetry, Remote Sensing and Spatial Information Sciences, Volume XXXVIII-4/W19, 2011 ISPRS Hannover 2011 Workshop, 14-17 June 2011,

International Archives of the Photogrammetry, Remote Sensing and Spatial Information Sciences, Volume XXXVIII-4/W19, 2011 ISPRS Hannover 2011 Workshop, 14-17 June 2011,

Further testing was then performed within BLUH in order to determine the optimal set of additional parameters, compensating for systematic image errors and impact upon object

DeCOVER serves as a national extension of the European Global Monitoring for Environment and Security (GMES) initiative. It was initiated to develop land cover information

DTM data are generated by a filtering process performed on DSM data to International Archives of the Photogrammetry, Remote Sensing and Spatial Information Sciences,