EXPOSER INTENSITY, VULNERABILITY INDEX AND LANDSCAPE CHANGE
ASSESSMENT IN OLOMOUC, CZECH REPUBLIC
M. S. Boori1,2 *, V. Vozenilek1, K. Choudhary1 1
Palacky University Olomouc, 17. listopadu 50, 771 46 Olomouc, Czech Republic – [email protected] 2
Geographical Institute, Ruhr University Bochum, Germany
THEME: DISA – Natural disasters monitoring, warning and response.
KEY WORDS: Vulnerability Index, Exposer Index, Sensitivity Index, Adaptive Capacity Index
ABSTRACT:
The objective of this study is vulnerability and exposer intensity due to land use change in Olomouc, Czech Republic. Vulnerability assessment with exposer intensity to land use/cover change is an important step for enhancing the understanding and decision-making to reduce vulnerability. This study work includes quantification of Exposure Index (EI), Sensitivity Index (SI) and Adaptive Capacity Index (AI). EI is based on intensity of land use/cover change, SI and AI based on natural factors such as elevation, slope, vegetation and land use/cover. Vulnerability Index (VI) derived on the quantification of SI and AI and compared from 1991, 2001 and 2013. Comparing of EI and VI for last three decades, settlements have highest vulnerability index due to high socio-economic activities and water have lowest vulnerability index due to less human interferences. Agriculture has highest exposer index and second highest vulnerability, which show its high rate of exploitation and production. In the study areas, vulnerability tends to increase with the increase of exposure to land use change, but can peak off once the land use start to benefit socio-economically from development. Only in this way we can enhance the adaptive capacity of study area to use change of land.
* Corresponding author. This is useful to know for communication with the appropriate person in cases with more than one author. 1. INTRODUCTION
In Olomouc, Czech Republic highly productive regions with high density of population are most exploited areas. These areas are experiencing various environmental impacts and climate change associated with local, regional and global issues. These areas are highly vulnerable to threats from both natural processes and socio-economic activities (Andrade, et al., 2010; Boori, et al., 2014). Present research on vulnerability is focus on natural disasters and climate related impacts such as droughts, floods, see level rise and cyclones (Lankao, 2010; Boori, et al. 2014), but not on non-climatic parameters such as elevation, slope, aspects, vegetation and socio-economic activities (Nicholls, et. al., 2008; Boori, et. al. 2014). Maximum vulnerability studies are on national and continental level but at small level, local factors along with socio-economic activities such as land use change and pollution, might have more profound impacts than global climate change.
In this research work we used three terms (exposure, sensitivity and adaptive capacity) inside the vulnerability. While there is considerable heterogeneity in both the potential impacts of environmental changes, and the adaptive capacity to cope with these impacts, this assessment shows that study area in particular will be vulnerable to natural parameters, ecosystem and land use change (Boori, and Amaro, 2010). Projected economic growth increases adaptive capacity, but is also associated with the most negative potential impacts. The potential impacts of more environmentally oriented developments are smaller, indicating an important role for both policy and society in determining eventual residual impacts (Boori, and Amaro, 2010).
Economic growth directly effect on land use change because a large part of forest and agriculture area convert in urbanization
and industrial areas. Recent studies shows, that there is a positive feedback between landscape urbanization and economic growth in Czech Republic (Boori, and Vozenílek, 2014), indicating the existence of a strong driver for land use conversion from forest and agriculture to urban use (Bai, et al., 2012; Boori, and Ferraro, 2015). This conversion some time cause of excessive exploitation of natural resources and their regional imbalance. These changes are main cause of different types of vulnerability and their transfer from one to other type of vulnerability. The main objective of this paper is to develop a module with an indicator system to compare vulnerability due to exposed of land use change, using the concepts of exposure, sensitivity and adaptive capacity (Boori, and Vozenílek, 2014). The results are showing relationship between vulnerability, exposure and land use change. In last we compare results for last three decades for 1991, 2001 and 2013.
2. METHODOLOGY
2.1 Vulnerability concept
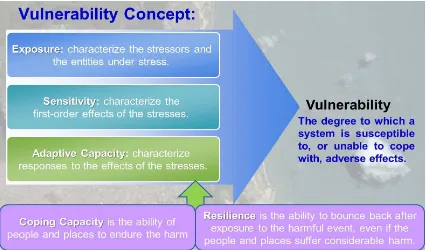
As vulnerability include the three dimensions: exposure, sensitivity, and adaptive capacity. Where exposure components characterize the stressors and the entities under stress; Sensitivity components characterize the first order effects of the stresses; And adaptive capacity components characterize responses to the effects of the stresses (fig. 1). These measures can be quantitative (e.g., precipitation variability, distance to market) or qualitative (e.g., political party affiliation, environmental preservation ethic). Another slightly different view favoured by the hazards and disasters research community is that adaptive capacity consists of two subcomponents: coping capacity and resilience. Coping capacity is the ability of people and places to endure the harm, and resilience is the ability to bounce back after exposure to the harmful event, even if the people and places suffer considerable harm. In both cases, individuals and communities can take measures to increase their abilities to cope and bounce back; Again depending on the physical, social, economic, spiritual, and other resources they have or have access to (Boori, et al., 2014).
Figure 1. Vulnerability concept (Mukesh Boori PhD thesis).
Another basic issue for the evaluation a model is to assign weights to each factor according to its relative effects of factors considered on the vulnerability in a thematic layer. The analytic hierarchy process, a theory dealing with complex technological, economical, and socio-political problems (Saaty, and Vargas, 1991), is an appropriate method for deriving the weight assigned to each factor. The degree of membership within different levels of different indices was integrated using weight and the total degree of membership for different thematic layers was used to calculate the whole study area vulnerability. The application of subjective weightings on the one hand gives us some indication of how the relative importance of different factors might vary with context, and can also tell us how sensitive vulnerability ratings are to perceptions of vulnerability in the expert community.
2.2 Standardised the indicators
This study is based on the quantification of sensitivity and adaptive capacity. Here various indicators are define and measure sensitivity and adaptive capacity such as elevation, slope, vegetation and land use. In this study, adaptive capacity is defined as the ability of the natural resources to adapt to a changing environment caused by land use change, which depends on natural factors. Land use change is a spatial manifestation of human activities, associated with regional planning, land management and economic development. High intensity of land use may present a potential threat to local ecosystem or community. Land use change may impact on geology, geomorphology, soil, vegetation, surface water body, quality of water and create disturbance in ecosystem and natural vegetation around villages were destroyed, but population and industry increased a lot, making sewage and garbage beyond the purification capacity of ecosystem. So the natives would be dissatisfied and suffer psychological and economic losses. (2) The percentage of occupied farmlands with the expansion of industrial and residential areas. (3) The percentage of lack of fresh water resource by the reason of flow reduction and pollution. While flow reduction is the result of occupation of catchment areas and river ways by waterproof buildings, and pollution is the result of excessive industrial waste. Since aquiculture and agriculture both depended on fresh water, farmers have been severely affected. (4) The degree of unemployment. It is much serious in farmers because of farmland loss. (5) The rate of loss of traditional culture. In a changing environment, the traditional culture always fades away to exchange for economic opportunity, such as traditional architecture. Adaptive capacity is the ability of human sectors to handle change, which is determined by various factors such as economic development, technology and infrastructure, information, knowledge and skills (Lindner, et al., 2010).
It is important to note that each designated indicator system is inevitably subjective (fig. 2). It presents only one possible result of vulnerability assessment. Therefore, it is more meaningful to use these indicators to compare relative values across study area as well as longitudinal comparison within the same area, rather than trying to make sense of the absolute
Where yij is the standardized value of indicator; xij is the initial value of indicator; i is the serial number of the study area, j is the serial number of the indicator; m is the number of study areas, n is the number of indicators (fig. 2).
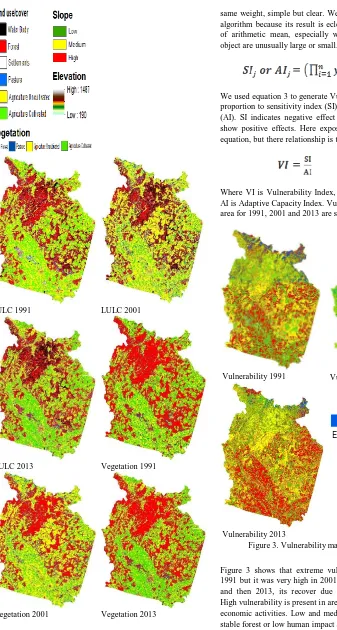
LULC 1991 LULC 2001
LULC 2013 Vegetation 1991
Vegetation 2001 Vegetation 2013
Figure 2. DEM, Slope, vegetation and land use/cover maps.
After the standardization, SI and AI can be calculated based on Eq. (2), equal to the geometric mean of its standardized indicators. In this way the information of every indicator is contained by the target index, and each indicator is given the
same weight, simple but clear. We choose the geometric mean algorithm because its result is eclectic and smoother than that of arithmetic mean, especially when some indicators of an object are unusually large or small.
(2)
We used equation 3 to generate Vulnerability Index (VI). VI is proportion to sensitivity index (SI) and adaptive capacity index (AI). SI indicates negative effect of land use change and AI show positive effects. Here exposure is not including in the equation, but there relationship is the core of this study.
(3)
Where VI is Vulnerability Index, SI is Sensitivity Index, and AI is Adaptive Capacity Index. Vulnerability maps of the study area for 1991, 2001 and 2013 are shown in figure 3.
Vulnerability 1991 Vulnerability 2001
Vulnerability 2013
Extrem High Medium Low
Figure 3. Vulnerability maps of the study area.
Figure 3 shows that extreme vulnerability was very less in 1991 but it was very high in 2001 due to degradation of forest and then 2013, its recover due to governmental protection. High vulnerability is present in areas, which is related to socio-economic activities. Low and medium vulnerability present in stable forest or low human impact areas.
2.3 Exposer intensity based on land use change
heuristic and carried out changes over the landscape. The definition of forest cover was minimum 30% canopy coverage which provides a distinct delineation between scrub areas and dene forest. Follow-up field work was conducted in October 2013 and February 2014, to determine ambiguous land-cover classification. Visit study area to determine major changes and there causes by observations and informal interviews of local people. This also provided a secondary validation of the classification accuracy for the most current image date. Since land use change was defined as the exposure of land classes in this study, we constructed Exposure Index (EI) based on land use intensity, which reflects the degree of human impact on natural land, containing information on patterns and their proportions of land use (Liu, 1996).
(4)
Where EI is the Exposure Index, i is the rank of land use; Ci is the area percentage of land use of rank i. EI can be calculated according to Eq. (2) and Table 1. We make n = 4 in Table1.
Types of land use Rank(i) Example Limited used 1 Forest
Low impact used 2 Agriculture land Medium impact
used
3 Pasture and water body
High impact used 4 Settlements, tourism, industry, transport
Table1. Correspond between types and ranks of land use.
3. RESULTS
3.1 Correlation in vulnerability index and exposure index
for all land cover classes
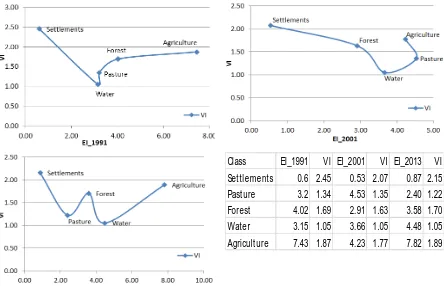
VI was calculated based on the results of SI and AI (Eq. (3)). The values of VI and EI in five land cover classes are presented in Fig. 4. The result demonstrates that vulnerability of land cover classes tends to increase with the increase of Exposure Index, although this correlation does not follow a linear trend. Settlement is the most vulnerable one in five land cover classes. Explanations for the curve are: (1) water class follows relatively slow process of change, and still maintain stability. (2) Land use is changed rapidly in settlements, forest and agriculture, leading to rapid socio-economic transformation. The traditional agricultural system is collapsing, but emerging system on industry and commerce is trying to establish. These changes make the system vulnerable. In other words, these land-cover classes lost too much and gain too little from development. (3) Agriculture area encroached by other classes for commercial and urban residential and that`s why exploited most. Economic development and land use type are both relatively stable. No change or stable areas have much time to adjust in these changes and show stronger adaptive capacity.
1991 2001 2013
Class Area % Area % Area %
Wat er 209.85 10.49 243.77 12.19 298.85 14.94
Forest 804.02 40.2 581.49 29.07 715.61 35.78
Sett lement 29.87 1.49 26.42 1.32 43.55 2.18
Pasture 213.03 10.65 301.75 15.09 160.09 8
Agriculture 743.23 37.16 846.57 42.33 781.9 39.09
Total 2000 100 2000 100 2000 100
Table 2. Land use/cover area in three decade.
Class EI_1991 VI EI_2001 VI EI_2013 VI Set tlements 0.6 2.45 0.53 2.07 0.87 2.15 Past ure 3.2 1.34 4.53 1.35 2.40 1.22 Forest 4.02 1.69 2.91 1.63 3.58 1.70
Water 3.15 1.05 3.66 1.05 4.48 1.05
Agricult ure 7.43 1.87 4.23 1.77 7.82 1.89
Figure 5. Correlation of Vulnerability Index (VI) and Exposure Index (EI).
Comparing of EI and VI for last three decades, water have lowest vulnerability index and settlements have highest vulnerability index due to high socio-economic activities (fig. 5). Agriculture has highest exposer index and second highest vulnerability, which show its high rate of production and conversion. From 1991 to 2001 exposer intensity was reduced due to utilization of pasture area. Forest area have very less variation in vulnerability from 1991 to 2013 but its exposer was high from 1991 to 2001 and then stable due to governmental protection from 2001 to 2013. Water class is stable but from 2001 to 2013, its exposer was little bit high due to urbanization and industrialization. Pasture area have always second lowest vulnerability and low exposer rate but it was highest exposed in 2001 because it was used in place of agriculture land (fig. 5).
Figure 6. Transformation of five land cover classes over past 3 decades. S = Settlements, A = Agriculture, F = Forest, P =
Pasture, W = Water.
area land use change process. Undeveloped or less developed area was vulnerable within the land use change process. However, with resilience in difficult situations, it was adaptive and less vulnerable after its turning into developed area.
Generally, the curve of VI–EI is an inverted-U shape, which means VI will raise at first and drop later with the growth of EI. Besides, we cannot conclude every land cover class would develop through the path from rural stage to urban stage. In this case, the land use intensity of water did not change significantly during 1991–2013, the EI and VI of water was the least. If the land use will not evolve from agriculture to industrial and finally to urbanization in this area, the VI might decrease, considering the AI will improve with the development while the SI will remain stable. Furthermore the five stages are definitely typical ones, because they represent four types of driving forces for land use change, which are agricultural, governmental, industrial, and commercial forces (fig. 6). Agricultural force is the weakest one with the limit of productivity. Governmental and industrial forces always get entangled and are the most powerful forces to change the land use intensity. It is a weak pressure on land use intensity that land use type changes from industrial use to commercial use or residential use. These findings suggest that the more powerful driving force, the more pressure on land use intensity and the more the impact on natural resources. However, if the land covers classes own a strong adaptive capacity; their vulnerability can be trailed off (Zhao, et al., 2008).
4. CONCLUSIONS
Our results have important policy implications, for developed and developing countries that are undergoing rapid urbanization and industrialization. This conversion increases the vulnerability and exposer. Urbanization has negative impacts, particularly as a cause of environmental pollution derived by intensive energy consumption and material flows, and leading to dramatic changes in land use, loss of biodiversity, habitat fragmentation and a decline in ecosystem services which is the main cause of high vulnerability and exposer index. This case study articulated the effects of land use change and offered a vulnerability analysis framework for sustainability. The measurement of vulnerability and exposer can be appropriate and useful to identify vulnerable people, region or sectors at local scales under strict conditions. Our comparison of vulnerability and exposer index in different land cover classes that are undergoing similar transformation process but with a clear time lag may shed some lights to temporal trend of vulnerability and expose within a single land cover class that follows similar transformation trajectory. Further studies in different areas are required before any general conclusions can be made. Nevertheless, the results have strong policy implications, which suggest the need for tailor-made policy responses to enhance adaptive capacity of land cover class that are exposed to rapid land use change, and ensure the development associated with the land use change can benefit the local community as well.
ACKNOWLEDGEMENT
The authors grate fully acknowledges the support by the Operational Program Education for Competitiveness - European Social Fund (project CZ.1.07/2.3.00/30.0041 of the
Ministry of Education, Youth and Sports of the Czech Republic).
REFERENCES
Andrade, M.M.N.d., Szlafsztein, C.F., Souza-Filho, P.W.M., Araujo, A.d.R., 2010. A socioeconomic and natural vulnerability index for oil spills in an Amazonian harbor: a case study using GIS and remote sensing. Journal of Environmental Management 91, pp. 1972–1980.
Bai, X.M., Chen, J., Shi, P., 2012. Landscape urbanization and economic growth in China Positive feedbacks and sustainability Dilemmas. Environmental Science & Technology 46, pp. 132–139.
Boori, M.S., Vozenilek, V., Choudhary, K., 2014. Land use/cover disturbances due to tourism in Jeseniky Mountain, Czech Republic: A remote sensing and GIS based approach. The Egyptian Journal of Remote Sensing and Space Sciences, Doi:10.1016/j.ejrs.2014.12.002 Accepted.
Boori, M.S., Vozenilek, V., Choudhary, K., 2014. Land Use / Cover Change and Vulnerability Evaluation in Olomuc, Czech Republic, ISPRS Ann. Photogramm. Remote Sens. Spatial Inf. Sci., II-8, 77-82, Doi:10.5194/isprsannals-II-8-77-2014
Boori, M.S., Vozenilek, V., 2014. Land-cover disturbances due to tourism in Jeseniky mountain region: A remote sensing and GIS based approach. SPIE Remote Sensing. Vol. 9245, pp. 92450T: 01-11. Doi:10.1117/12.2065112
Boori M.S., Vozenilek V. (2014). Assessing land cover change trajectories in Olomouc, Czech Republic. International journal of Environmental, Ecology, Geological and Mining Engineering. Vol. 8(8): 540-546.
Boori, M.S., Vozenilek, V., Burian, J., 2014. Land-cover disturbances due to tourism in Czech Republic. Advances in Intelligent Systems and Computing, Springer International Publishing Switzerland. Vol. 303 pp. 63-72, Doi:10.1007/978-3-319-08156-4-7
Boori, M.S., Ferraro, R.R., 2015. Global land cover classification based on microwave polarization and gradient ratio (MPGR). Geoinformatics for Intelligent Transportation, Springer International Publishing Switzerland. pp. 17-37, Doi:10.1007/978-3-319-11463-7-2
Boori, M.S., Amaro, V.E., 2010. Land use change detection for environmental management:using multi-temporal, satellite data in Apodi Valley of northeastern Brazil. Applied GIS. Vol. 6(2) pp. 1-15.
Lankao, P.R., 2010. Water in Mexico City: what will climate change bring to its history of water-related hazards and vulnerabilities? Environmental and Urbanization 22, 157–178.
Liu, J., 1996. Macro-Scale Survey and Dynamic Study of Natural Resources and Environment of China by Remote Sensing. Press of Science and Technology of China, Beijing.
Nicholls, R.J., Wong, P.P., Burkett, V., Woodroffe, C.D., Hay, J., 2008. Climate change and coastal vulnerability assessment: scenarios for integrated assessment. Sustainability Science 3, pp. 89–102.
Saaty, T.L., Vargas, L.G., 1991. Prediction, Projection and Forecasting. Kluwer Academic Publishers, Dordrecht.