A RANGE BASED METHOD FOR COMPLEX FACADE MODELLING
A. Adami a, *, L. Fregonese b, L. Taffurelli c
a
Photogrammetry lab, Lab Systems, University Iuav of Venice, [email protected]
bLarifo, BEST Group of Politecnico di Milano, [email protected]
cLarifo, BEST Group of Politecnico di Milano, [email protected]
Commission V, WG 4
KEY WORDS: range map, height map, displacement map, 3d modelling,
ABSTRACT:
3d modelling of Architectural Heritage does not follow a very well-defined way, but it goes through different algorithms and digital form according to the shape complexity of the object, to the main goal of the representation and to the starting data.
Even if the process starts from the same data, such as a pointcloud acquired by laser scanner, there are different possibilities to realize a digital model. In particular we can choose between two different attitudes: the mesh and the solid model. In the first case the complexity of architecture is represented by a dense net of triangular surfaces which approximates the real surface of the object. In the other -opposite- case the 3d digital model can be realized by the use of simple geometrical shapes, by the use of sweeping algorithm and the Boolean operations. Obviously these two models are not the same and each one is characterized by some peculiarities concerning the way of modelling (the choice of a particular triangulation algorithm or the quasi-automatic modelling by known shapes) and the final results (a more detailed and complex mesh versus an approximate and more simple solid model). Usually the expected final representation and the possibility of publishing lead to one way or the other.
In this paper we want to suggest a semiautomatic process to build 3d digital models of the facades of complex architecture to be used for example in city models or in other large scale representations. This way of modelling guarantees also to obtain small files to be published on the web or to be transmitted.
The modelling procedure starts from laser scanner data which can be processed in the well known way. Usually more than one scan is necessary to describe a complex architecture and to avoid some shadows on the facades. These have to be registered in a single reference system by the use of targets which are surveyed by topography and then to be filtered in order to obtain a well controlled and homogeneous point cloud of the complex architecture.
From the point cloud we can extract a false colour map depending on the distance of each point from the average plane. In this way we can represent each point of the facades by a height map in grayscale. In this operation it is important to define the scale of the final result in order to set the correct pixel size in the map.
The following step is concerning the use of a modifier which is well-known in computer graphics. In fact the modifier Displacement allows to simulate on a planar surface the original roughness of the object according to a grayscale map. The value of gray is read by the modifier as the distance from the reference plane and it represents the displacement of the corresponding element of the virtual plane. Similar to the bump map, the displacement modifier does not only simulate the effect, but it really deforms the planar surface. In this way the 3d model can be use not only in a static representation, but also in dynamic animation or interactive application. The setting of the plane to be deformed is the most important step in this process. In 3d Max the planar surface has to be characterized by the real dimension of the façade and also by a correct number of quadrangular faces which are the smallest part of the whole surface. In this way we can consider the modified surface as a 3d raster representation where each quadrangular face (corresponding to traditional pixel) is displaced according the value of gray (= distance from the plane).
This method can be applied in different context, above all when the object to be represented can be considered as a 2,5 dimension such as facades of architecture in city model or large scale representation. But also it can be used to represent particular effect such as deformation of walls in a complete 3d way.
1. IL METODO
1.1 The architectural modelling
Architectural modelling represents a very challenging research field for many reasons. If the topics are Architectural, Archaeological and Cultural Heritage, it is obvious the their first characteristic is the uniqueness. Therefore in various architectures it is not possible to identify repeatable invariant geometric shapes, suitable as geometrical primitives, as it might occur in prefabricated buildings or in industrial systems, where you can create all the items for achieve a complete database. Also it is not possible to fix a-priori parameters, with absolute
value, that allow to tackle the various stages of parametric architectural modelling. In addition also the shape complexity of some buildings or parts of buildings, which requires a complex analysis to be investigated in its shape aspects and geometric genesis, before the modelling stage.
In addition to these aspects, closely linked to architectural shapes, it has to take account of other effects that make architectural modelling very complex. For example, the materials used in facades are often very difficult to represent in a three-dimensional digital model because it requires a very high level of detail, as well as the surface description, above all as concerning not the geometrical shape but its finishing, characterized by roughness, absorption and light reflection, etc.
Finally it has to consider the effects of time on architectures that appears as a punctual, but often widespread, degradation. All these aspects make difficult the modelling of a very complex architecture or archaeological find. In literature there are several methods to tackle this problem that can be summarized into two major methodological paths: the first one uses a parametric modelling (solid, NURBS surfaces, geometric primitives) and the second one makes use of different kinds of polygonal surfaces (mesh).
In the first case the difficulty is in the not completely automated managing of the process, that often requires the operator decisions at every stage because of the artefact uniqueness In the second case the modelling complexity is to identify the algorithms that allow the best transformation from initial data to the triangular or quadrilateral mesh of the final model. In the modelling, will certainly takes into account available starting data for shape description. In case of a very dense and accurate
data, as for example a point cloud, it’s possible to choose
indifferently the method to follow. However, when there are few elements (lines, points, corners) resulting for example from a photogrammetric survey, only 3D model construction through parametric modelling can be chosen for the representation of the shape.
It will be necessary to put attention to the searched result to decide the strategy to choose. In fact mesh modelling, when represents very detailed and accurate results, hardly combines with representations that must be lightweight in computer terms, for the need to be published into the web, or because they have to be part of a virtual animation.
Otherwise a parametric model, although generally lighter, often
doesn’t provide enough correspondence with the real object and
becomes a less meaningful model of the artefact to represent. At the same time it must be evaluated the final result to be achieved , not in terms of digital format, but in terms of content.
In fact it’s different if you want to get a metric architectural
survey or to provide a mimetic, an also dynamic, representation of the reality.
The method introduced in this paper doesn’t provide the best solution to all these problems, but it can be considered as a valid alternative to be chosen according to the formal complexity of the artefact to represent, and to the purpose of the work that allows to bypass some critical steps in the above mentioned processes.
1.2 A range based method
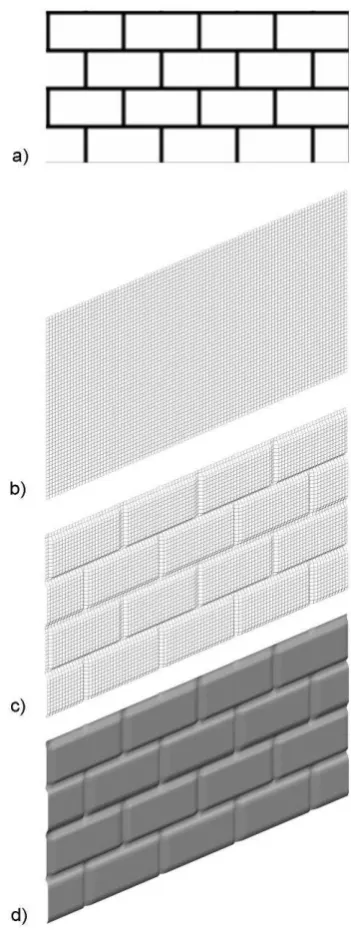
The range based method for architectural modelling is based on the false colour map which is a classical representation of geomatics to characterize a geometry with a radiometric code depending on different attribute such as the distance from a reference point, the height from a particular plane or the curvature in a specific point of a surface.
In this proposal the false colour representation is a range map, c) wireframe mesh with displacement, d) shaded mesh with displacement
Although range maps are really well-known in literature and very used in photogrammetric applications, they can be considered also an important help in the modelling step. In this method the height map is used not only after the acquiring step to make the reading of an architecture easier o as a final result. It is used also in a second step to understand how much a surface has to be deformed to correspond to the real object. Another idea in this approach comes from computer graphics. Modelling software uses many instruments to make the impression of the roughness of a surface, such as the superficial finishing of a material, the brick texture of a wall or of a wire-netting.
Sometimes these modifiers make only the impression of 3d (bump map), but some other times they allow the real deformation of a plane according to a displacement map. In order to obtain a 3d method, this tool, the displacement map, moves the each face of the mesh to modify along its own normal according to the value of the eight map.
Usually in computer graphics the displacement can be set in a metrical way or just for simulate an effect (but without and correspondence with reality). And the texture is often a binary raster image. The modifier tool reads the texture and assigns a displacement equal to 0 to the cell corresponding to black pixel and a displacement equal to the maximum to the white pixel, In some complex cases the texture in a raster image in gray-scale where the displacement of each point is normalized between the maximum and the minimum value
The method consists basically in the use of an height map as a normal texture used for displacement in the modelling process and the extraction of the displace value according to the distance from a plane.
It has also some connections with digital images.
To obtain the height map it is necessary, first of all, to define the reference plane for measures. But then it is important to set the amount of pixels because it gives the final resolution of the model. An important element to consider is the pixel size or, better, the average coverage of the pixel on the real surface of the object. According to the theory of graphicism mistake, the scale of representation can help to define the dimension of the smallest element of the representation. In a raster image the smallest element is the pixel so this theory gives the dimension of pixel at each scale of representation in order to be seen faces. In this way the result is a change in the amount of details of the model. These settings are depending on the quality of starting data, the possibility of computation and the final searched results.
2. OPERATIONS
2.1 The range map
As we said before, we consider a range map, or better the height map, as a binary raster image, in a known scale, with gray values depending on the distance from a reference plane. In this paper, the examples have been realized using laserscanner point clouds as starting data. But the same method can be extended to all kinds of pointclouds, also with different resolution, made for example by image-matching and the following restitution by auto-matching ( the method used by Arc3d, Photomodeller scanner, Photosynth with PMVS2) and even by the use of 3d cameras. triangulation 3d scanner, based on pattern projection, Scansystem Scanprobe Lt. As previously said, a different spatial resolution characterizes each of these instruments (about
2-5 mm for the “architectural” laserscanner and some tenths of
a millimetre). It involves that the height map will have a different resolution or that there will be necessary to use a different method to obtain the map.
Figure 2. Height map of a part of the facade of Cortile della Cavallerizza in Palazzo Ducale in Mantova. The pixel coverage is about 2mm
This paper avoids a deep description of the steps of laserscanner survey (data acquisition, inner and outer data processing) not because they are not important for the final results, but because they can be consider verified now.
For the architectonic applications, the acquired point clouds have been registered by the use of a topographical approach because it allows to check the accuracy of the operations and also because it guarantees the verticality of the reference system. The point clouds have been filtered to remove outliers and noise.
There are different methods and instruments (software) which can be used to build a depth map. But it is possible to identify two main possibility depending on the density of the representation. In the following examples Pointools, a software for laserscanner data, has been used. It allows to define the arbitrary reference place by choosing two point on the object in order to translate and rotate the reference system around the Z axis maintaining the verticality of the topographic system. Then it colours the points in gray scale depending on the distance from the arbitrary selected plane. Finally it is possible to export the raster image in gray-scale, a quasi-orthophoto, setting the
dimension of the pixel (the pixel coverage on the real object). As an alternative if the data is not so dense - second method-, it is necessary to use a software, for example Golden Surfer or Esri ArcGis which allows to filter data and to obtain a regular grid by interpolation with different algorithms.
Figure 3. Software Pointools: depth map
In either cases the depth map has to be represented always in gray-scale, in particular with the lighter colour for the most distant point from the reference plane and the darker colour the closest point. This code allows to the displace modifier to read exactly the map. It is also necessary to know the depth of the height map, the distance between the most distant point and the plane.
2.2 The displacement map
The suggestion of this paper, about the modelling of architectonic object, deals with the concept of displace which is implemented in many software of computer graphic and many rendering engines. It is developed in different ways depending on the specific software (as a texture map for material or a modifier, always displayed or only in the render step, etc), however the behaviour it is always the same: to displace the face of a mesh along its normal depending on the value of gray which is read in the reference image (depth map).
It is basic in this step to decide the true dimension of the initial mesh. The physical dimensions have to correspond to the real object and for the number of faces, triangular or quadrangular, it is important to consider the final scale of representation, but also the pixel coverage of the depth map.
The optimum case is when a quadrangular face of the mesh to be deformed correspond to a pixel of the depth map. It guarantees a high level of accuracy in the final model.
But it is possible to decrease the number of faces. In that case the final representation will be less detailed than the true one, but it could be appropriate to the scale of representation anyway.
The software, because of their settings in computer graphics, allows to set the max displacement in different ways: by introducing the exact value or by moving a cursor depending on the visual appearance. To obtain a correct 3d model it is necessary to set the true value of max displacement which can
be represented by “strength” of displacement or by the more explicit “minimum height” and “maximum height”. The
software will move the point corresponding to the white pixels f the max amount, and the points with black pixel will not move.
Figure 3. 3D model made by displacement map
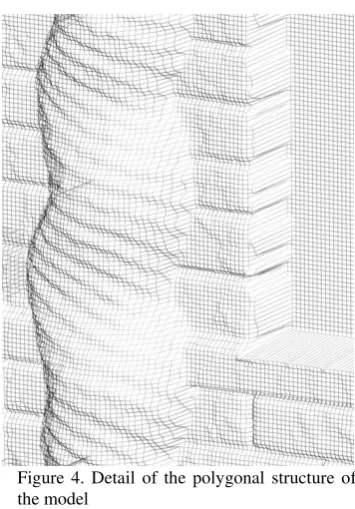
Figure 4. Detail of the polygonal structure of the model
However these different settings allow to obtain other kinds of representations, such as a 3d model with the exaggeration of the
depth value as it often happens in the representation of the territory.
3. APPLICATIONS
This method allow to realize a lot of models, but it can be used in some applications preferentially. By the use of a height map, it is suited particularly for the representation of 2,5 D objects as relieves, pavements, walls, façades and city fronts.
The following examples show some applications and they highlight the characteristics of the method.
Figure 5. Giardino della Cavallerizza” in Palazzo Ducale in Mantova.
a) depth map b) 3d perspective view
In the Cortile della Cavallerizza in Mantova, the architectural modelling by height map allows to obtain almost light models without losing the shaping complexity which characterize the architecture designed by Giulio Romano.
The pointclouds of the cortile have been acquired with the use of HDS 6000 so the scans have an high density. The depth map has been extracted directly from the registered pointclouds with the software Pointools. And the 3d model has been realized with 3d Studio Max, in particular with the displacement made with height map of Mental Ray render Engine.
This aspect is really evident in two aspects. First of all this method allows to represent not only the architecture but also its finishing detail such as the different treatment of the stone in memory. In this case, for example, it is possible to apply the 3d displacement aspect only in the render step so the working parametric model they should be modelled by the sweeping of a circular flute section along a spiral with variable eccentricity. In the figures also some problems of this method are evident. For example when there is no data because of an obstacle between the architecture and the laserscanner, the height map is black and the corresponding model is planar (it means no displacement).
Moreover in the detail of the balcony it is possible to discover the effect of a2,5 D modelling. So the model can be considered exact only from a front view.
These problems have to be considered in the use of this method to understand if however the final result is acceptable or not.
In the same fields of applications, the church of San Giorgio Maggiore in Venice represents another example. In fact the scans have been realized with a tof scanner, LMS Z390i, with a medium density of points (about 4 or 5 cm in the upper part of the facade). In this case the depth map has been made not with the raw data, but with interpolated data with Surfer software. The following representation are the same of the previous
example and it’s possible to discover the effects of 3d
modelling above all in the staircase and juxtaposition of the major order of the main part of the facade and the minor order of the lateral part.
Another application field which is particularly suitable to this approach is concerning relieves and decorative apparatus. The 3d model of the metopa in the Palazzo Ducale di Mantova has been acquired by a high resolution instrument.
The little dimensions (44 x 25 cm) of the relief and the high resolution of the pointcloud (about 0.3 mm) are suitable to obtain an high resolution depth map where the pixel coverage is about 0.5 mm.
According with the detailed depth map, also the 3d model is composed by a big amount of faces. In particular each face corresponds to a single pixel of the height map.
The high resolution makes this example particularly interesting because it gives an immediate representation of the depth of the relief. But it is interesting also the possibility of exaggerate the height of the metopa in order to have a more evident effect of
three-dimension.
As a problem we have to mention the aliasing effect due to the correspondence pixel-face. This effect can be avoided by the application of a smoothing filter in the rendering step.
Figure 7. San Giorgio Maggiore in Venice. a) Depth map b) 3d model texturized with depth map c) 3d model
4. CONCLUSIONS
The method introduced in this paper can be considered as a valid alternative or supplement to the well-known methodologies.
One of the most interesting application field is concerning 2,5d objects such as relieves, pavements, walls, façades and city fronts. Instead holes and back drafts, which are put orthogonally to the reference plane of the depth map, cannot be represented because the method calculates the displace along the normal.
But these aspects don’t invalidate the utility of this method that
can be used as well as the above mentioned objects for the 3d city models where the description of buildings is provided not by the orthorectificated images applied to the faces of the boxes, but by the 3d models of the facades.
Computer graphic applications allow also to use this method for dynamic representations in addition to digital effect such as the LOD techniques, Level of Detail, to increase or decrease the amount of details depending on the scale.
Figure 8. 3d model of a metopa in Palazzo Ducale in Mantova. a) real displacement; b) displacement exaggeration 4x
Figure 9. Height map and 3d model of a part of the relief
4.1 Bibliography
Bohm et al., 2007, Façade modelling for historical
architecture , Cipa proceedings, 2007
Fassi F, 2007, 3D modelling of complex architecture
integrating different techniques - a critical overview In: The
International Archives of the Photogrammetry, Remote Sensing and Spatial Information Sciences, Trento, 3D-ARCH 2007, Volume XXXVI-5/W47
Devebec, P, 1996, Modelling and Rendering Architecture from Photographs: A hybrid geometry- and image-based approach, SIGGRAPH 96 conference proceedings