D.M.M.Vock a,b, *, M.Jungmichel a
a
Volkswagen Group Research, Mobile Life Campus, Hermann-Münch-Str.1, 38440 Wolfsburg, Germany -
(Dominik.Vock, Markus.Jungmichel)@volkswagen.de
b
Technische Universität Dresden, Institute of Photogrammetry and Remote Sensing, 01062 Dresden, Germany
WG V/3 Laser Scanning 2011
KEY WORDS: Mapping, Surveying, Laser Scanning, Point Cloud, TLS, Mobile, Dynamic, Cost
ABSTRACT:
Mobile laser scanning systems (MLS) offer a great potential for acquiring detailed point cloud data of urban and suburban surroundings with minimum effort. In this paper a new solution for MLSs is presented, requiring solely a combination of a profile laser scanning device and systems that are included in today’s serialized end consumer vehicles. While today’s mobile laser scan systems require different and expensive additional hardware that needs to be mounted onto the vehicle, the devices included within vehicle electronics offer good alternatives without additional costs.
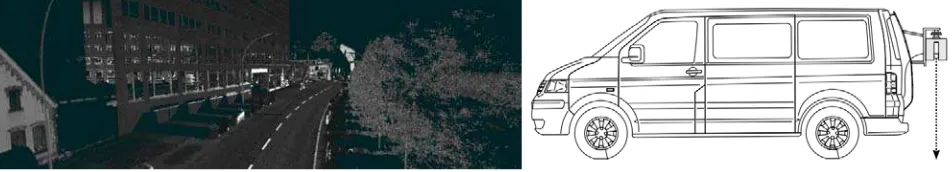
The actual scan consists of a continuous profile scan together with information gathered from on-board sensor modules. In a post-processing step, the sensor data is used to reconstruct the car’s trajectory for the period of the scan and, based on this information, the track of the scan device for every measured laser pixel. Synchronization of pixel data and vehicle movement is realized via a timestamp signal which is transmitted to the car’s field bus system and the scan device. To generate the final point cloud scenario, the trajectory is interpolated for every single scan point and used to convert its local position within the profile into the global coordinate system (Fig.1, Left).
Figure 1. Left: Sample rendering of a point cloud created with the presented system, Right: Illustration of the scan device mounted on the rear of a Volkswagen Transporter T5
* Corresponding author.
1. INTRODUCTION
In the fields of road-surveying, architecture and 3D city modelling, mobile laser scanning systems constantly gain in value for the fast acquisition of precise point cloud data. Currently available MLS usually consist of one or more scan-devices in combination with an inertial measurement unit (IMU), inertial navigation system (INS) and differential GPS that are mounted on the car (e.g. Rieger 2010). While surveying, the laser scan devices produce single line profile scans along their rotational axis, which corresponds to a helix-shaped sampling of the environment while the car is moving. The actual movement of the car is estimated from the IMU, INS and dGPS-Data, containing information about the car’s position and orientation as well as its linear and angular velocity. By combining this data with the continuous profile scans, a point cloud representation of the surrounding area can be generated. However, these MLSs are prohibitively expensive due to the additional sensor devices and hardware components that are used for estimating the
car’s movements as well as the complex preparation and calibration of the instruments.
Alternatively, today’s consumer vehicles that include driver assistance systems, such as the electronic stabilization program (ESP) already contain a multitude of sensors for analyzing the car’s movements with good precision that are communicated over a field bus system with real time capabilities. Thus, most of the devices that are mounted on currently provided MLSs are redundant regarding the already included car interior systems.
(section 3), the steps for the computation of the trajectory and synchronization with the scan data are discussed in section 4 and 5. Section 6 then describes the combination of the trajectory and profile laser scan data to a complete 3D point cloud. An insight into the results is given in section 7.
2. RELATED WORK
Regarding the usage of car interior sensor systems for computing the vehicle’s odometry, much research has been undertaken in the field of driver assistance systems. Often, the interior sensors are used in combination with additional information from different sources. This is based on the common aim to realize the computation of trajectories with a constant maximum global error for arbitrary long drives. Examples are the combination of the sensors with GPS (Bonnifait 2001) where the maximum error is given by the GPS accuracy and other approaches such as Bento 2005, using magnetic sensing rulers and magnetic markers as landmarks for the absolute positioning. In contrast to these approaches, the presented project aims at the 3D reconstruction of street scenarios of predetermined size, which is realized using a post-processing computation of the trajectory. As such, the requirements in this paper differ in few criteria and will be discussed in the following section.
3. REQUIREMENTS
For the computation of an appropriate trajectory and the subsequent combination with the profile scan data for a complete 3D point cloud, certain preconditions have to be satisfied.
Regarding the trajectory, the used sensors must offer sufficient accuracy for the measurements with preferably marginal error. Furthermore, reciprocal complement of different modules with similar information is desirable for error minimization.
Besides the actual sensor information, time synchronization between the modules must be ensured. Available MLSs usually include a real time computing system for this purpose to control the readout times of the single devices and the associated deadlines. This also includes the synchronization between trajectory data and the laser scan data.
4. GENERATION OF THE SCAN TRAJECTORY
To reconstruct the vehicle’s trajectory for the period of the scan, several aspects have to be analyzed. The following section presents an overview of the availability and suitability of car interior sensor systems for odometry, the required steps for the calibration of the system and the computation of the scan trajectory. The vehicle used within this project is a Volkswagen Transporter T5. As such the following data and conclusions are based on the evaluation of this model.
It should be noted that the available sensors don’t offer information about the car’s inclination angle. For this reason, the reconstruction of the scan trajectory was limited to planar surfaces.
4.1 The car interior sensor system
Today’s end consumer cars are equipped with different sensors as standard, which broadcast information about the car’s movements, states and changes of the system. Information of use for the reconstruction of the scan trajectory is the wheel rotational speed, average wheel speed, yaw rate, steering angle and the side acceleration. The sensor data is transferred via the car’s field bus (in most cases a controller area network (CAN-Bus)) for information exchange and interaction between different hardware-components of the vehicle. Systems like ESP or the Traction Control System (TCS) require real time capabilities for successful operation. The information must be delivered with minimum latency and within a known deadline (worst case response time). These aspects are fulfilled by the car’s field bus system.
All mentioned sensors and sensor messages are communicated over the Engine-CAN-Bus, a high speed CAN with a transfer rate of 500kBit per second. The other available busses contained are two low speed systems: the Comfort CAN and the Infotainment CAN, each with a transfer rate of 100kBit/sec, which are of no further importance for this work.
Regarding the suitability of the car interior sensors and sensor messages for mobile laser scanning, a detailed analysis about accuracy, repetition rate and availability has been presented in Heinzel, 2006. From the sensor messages available on the field bus, the following were rated as efficient:
Mono wheel rotational speed (Tab.1): This message contains information about the rotational speed of each tire separately. The information is based on the impulse induced from the impulse wheels that are mounted at each wheel.
Resolution Repetitive Rate Range
0.01 km/h 72 (TEVES) -100 Hz (RB) 0-326 km/h
Table 1. Specification of mono wheel rotational speed sensors
Distance pulse (Tab.2): Contains the median number of the wheel rotation impulses of the front axis
Resolution Repetitive Rate Range
1 72 (TEVES) -100 Hz (RB) 0-2047
Table 2. Specification of the distance pulse sensor
Yaw rate sensor (Tab.3): Used in vehicles with ESP to measure the circular motion of the vehicle around its yaw axis.
Resolution Repetitive Rate Range
0.2°/s 50 Hz 0-100 °/s
4.2 Calibration
Measuring the calibration of the wheel circumferences the vehicles linear and angular velocity based on the wheels rotational speed requires information about the circumferences of each tire. Depending on the type of the tires, tire pressure and abrasion the circumference can vary. These differences can easily reach sizes of several centimetres and thus make a calibration of the wheel sizes essential for a successful measurement.
The calibration of the wheel circumferences was estimated in this project by driving a straight path of approximately 100 meters on a predetermined planar surface. The starting and ending position of each wheel was marked on the surface and measured, the number of rotations for every wheel was counted. To avoid slip that would influence the calibration, the vehicle was driven at very low velocities (<10km/h). From the gathered information, the circumferences were calculated as follows:
n
x
c
(1)where c = wheel circumference x = distance driven n = number of rotations
Figure 2. Visualization of track width deviations based on different wheel chambers.
Just like the wheel circumferences, the track width can vary as well. Here the aberrations from the preset length are based on differing camber inclinations (Fig. 2). For a precise reconstruction, a wheel alignment should be performed once a year, to get detailed information about the car’s real track width. To optimize measurements, a further manual calibration procedure can be performed prior to a laser scan. In the presented project, this was achieved as followed:
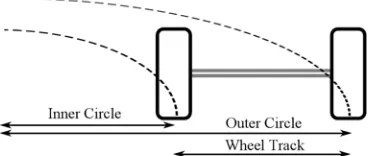
On a planar surface with minimal inclination, one or several circles are driven at low speed (< 10 km) (Fig. 3). At the beginning of the procedure, the wheel positions are marked on the street surface. The steering-angle must be fixed for the whole measurement, as any changes would corrupt the calibration. After a selected number of turns the car is stopped at the same position as at the start of the process.
To compute the track width, the distance driven by each of the two rear wheels is calculated from the given sensor information.
Figure 3. Manual calibration procedure to determine the wheel track length.
The distance driven by the wheels corresponds to n-times the circumference of the driven circles after n-turns. The track width is then obtained as follows:
n
x
x
r
r
Δ
d
O II
O
2
(2)where
Δ
d
=wheel track (outer - inner radius)rO, rI = outer, inner distance
n = number of turns
Besides the calibration of the vehicle’s sensor system, the complete mobile scan system also needs calibration regarding the positioning and orientation of the laser scan device in relation to the sensor systems (Fig. 4). Knowing the position of the sensors, the relative position of the scan device can be directly measured using surveying systems, such as theodolite based measurements.
Figure 4. Volkswagen Transporter T5 with equipped laser scan device (Z+F Imager 5006) at the car’s rear end. Top: Variation of the yaw angle. Bottom: Variation of the scanner’s pitch angle.
4.3 Computing the trajectory
The results of the research by Heinzel 2006 aimed at the generation of sufficient trajectories for mobile laser scan applications. As such, the specifications given were low and generally steady velocities.
direction. These two components are estimated separately and then used to update the car’s position and orientation in every time step.
Estimating the distance driven during an interval, the distance impulse data and mono wheel rotational speed can be utilized. The distance impulse data returns the information about the median number of impulses that were induced by the front wheels for the time interval:
C
Y = number of impulses for one rotation C = median wheel circumference
Alternatively, using the information obtained from the wheel rotational speed, the median distance can be obtained as followed:
Same as the distance travelled during one time interval, the variation of the vehicle’s orientation can be estimated from the rotational speeds:
As the vehicle’s yaw rate sensor offers direct information about the angular velority, the variation of the orientation can also be achieved in this way:
Using the distance driven during a time step, the vehicle’s position and rotation is updated:
Finally, the complete trajectory is obtained from the position and orientation of the vehicle in all time steps.
5. SYNCHRONIZATION WITH SCAN DATA
To realize a complete 3D point cloud of the scanned environment, the reconstructed trajectory has to be mapped onto the 2D profile scan data. For this purpose, the synchronization of both groups: laser scan device and the car’s trajectory is required. In the presented project, synchronization was achieved via timestamp impulses signalling the beginning and ending of the measurement.
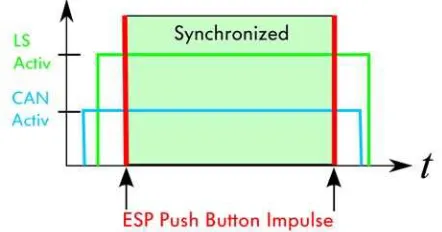
Figure 5. Time diagram showing the activity times of the laser scan device (LS) and the field bus system (here: CAN-Bus), as well as the synchronized period with the ESP Impulse.
The complete scan procedure was executed as follows: At start up of the system, the CAN-Bus data is read by an analyzing tool such as CANalyzer (Vector 2010). As a next step, the laser scan device is initialized for the profile scanning process. As soon as both systems are active and running, the beginning of the actual scan is marked via a timestamp impulse, triggered by the user (Fig. 5). The scan is then executed and at the end of the procedure, a further timestamp impulse is triggered to mark the completion of the scan. Following to that, the systems (scan device and analysis of the CAN messages) are shut down to finalize the scan.
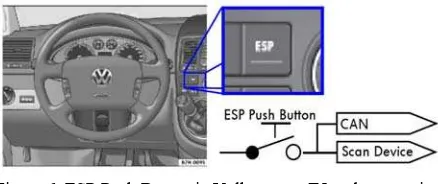
Figure 6. ESP Push Button in Volkswagen T5 and connection diagram
At the same time, the impulse is also sent to the car’s field bus system. As the associated signal has a high priority for transmission over the field bus, minimal latencies can also be guaranteed here. Same as the sensor information, this data can be read out from the field bus together with its time information.
The reason for selecting the ESP push button signal is based on its high priority and availability. Other elements of the car’s cockpit are also conceivable for the given purpose, yet regarding their priority and associated field bus transfer speed, the maximum latencies can vary.
In a post processing step, the times of the two data streams are adjusted based on the included time stamp impulses. In this way, beginning and duration of the scan process are synchronized.
6. COMPUTATION OF THE 3D POINT CLOUD
As shown earlier, the computed trajectory data contains the information about the vehicles position and orientation for every given time step. For the creation of the 3D point cloud representation, the laser scan device’s position relative to the car has first to be mapped onto its trajectory to calculate the actual transformation matrices for each time step:
s
The 3D position of each pixel is then computed as followed:
s
pl = local pixel position (scan coord. System) R’g,s , T’g,s = interpolated global rotation and
translation matrices
whereas the used rotation and translation matrices are interpolated from the two time increments the relating pixel lies between: after the scan pixel
Rτ1g,s, R τ2
g,s = orientation of time steps before and after the scan pixel
7. RESULTS
The quality of the resulting scans is currently directly dependent on the accuracy of the available sensors and the driving velocity of the MLS. In this regard, the scan procedure benefits in two ways from low velocities during surveys:
Besides the obvious advantage of a high scan line density, exterior influences that could interfere with the scan (e.g. the slip of the car), are minimized. The presented prototype already shows good results regarding scans of extend of few hundred meters when driving on planar surfaces (Fig 7.) (Fig.8). As the sensor elements have a fixed accuracy and local error, the global error of the estimation grows in relation to the distance and the curvature driven.
Figure 7. Scan result of a land road (206 meter)
8. CONCLUSION AND FUTURE PROSPECTS
In the current stage of development, the scan trajectory is still limited to planar street surfaces as inclination angles can’t be measured with the sensors offered by the vehicle. For this purpose, two extensions of the system are in development.
The Imager 5006 that was used as laser scan device already includes an inclination sensor which is synchronized with the scan itself and also written back to the line-header information of the scan file. As the scanner can capture up to 100 lines per second, the resulting scan can also contain information about the car’s pitch with 100 Hz. Yet, the included sensor is not sufficient for the usage in mobile scan applications due to its long settling times of several seconds. For this reason, an alternative levelling sensor with better suited performance and same serial interface was selected and built into the scan device. Together with the existing solution for the trajectory, the obtained data will allow the acquisition of environments with varying inclination angle.
Another planned extension is the improvement of the trajectory, using structure from motion (Wook 2007). Here, camera data is used to gather information about the 3D positioning of objects. Using an image sequence of a single, moving camera, structure from motion can also be achieved using a mono camera. Same as 3D information about the objects within the pictures, the 3D position of the camera itself can be reconstructed. In combination with the car’s sensor data, this approach promises a good solution for mobile laser scanning applications. A fusion of both systems can help to minimize the localization error of the vehicle and thus allowing for an even higher precision regarding the 3D trajectory of the laser scan procedure.
Advantageous for this aim is the availability of the required mono camera, which is used in driver assistance systems of Volkswagen. Systems such as the lane keeping assistant already use camera information to gather structure from motion. Thus, the complexity for the development and application of this approach can be highly reduced.
Another essential advantage of this approach is the complete independence from any GNSS. As such, mobile laser scans can also be realized in surroundings with bad or none GPS reception, like tunnels or inner city areas with high building densities.
REFERENCES
Davis, R.I., Burns, A., Bril, R. J., Lukkien, J.J., 2007. Controller Area Network (CAN) schedulability analysis: Refuted, revisited and revised. Real Time Systems, 35(3),pp.239-272
Heinzel, T. 2006. Usage of automotive sensor signals for dynamic laser measuring of accident scenes. Institute for Vehicle Construction, Wolfsburg
Reif, K. 2001. Automotive Sensors, Vieweg+Teubner, ISBN:978-3-8348-1315-2
Zoller+Froehlich GmbH 2009. Manual – Profiler Mode,
Imager 5006 Documentation
Wook, P., Pagel, F., Grinberg M., Willersinn D. 2007.
Odometry-Based Structure from Motion. Intelligent Vehicles Symposium IEEE, pp. 1112-1117
Tchouankem, H. N. 2010. Entwicklung und Optimierung verschiedener Odometrie-Ansätze für Fahrerassistenzsystem, RWTH Aachen
Vector Informatik GmbH 2010, Canalyzer,
www.vector.com/vi_canalyzer_en.html
Bento, L. C., Nunes, U., Moita F., Surrecio, A. 2005, Sensor Fusion for Precise Autonomous Vehicle Navigation in Outdoor Semi-structured Environments.Conference on Intelligent Transportation Systems IEEE, pp. 245 – 250
Jungmichel M., Niemeier W., Schäfer M., Thomsen S. 2006.
3D Erfassung von Unfallstellen durch Laserscanning. VKU Verkehrsunfall und Fahrzeugtechnik
Rieger, P., Studnicka N., Pfennigbauer M., Ullrich A. 2010.
Advances in Mobile Laser Scanning Data Acquisition. FIG Congress Comission 5 Positioning and Measurement
Bonnifait P., Bouron P., Crubille P., Meizel D. 2001. Data Fusion of Four ABS Sensors and GPS for an Enhanced Localization of Car-like Vehicles. International Conference on Robotics and Automation IEEE, ICRA (3), pp.1597-1602