LIDAR PHOTOGRAMMETRY AND ITS DATA ORGANIZATION
Xiangyun Hua*, Zuxun Zhanga, Yansong Duana, Yongjun Zhanga, Junfeng Zhua, Huaping Longb aSchool of Remote Sensing and Information Engineering, Wuhan University, Wuhan 430079, China
bGuangzhou Jiantong Mapping Technology Development Co. Ltd, 1207 Gaopu Road, Guangzhou, China
[email protected], [email protected], [email protected], [email protected], [email protected], [email protected]KEY WORDS: LiDAR, Photogrammetry, Integrated Sensor System, LiDAR Photogrammetry, Data Organization
ABSTRACT:
Light detection and ranging (LiDAR) is a technology capable of measuring geo-referenced coordinate of object points in a straightforward way. It has been widely used in mapping projects in last 20 years. LiDAR and photogrammetry has their own advantages and disadvantages that compensate for each other very well. The combination of the two definitely can achieve more efficient and precise acquisition of geospatial information. Nowadays main LiDAR system vendors are providing integrated laser scanning and camera sensors in many of their systems (or at least offering camera as optional equipment). This makes seamlessly integrating the two technologies possible, but the potential of the integrated system has to be explored yet. In this paper we propose a new subject – LiDAR photogrammetry based on the integrated sensor system and discuss its research scope and fundamental topics (or techniques to be developed). Organizing integrated data properly is the first step in LiDAR photogrammetry because existing image and LiDAR point cloud data are organized separately that leads to inefficient data access and usage in processing. Based on the extension of LAS format we propose a new data organization scheme called DPL format. Examples are given to show advantages of the new data organization method.
1. INTRODUCTION
As a revolutionary technology in surveying and mapping, airborne LiDAR (Light Detection and Ranging) integrates GNSS (Global Navigation Satellite System GNSS), INS (Inertial Navigation System), laser scanning and ranging technologies together, enables direct measurement of three dimensional coordinates of ground objects, so that acquisition of digital surface model can be obtained quickly. Photogrammetry as a mature mapping technology has been used for producing topographic maps in various scales for a much longer time than LiDAR. LiDAR versus photogrammetry has been an interesting topic to discuss since the emergence of LiDAR in last 20 years (Baltsavias, 1999b; Habib, 2010). Although imagery based 3D vision gains ground in point density and geometric accuracy thanks to increase of overlap between images, improved radiometry, significant progresses in multi-view matching, and GPU (Graphic Processing Unit) power of computation (Leberl et.al., 2010), still the advantages and disadvantages of LiDAR and photogrammetry well compensate for each other: (1). Horizontal error from photogrammetry is usually smaller than that from LiDAR while LiDAR can obtain higher vertical accuracy than horizontal accuracy (Baltsavias, 1999a; Baltsavias, 1999b). (2). From imagery, object boundaries, terrain break lines may be extracted easier and more accurately while from LiDAR point cloud it is harder to obtain such information and there are systematic errors in extraction of some objects, i.e. contour of buildings (Matikainen et.al., 2009) and height of tree tops (Yu et.al., 2004). (3). Laser scanning has penetration capability with multiple signal echoes that enables recovery of vertical structures like trees while from imagery it is almost impossible to do so. Based on the compensation nature of the two technologies, integrated processing of LiDAR point cloud and imagery has been an active area in recent years, including DEM extraction (McIntosh and Krupnik, 2004), man-made object extraction (Hu et.al., 2004; Sohn and Dowman, 2007), aerial triangulation and orthorectification (Habib, 2010). ISPRS commission III initiates a ‘Test Project on Urban Classification and 3D Building Reconstruction’ that uses LiDAR data and high resolution imagery as the test dataset(Rottensteiner et.al., 2011). Most of the research on integrated processing of point
cloud and imagery use data collected from different sensor systems and flights. Airborne LiDAR and imaging systems have the price tag in the range of a million US dollars. Integrating the two sensors into one system is a significant way to reduce the cost in the hardware side because it can share one POS (Position and Orientation System) for direct geo-referencing, and collecting point cloud and images can be completed by one flight that further reduces the total time and cost of data collection. In some applications, such as emergent response for disaster management, flying twice using LiDAR and imaging systems separately is obviously not efficient compared with using an integrated system by one flight.
Sensor integration is one of the trends in earth observation and remote sensing. Nowadays main LiADR vendors are providing integrated laser scanning and imaging sensor systems. For example, by checking vendors’ websites we can find that Optech’s ALTM Orion, Pegasus and Gemini airborne LiDAR systems, Leica Geosystems ALS 50II, ALS 60, TopoSys’ Harrier 56 system, and Riegl’s RIEGL VZ-400 all have a metric camera integrated or as an optional component. In resolution and quality of calibration and so on the cameras integrated of course can not compete with the ones used in the airborne imaging systems such as Leica’s ADS 40, ADS 80, Intergraph’s RMK-D&Dx, and Microsoft’s UltraCam XpWA. On the other hand, thanks to the progress of imaging technology, the integrated cameras can capture up to 60M pixels and reach 5cm ground resolution. Currently the cameras used in the integrated systems are usually only used for generating ortho photos or inspection/visualization. The full potential of the integrated processing of LiDAR point cloud and imagery based on an integrated system has to be explored yet.
In this paper we first discuss a new subject ‘LiDAR photogrammetry’ based on integrated laser scanning and imaging system. The research scope and fundamental topics (or techniques to be developed) of LiDAR photogrammetry are proposed. The first step of the integrated processing of LiDAR point cloud and images is to organize the data properly because existing image and LiDAR point cloud data are organized separately that leads to inefficient data access and usage in processing. We propose a new data organization scheme based
* Corresponding author
International Archives of the Photogrammetry, Remote Sensing and Spatial Information Sciences, Volume XXXVIII-5/W12, 2011 ISPRS Calgary 2011 Workshop, 29-31 August 2011, Calgary, Canada
on indexing, which can effectively speed up the access and usage of both LiDAR point cloud data and imagery.
2. LIDAR PHOTOGRAMMETRY AND ITS RESEARCH TOPICS
The rationale of LiDAR photogrammetry is to use imagery captured with the integrated camera for more accurate and efficient acquirement of geospatial information: (1). From LiDAR point cloud it is difficult to identify corresponding ground objects or features so that it is harder to ensure geometric accuracy of the data than photogrammetry does. (2). Spectral information from imagery can well compensate for LiDAR to accurately delineate, reconstruct 3D and visualize objects.
2.1 Integrated laser scanning and imaging system
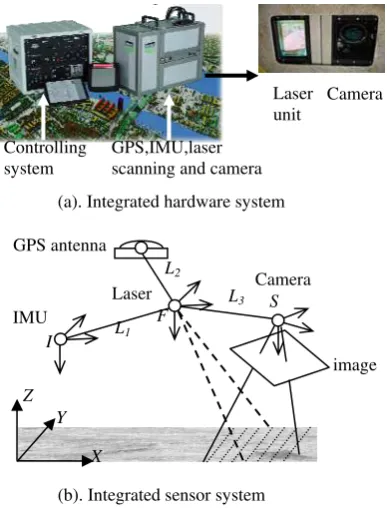
Taking an example of TopoSys’ Harrier56/68i, figure 1 shows an integrated LiDAR and imaging system. In figure 1(b)
L1,L2,L3 are the lever arms between IMU (Inertial Measurement Unit), firing point of the laser beam, GPS antenna, and the center of camera photographing. The highly coupling system shares one POS offering direct geo-referencing for both the LiDAR and camera system. It enables data collection of point cloud and imagery simultaneously and opens door to efficient and convenient technology integration of LiDAR and photogrammetry. Figure 2 shows the data obtained from one flight by the system.
2.2 Research topics of LiDAR photogrammetry
LiDAR photogrammetry is the principle, methodology and technique of using integrated LiDAR and imaging system to acquire and process point cloud and imagery in order to extract and restore geospatial information of the scene more efficiently and accurately than using one sensor system. The research
topics of LiDAR photogrammetry should include but not be limited to:
(1). The method and technique of geometric calibration of POS, laser scanning and camera. Lever arms and orientation biases need to be determined before the flight. (2). High precision registration of point cloud and imagery. The error from POS is the main source of geometric errors of the system. Using aerial triangulation combined with image feature extraction and image matching, it is feasible to use photogrammetry for high precision computation of the position and orientation parameters. General control information, i.e., a small number of GCPs and LiDAR points can be utilized to help the task. Based on the improved position and orientation point cloud and imagery can be precisely registered. (3). Automatic and intelligent geospatial information extraction based on precisely registered point cloud and imagery. This includes: (a) methods of data fusion that need to attack the occlusion problems etc; (b) image feature extraction guided by the LiDAR points; (c) high density point cloud generation by image matching by the guidance of LiDAR points; (d) data fusion based digital terrain model extraction, object classification and extraction; (e) fast true ortho photo generation, 3D reconstruction and scene visualization.
3. DATA ORGANIZATION FOR LIDAR PHOTOGRAMMETRY
3.1 Current way of data organization of LiDAR point cloud and imagery
Current common way of storing and managing LiDAR point cloud is using LAS format (ASPRS, 2010), which is supported by most of the commercial products and used in the research community. Imagery is usually stored and organized by image files, such as geo-tiff format. LAS is a compromise between storage efficiency and richness of the data contained in the file. LAS does not contain any information about the image taken from the same platform. Typically be ordered by GPS time, point records in LAS format are not guaranteed to be stored in any order. It needs to reorganize the points into other forms, like Quad Tree representation for indexing or accessing spatial neighbor points quickly. In order to do integrated data processing in LiDAR photogrammetry more efficiently, we propose a new scheme of data organization of point cloud and imagery based on the extension of widely used LAS format. Figure 1. Integrated LiDAR and imaging system
Controlling system
GPS,IMU,laser scanning and camera
Laser Camera unit
Image Point cloud
(a). Integrated hardware system
GPS antenna
L2
(b). Integrated sensor system
L1
IMU
L3
I
F S
Camera
Laser Point cloud fused with image
image
Z Y
X
Figure 2. Data acquired from the integrated system International Archives of the Photogrammetry, Remote Sensing and Spatial Information Sciences, Volume XXXVIII-5/W12, 2011
ISPRS Calgary 2011 Workshop, 29-31 August 2011, Calgary, Canada
3.2 Extension of LAS for organization of point cloud and imagery – a new format DPL
Based on the LAS format it supports extension that can be used for storage of additional useful data in the Variable Length Record Header (ASPRS, 2010). The new data organization uses the extension to deal with two main issues: (1) establish the relations between point cloud and corresponding images covering the same area; (2) to build up topology of LiDAR points for fast accessing of neighbor points and spatial analysis. We call the new file format DPL (DPGrid LiDAR, where DPGrid is named after the ‘Digital Photogrammetry Grid’ technology we developed for high performance grid computation in digital photogrammetry).
Tags Details
1.Coupling images with point cloud
1.image file names
2.image orientation parameters
3.average flight height 4.horizontal offset and rotation between point cloud and images…
2.LiDAR scan line information
1.total number of scan lines
2.start and end point number of each scan line …
3.LiDAR scan line coupling with images
1.start/end number of scan lines to every image
4.Point statistics
1.histogram of heights 2.average height and standard deviation of the point heights
3.point density …
5.Point topology
1.size of the grid used for topology
2.row and column number of the grid 3.grid data: number of the first point in each grid
Table 1. Tags recorded in the extension of LAS format
Table 1 shows the tags to be recorded in the extension of LAS format. These tags are used for programs to access corresponding images and related information easily. Figure 3 illustrates how the tags in the extension can be employed to fast access the image coupled with the point cloud. The flight direction is used for setting up a coordinate system on the ground. Tag 1 and 3 connect the point cloud with images by computing the position of images with orientation parameters. Tag 2 and 4 record the scan line information. The statistics can be used for noise removal and blunders detection. Tag 5 is actually a regular grid dividing the point could into even areas. The grid size can be a small number like 2 meters. For each grid unit, the matrix records only the number of the first point in the whole LAS point records. The storage is saved by only storing one index (number) for one grid. Additional indexing needs to be used for building up the topology for all points, in other word, using the indexing one should be able to access all point inside
any grid quickly. We add one tag to each point record to store the point number of the next point inside the same grid. Figure 4 illustrates the method. Using this chain coding method one can easily and quickly access neighbour points within an area (a grid or a few grids) from the point cloud recorded without order.
Image Scan line Flight direction
Grid for the point cloud
point
Figure3. Illustration of tags for integrated data organization
Point records
3.3 Performance test on DPL format
In order to verify the effectiveness of our new data organization method, we tested a dataset of LiDAR point cloud stored by LAS file and images. The test dataset includes 5 images and corresponding LiDAR point cloud recorded by a LAS file with the size of 307M bytes (16119353 points). The true colour image size is 72K by 54K pixels. The computer used in the test has a CPU Intel Core P8800 with 2.66G Hz, 2G of memory and SATA hard disk with 500G storage.
We first generated a new DPL file based on the proposed method. Test 1 is to test reading all LiDAR points corresponding to each image by the ordinary method and accessing our new DPL file, respectively. By the ordinary method one needs to read all LAS point records and project every point onto the image by the orientation parameters so as to determine if the point is within the spatial range of the image. Using DPL file, thanks to the tags added we only need to use them as the indices to read corresponding scan lines directly. Table 2 shows the time difference of using the two methods indicating the significant time reduction by using our method.
Figure 4. Using additional index for accessing all points in a grid
P1
P3
Grid
n2 P2
P2
P1
P3
n1
n3 n1
n2
International Archives of the Photogrammetry, Remote Sensing and Spatial Information Sciences, Volume XXXVIII-5/W12, 2011 ISPRS Calgary 2011 Workshop, 29-31 August 2011, Calgary, Canada
The only cost of our method is generating the new file once which takes about 5 seconds. For frequent accessing of the LiDAR points related to images in LiDAR photogrammetry, the new data organization can speed up the process significantly. This is important especially for some time incentive applications.
Reading LAS DPL
1st image 4625 906
2nd image 8219 906
3rd image 11844 906
4th image 15594 906
5th image 19296 906
*The time unit shown in the table is millisecond Table 2. Time of reading all points on one image
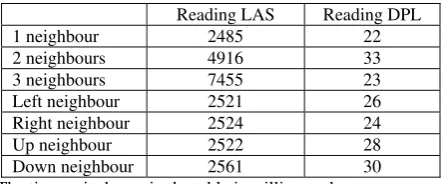
In test 2, we test the effectiveness of the topology built up by the grid and chain coding index method as depicted in figure 4. The test is to access neighbour points of one LiDAR point. Table 3 shows the difference between accessing LAS file and the DPL file. Reading LAS file is first to read all point records into memory and traverse all points to find the neighbours. Reading DPL one only needs to access very limited number of point records by taking advantages of the grid indexing method, and it accesses the file directly so that the memory usage is saved greatly too. The cost of DPL is larger file size than LAS, but compared with the time and memory usage saved it can be neglected.
Reading LAS Reading DPL
1 neighbour 2485 22
2 neighbours 4916 33
3 neighbours 7455 23
Left neighbour 2521 26
Right neighbour 2524 24
Up neighbour 2522 28
Down neighbour 2561 30
*The time unit shown in the table is millisecond
Table 3 Time of accessing neighbour points of one LiDAR point
4. CONCLUSION
In this paper we propose a new subject LiDAR photogrammetry based on integrated LiDAR and imaging system. The general research topics are discussed. As an example of the sensor integration trend in remote sensing, the integrated LiDAR and imaging system laid out the foundation of highly cooperative combination of the two to benefit the fast and accurate acquisition of geospatial information. Automatic, intelligent and accurate data processing theory, methods and algorithm have to be studied and developed in order to fully empower the advantages of the integrated system.
Popular LAS format used in LiDAR data processing does not well support image coupled processing. We propose a new data organization format DPL that takes into account image information and point topology by adding tags and indices. The experiments indicate the effectiveness of our new method in data access efficiency.
ACKNOWLEGEMENTS
The authors thank Guangzhou Jiantong Mapping Technology Development Co. Ltd, Guangzhou, China, for providing the datasets for the experiments.
REFERENCE
Baltsavias, E.P., 1999a. Airborne laser scanning: Basic relations and formulas. ISPRS Journal of Photogrammetry & Remote Sensing, 54 (2-3): 199-214.
Baltsavias,E.P., 1999b. A comparison between photogrammetry and laser scanning, ISPRS Journal of Photogrammetry and Remote Sensing, 54(2-3):83-94.
Matikainen, L., Hyyppä, J., and Kaartinen, H., 2009. Comparison between first pulse and last pulse laser scanner data in the automatic detection of buildings, Photogrammetric Engineering & Remote Sensing, 75(2) :133–146.
Yu, X., J. Hyyppä, H. Kaartinen, and M. Maltamo, 2004. Automatic detection of harvested trees and determination of forest growth using airborne laser scanning, Remote Sensing of Environment, 90:451–462.
Sohn G., and Dowman, I., 2007. Data fusion of high-resolution satellite imagery and LiDAR data for automatic building extraction, ISPRS Journal of Photogrammetry & Remote Sensing, 62: 43–63.
Habib, A., 2010. Integration of LiDAR and photogrammetric data: triangulation and orthorectification, in Shan and Toth (eds): Topographic Laser Ranging and Scanning-- Principles and Processing. Taylor & Francis Group. pp. 371-401.
Hu, X., Tao, C.V., and Hu, Y., 2004. Automatic road extraction from dense urban area by integrated processing of high resolution imagery and LIDAR data, International Archives of Photogrammetry, Remote Sensing and Spatial Information Science, 36(B3), 288.
McIntosh, K., Krupnik, A., 2002. Integration of laser-derived DSMs and matched image edges for generating an accurate surface model. ISPRS Journal of Photogrammetry & Remote Sensing, 56: 167– 176.
Leberl, F., Irschara, A., Pock, T., Meixner, P., Gruber, M., Scholz, S., and Wiechert, A., 2010. Point clouds: Lidar versus 3D Vision, Photogrammetric Engineering & Remote Sensing
76(10): 1123–1134.
ASPRS, 2010. LAS Specification version 1.3–R11, The American Society for Photogrammetry & Remote Sensing. URL:
http://www.asprs.org/society/committees/standards/LAS_1_3_r 11.pdf.
Rottensteiner, F., Baillard, C., Sohn, G., Gerke, M.,, 2011, ISPRS test project on urban classification and 3D building reconstruction. URL: http://www.commission3.isprs.org/wg4/ International Archives of the Photogrammetry, Remote Sensing and Spatial Information Sciences, Volume XXXVIII-5/W12, 2011
ISPRS Calgary 2011 Workshop, 29-31 August 2011, Calgary, Canada