isprs annals IV 2 W4 139 2017
Teks penuh
Gambar

Garis besar
Dokumen terkait
A simplified Persistent Scatterer Interferometry (PSI) approach is used to monitor the displacements of the Nanjing Dashengguan Yangtze River High-speed Railway
To arrange the location of panorama sites, it is important to make a balance between the panoramic im- age quality and the number of panoramas, given that the more the panorama
Specifically, the strapdown inertial sensor (SINS) algorithm and the fingerprinting method are used to calculate the basic location information and the auxiliary
The quality of the results for section 3 (reflection removal, wall detection, opening detection) depends on the segmentation and generation of surface patches. An ideal
In the second step, the vehicle class is recognized by the similarity between the profile shape of the potential vehicle segment and a directed real vehicle profile based
The basic idea of the method is to use decomposed waveform information and robust estimation theory to help the selection of seed points; and the surface
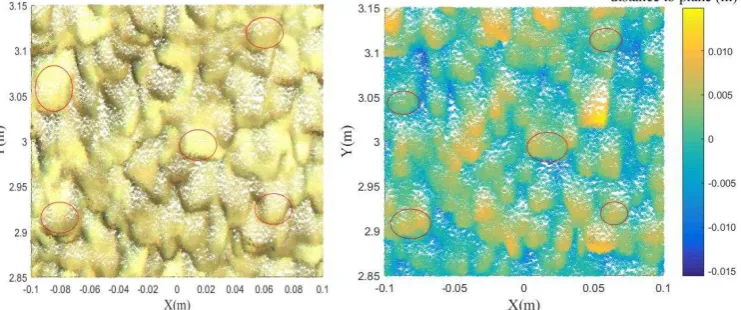
The middle image shows the corrected data, and this is then compared to the ref- erence frame and the resulting point to point error is shown in the right image.. The resulting
Provided the cooling is slow enough, the particles can arrange themselves in states of increasingly lower energy, leading eventually to the state of lowest energy,
